Abstract
Effects of high fat diet (HFD) on obesity and, subsequently, on diabetes are highly variable and modulated by genetics in both humans and rodents. In this report, we characterized the response of Goto-Kakizaki (GK) rats, a spontaneous polygenic model for lean diabetes and healthy Wistar-Kyoto (WKY) controls, to high fat feeding from weaning to 20 weeks of age. Animals fed either normal diet or HFD were sacrificed at 4, 8, 12, 16 and 20 weeks of age and a wide array of physiological measurements were made along with gene expression profiling using Affymetrix gene array chips. Mining of the microarray data identified differentially regulated genes (involved in inflammation, metabolism, transcription regulation, and signaling) in diabetic animals, as well as the response of both strains to HFD. Functional annotation suggested that HFD increased inflammatory differences between the two strains. Chronic inflammation driven by heightened innate immune response was identified to be present in GK animals regardless of diet. In addition, compensatory mechanisms by which WKY animals on HFD resisted the development of diabetes were identified, thus illustrating the complexity of diabetes disease progression.
Keywords: diabetes, high fat diet, gene expression, microarray
Introduction
Intake of excess dietary fat is associated with a variety of systemic disease processes, including obesity and type 2 diabetes, which are often inter-related. Over time, a high fat diet (HFD) can cause pathological changes in many organ systems including the liver. In the liver, changes can include insulin resistance and steatosis (fat accumulation) which can progress to nonalcoholic steatohepatitis (NASH) and ultimately to liver cirrhosis.1–4 Mechanistically, steatosis, insulin resistance, and type 2 diabetes are often interconnected. Uptake of glucose into the liver is highly controlled by the blood glucose concentration since it is carried out by GLUT2, the high Km non-insulin dependent transporter. Therefore, chronic hyperglycemia causes the liver to take up excessive amounts of glucose. An insulin resistant liver with impaired glycogen synthesis can use the excess glucose for lipid synthesis, resulting in steatosis.
However, the consequences of a HFD are modulated by genetics in both humans and rodents. Increased fat intake will result in varying degrees of obesity and associated pathologies in different individuals, and the link between obesity and diabetes is not absolute. Not all obese people develop type 2 diabetes, and all diabetics are not obese.5 For example, the majority of Western type 2 diabetics have body mass indexes that exceed 25 kg/m2 and are thus considered overweight to obese (>30 kg/m2). In contrast, about sixty percent of Asian type 2 diabetics have body mass indexes less than 25 kg/m2 and are thus classified as “lean” diabetics. Just as all obese humans do not develop type 2 diabetes and all individuals with type 2 diabetes are not obese, the same is true of rodent models. Rodent models are extensively employed to study diet-related pathologies, and strain differences in response to diet can provide insight into the link between diet and diet-induced pathological changes.2
Goto-Kakizaki (GK) rats exhibit a spontaneous polygenic form of diabetes and are a commonly used animal model for diabetes studies. Elevated blood glucose and peripheral insulin resistance are a common characteristic of these animals.6,7 Although most diabetic rat models involve obesity, a non-obese phenotype is a consistent feature of the GK rat model. Previously, we described an extensive analysis of the liver from male GK and control Wistar-Kyoto (WKY) rats from weaning through 20 weeks of age.8 Our analysis, which involved the extensive application of gene arrays, suggested that in the livers of the GK rats there is extensive inflammation caused by chronic activation of innate immunity that is not evident in the livers of control WKY animals. An unanswered question is whether chronic high fat feeding will exacerbate diabetes and/or indices of heightened inflammation in this lean animal model.
In the present report, we examine the response of both strains to high fat feeding from weaning to 20 weeks of age with subgroups sacrificed at 4, 8, 12, 16, and 20 weeks. Within the context of extensive physiological measurements we were able to identify genes whose expression is different between the two strains regardless of diet. Prominent among these genes are those related to inflammation. In addition, we identified genes that responded to HFD in both strains as well as those whose response to HFD was unique to either GK or WKY.
Materials and Methods
Experimental design
This study involved 25 GK spontaneously diabetic and 25 WKY control male rats obtained from Taconic Farms (Germantown, NY). Our research protocol adheres to the “Principles of Laboratory Animal Care” (NIH publication 85-23, revised in 1985) and was approved by the University at Buffalo Institutional Animal Care and Use Committee. Animals were received at 21 ± 3 days of age. For experimental purposes, all animals were considered 22 days old at the time of arrival. Rats were maintained in a separate room in our animal facilities under stringent environmental conditions that included strict adherence to 12 hour:12 hour light:dark cycles. All animal manipulations and care were carried out between 1.5 and 3.5 hours after lights on. Animals were housed in individual cages with free access to HFD containing 45% energy from fat (Harlan Teklad TD.06415) and water. Food intake and body weights were measured twice weekly on all animals. Five animals from each strain were sacrificed at 5 different ages: 4, 8, 12, 16, and 20 weeks. Comparison was made to equivalent animal fed a normal diet (Harlan Teklad 2016—10% energy from fat). At the time of sacrifice, animals were anesthetized with ketamine (80 mg/kg)/valium (5 mg/kg) IP. Animals were sacrificed by aortic exsanguination using EDTA (4 mM final concentration) as anticoagulant. Plasma was prepared from blood by centrifugation (2000 × g, 4 °C, 15 minutes), aliquoted, and stored at −80 °C. Liver was harvested, weighed, rapidly frozen in liquid nitrogen and ware-housed at −80 °C.
Blood measurements
Blood glucose was measured from whole blood at the time of sacrifice using a BD Logic blood glucose meter (BD Medical, Franklin Lakes, NJ). Glycosylated hemoglobin (HbA1C) was measured using A1cNOW InView HbA1C test meters (Metrika, Sunnyvale, CA).
Plasma measurements
Plasma glucose was measured by the glucose oxidase method (Sigma GAGO-20) modified such that the assay was carried out in a 1 mL assay volume. Glucose assays included a standard curve consisting of 7 standard glucose concentrations with experimental samples assayed in triplicate. Insulin was measured in plasma samples using a commercial RIA (RI-13K Rat Insulin RIA Kit, Millipore Corporation, St. Charles, MO). All assays were carried out according to manufacturer’s directions with standards run in duplicate and experimental samples run in triplicate. Plasma free fatty acids were measured using the Roche Half-micro Test (Roche Applied Sciences, Indianapolis, IN) modified to a microtiter plate format as follows: 200 μL Reagent A, 10 μL samples, 10 μL Reagent 3, 10 μL Reagent B, R2 incubation time of 60 minutes. All experimental samples were measured in triplicate. A standard curve consisting of 7 concentrations of free fatty acid ranging from 0.05–1 μM was constructed from a commercial standard solution (WAKO NEFA, WAKO Chemicals, Richmond, VA). Linear regression analysis of all standard curves yielded r2 values of greater than 0.99, and intra- and inter-assay variations were less than 10%. Total cholesterol, HDL-cholesterol, LDL-cholesterol, and triglycerides were measured by colorimetric assays using reagents commercially available (WAKO Chemicals, Richmond VA) with assays adapted to a microtiter plate format as previously described.9
Liver triglycerides
Frozen liver samples were extracted with chloroform:methanol (2:1), dried, and resuspended in butanol as described.10 Extracted triglycerides were assayed colorimetrically with commercial reagents (WAKO Chemicals, Richmond, VA).
RNA preparation
Liver samples from each animal were ground into a fine powder in a mortar cooled by liquid nitrogen and 100 mg was added to 1 mL of pre-chilled Trizol Reagent (InVitrogen, Carlsbad CA). Total RNA extractions were carried out according to manufacturer’s directions and were further purified by passage through RNeasy mini-columns (QIAGEN, Valencia, CA) according to manufacturer’s protocols for RNA clean-up. Final RNA preparations were resuspended in RNase-free water and stored at −80 °C. The RNAs were quantified spectrophotometrically, and purity and integrity assessed by agarose gel electrophoresis. All samples exhibited 260/280 absorbance ratios of approximately 2.0, and all showed intact ribosomal 28S and 18S RNA bands in an approximate ratio of 2:1 as visualized by ethidium bromide staining.
Microarrays
Isolated RNA from each liver sample was used to prepare target according to manufacturer’s protocols. The biotinylated cRNAs were hybridized to 50 individual Affymetrix GeneChips Rat Genome 230-2 (Affymetrix, Inc., Santa Clara, CA), which contained more than 31,000 probe sets. The high reproducibility of in situ synthesis of oligonucleotide chips allows accurate comparison of signals generated by samples hybridized to separate arrays.
Data mining
Affymetrix Microarray Suite 5.0 (Affymetrix) was used for initial data acquisition and analysis. The signal intensities were normalized for each chip using a distribution of all genes around the 50th percentile. The generated data set was submitted to the National Center for Biotechnology Information (NCBI) Gene Expression Omnibus (GEO, http://www.ncbi.nlm.nih.gov/projects/geo/) database (GSE 13271). GeneSpring 7 (Silicon Genetics, Redwood City, CA), was employed for further analysis. In order to screen for probe sets with different expression levels in GK vs. WKY, each probe set on the five GK chips at each time point was normalized to the average of the same probe set on the five WKY chips. No difference between GK and WKY results in a value of 1. If GK is greater than WKY, the value is greater than 1 and if GK is less than WKY then the value is less than 1. Reverse normalization (individual probe set values of each WKY sample normalized to the average GK value) was performed and filtered in order to identify possible genes expressed in WKY animals but not GK animals. In order to objectively identify probe sets of interest, the entire data set was filtered with the same criteria to the ones applied to previous gene array data sets for liver, white adipose tissue and skeletal muscle for an identical experiment except the animals received a normal diet.8,11,12 This approach does not select for probe sets but rather eliminates those probe sets that do not meet certain criteria, leaving the remainder for further consideration. In brief, the first filter eliminated genes not expressed in liver using the “call” function in Affymetrix Microarray Suite 5.0. Genes that did have a call of “P” (present) in at least 5 of the 25 chips were eliminated. The second level of filtering eliminated probe sets that could not meet the basic criterion of having different expression levels in GK and WKY rats. Normalized probe sets that did not have ratios equal to or greater than 2 in at least 3 ages were eliminated from further consideration. A schematic of this filtering approach has been previously published.11
Statistics
For statistical comparisons, two-way ANOVAs were carried out using SigmaStat 3.5 software (Systat Software, Point Richmond, CA) with Tukey post-hoc tests. Since data were not normally distributed, ANOVAs were performed on rank-transformed data.
Results
Body weights
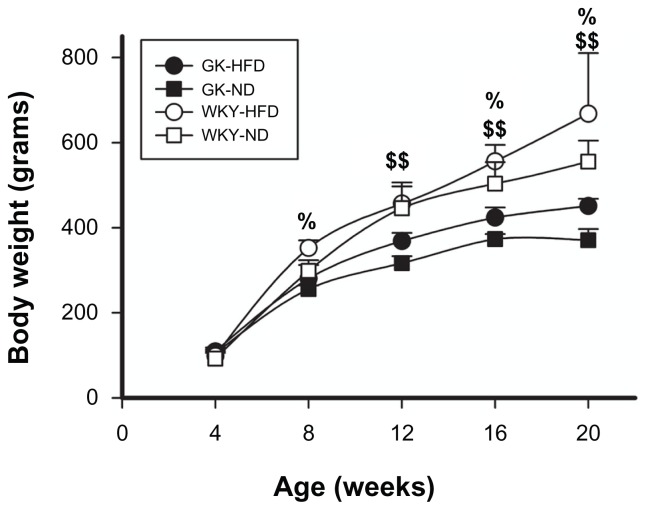
Figure 1 presents mean body weights of GK and WKY animals fed HFD compared to normal diet-fed animals throughout the course of this study. As expected, both strains of animals exhibited continual increases in body weight throughout. WKY animals fed HFD were significantly heavier than WKY animals fed normal diet by 8 weeks of age, while GK animals fed HFD did not become significantly heavier than normal diet fed animals until 12 weeks (Fig. 1). By the end of the study, the increased body weights caused by HFD-feeding were fractionally similar in both strains; by 20 weeks of age, HFD rats were 20% heavier than normal-fed animals of the same strain. However, on either diet, WKY animals became significantly heavier than GK animals by 8 weeks (HFD: P < 0.001, ND: P < 0.004). This disparity in weight became more pronounced at later ages (P < 0.001). Livers were also weighed at sacrifice. When normalized to body weight, the liver was a significantly larger percent of total body weight in the smaller GKs as compared to WKYs only at 20 weeks (data not shown). Food consumption was also measured in all animals twice weekly. Although WKY animals consumed more food in an absolute sense, when expressed as kcal/g body weight, no apparent difference in food intake was observed between strains (data not shown).
Figure 1.
Body weight as a function of age in GK and WKY rats.
Notes: Closed circles = GK-HFD; open circles = WKY-HFD; closed squares = GK-ND; open squares = WKY-ND. %WKY-HFD vs. WKY-ND, P < 0.05; $$GK-HFD vs. GK-ND, P < 0.001.
Plasma glucose and insulin
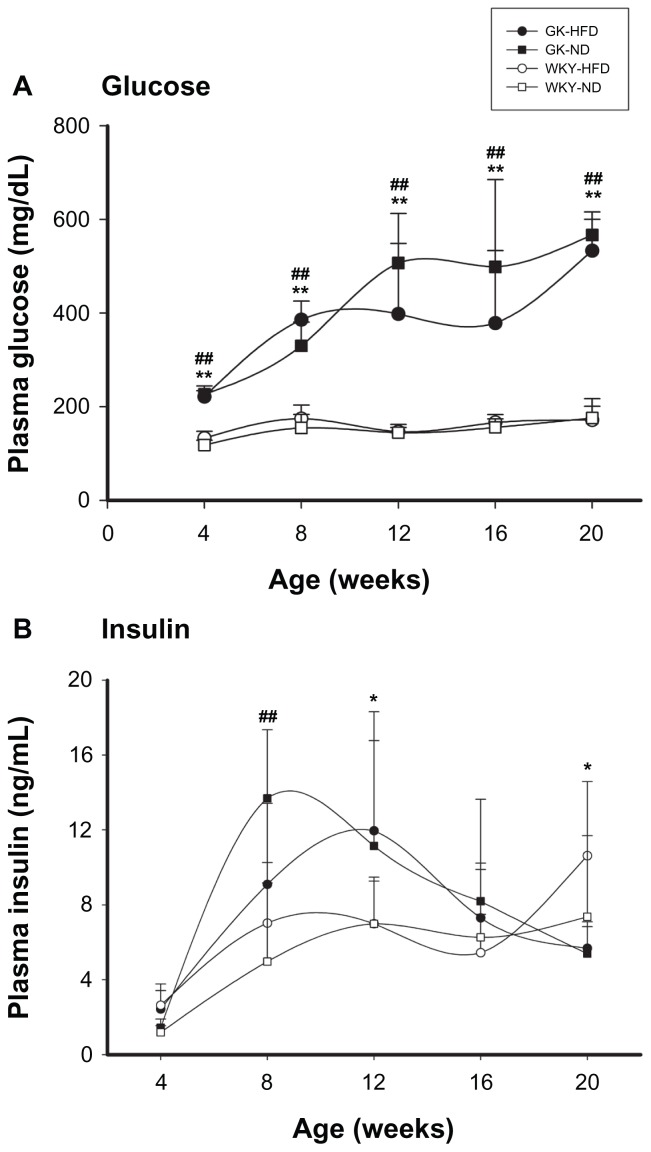
Figure 2A presents mean plasma glucose values at time of sacrifice for both strains on both diets. Plasma glucose concentrations increased with age in both strains, reaching an apparent plateau between 8 and 12 weeks of age. On comparable diets GK animals had higher plasma glucose compared to WKY animals at all ages (P < 0.001). However, HFD did not have a significant effect on plasma glucose in either strain. Glycosylated hemoglobin (HbA1C) provides a good index of glycemic control over time. Consistent with the plasma glucose data, in GK animals there was a continual increase in HbA1C over the course of the experiment from about 4% at 4 weeks of age to about 11% at 20 weeks (data not shown). In contrast, in WKY there is a small maturational increase from 4% at 4 weeks to almost 5% at 12 weeks. HFD had no effect on HbA1C in either strain.
Figure 2.
Plasma glucose (A) and insulin (B) in GK and WKY animals as a function of age.
Notes: Symbols are defined in Figure 1. ##GK-ND vs. WKY-ND, P < 0.001; *GK-HFD vs. WKY-HFD, P < 0.05; **GK-HFD vs. WKY-HFD, P < 0.001.
Plasma insulin determined from RIA analyses is presented in Figure 2B. Variation between animals within a group exhibited high standard deviations. This high variability was likely due to true animal variation rather than experimental error, since inter- assay variability averaged 4.3% ± 3.3% for all samples, and variability of quality control samples (intra-assay variability) was under 6%. In addition, samples were also analyzed by an ELISA method which, despite higher inter-assay variability, resulted in almost identical insulin profiles (data not shown). In GK ND-fed animals there was a large increase in plasma insulin between 4 and 8 weeks of age followed by a decline for the remainder of the experiment. In GK HFD-fed animals, the large increase still occurred but the peak was delayed until week 12. In control ND animals there was a moderate maturational increase in plasma insulin between 4 and 12 weeks which then became constant for the remainder of the experiment. Control animals fed HFD showed an increase by 8 weeks which was then followed by a substantial increase between 16 and 20 weeks, possibly indicating that these animals were developing some metabolic disturbance by the end of the experiment.
Lipid profiles and liver triglycerides
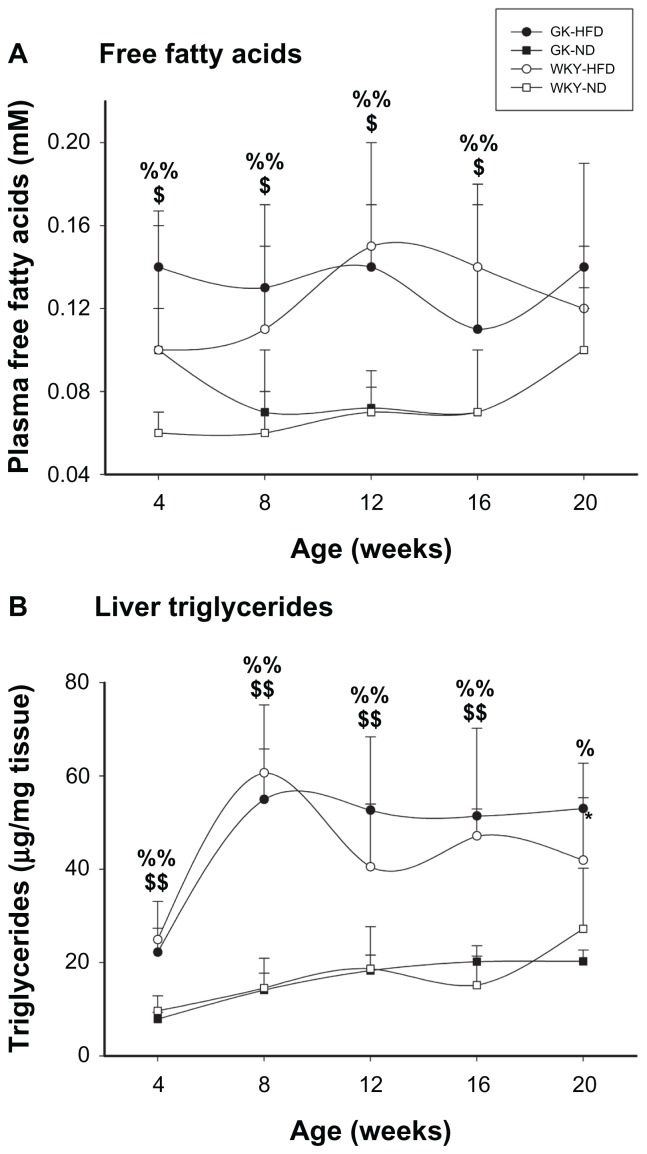
Figure 3A shows that high fat feeding significantly elevates plasma free fatty acids comparably in both strains beginning as early as 4 weeks of age. In contrast, no overt differences in plasma triglycerides, LDL, or HDL were seen throughout the 20 week experiment (data not shown). Figure 3B shows the triglyceride content in livers of WKY and GK on both diets. In both strains HFD caused a significant increase in liver triglyceride content as early as 4 weeks, and which remained elevated throughout the experiment.
Figure 3.
Plasma free fatty acids (A) and liver triglyceride content (B) in GK and WKY animals as a function of age.
Notes: Symbols are defined in Figure 1. $GK-HFD vs. GK-ND, P < 0.05; $$GK-HFD vs. GK-ND, P < 0.001; %WKY-HFD vs. WKY-ND, P < 0.05; %%WKY-HFD vs. WKY-ND, P < 0.001.
Data mining
The Affymetrix R230-2 chip contains more than 31,000 probe sets. Our initial data mining step filtered out genes not expressed in liver. By eliminating probe sets that did not get a call of present on at least 5 of the 25 chips for either GK or WKY left a remainder of 18,207 probe sets for further consideration. We next eliminated probe sets that were not differentially expressed when comparing GK-HFD to WKY-HFD. Our criteria for differential expression was a minimum 2-fold difference in normalized probe set intensity occurring in at least 3 or more ages. This filter was performed on both GK-HFD samples normalized to WKY-HFD and WKY-HFD normalized to GK-HFD. The total number of probe sets retained as differentially expressed after filtering was 495.
Data analysis
Affymetrix provides an accession number for the sequence from which each probe set was built. We submitted the accession number of each selected probe set to the NCBI Basic Local Alignment Search Tool (BLAST) to identify, as closely as possible, its gene. Of the 495 probe sets, there were 107 probe sets that could not be identified by the BLAST of their accession numbers. In addition, in several instances there were multiple probe sets for the same gene. This left 368 identifiable individual genes. These genes were then submitted to NCBI “across database search” primarily to identify all aliases and alternate symbols. The preferred symbol was submitted to NCBI AceView as well as extensive PubMed Boolean logic searches to ascertain the function of the gene in liver. Based on these searches we separated the genes into groups based on their function in the liver. These groups were as follows: Transcription/Translation; Signaling; Protein Processing; Lipid Metabolism; Carbohydrate Metabolism; Immune/Inflammatory; Small Molecule Metabolism; Cell Cycle Control; Mitochondrial; and Transport. An additional 42 genes which did not readily fit into these categories were grouped as Other, and the 107 probe sets not identifiable by BLAST were listed as ESTs. Clearly such functional categorizations are not perfect because overlaps exist. For example, a signaling molecule such as Cxcl14 that is central to a chemokine signaling pathway was placed in Immune/Inflammatory, not Signaling. Supplementary Table 1 provides a list of all differentially regulated genes organized by these functional categories, and includes their probe set ID, accession number, gene name, symbol, their function, and which strain was higher.
GK compared to WKY animals when fed HFD
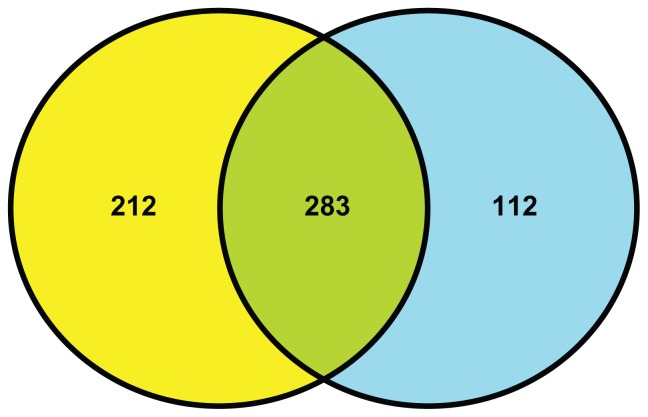
Previously we conducted a disease progression time series study with the same design except that the animals were fed a normal diet containing 10% energy from fat (Harlan Teklad 2016). One objective of the present study is to identify genes that are differentially expressed between GK and WKY on both diets and those which are restricted to either normal or HFDs. The identical data mining approach was applied to the normal diet data set and yielded 395 differentially regulated probe sets. As illustrated by Figure 4, of the 495 probe sets that were different between GK and WKY when animals were fed a HFD, 283 were also different with normal diet. The remaining 212 probe sets were unique to HFD (highlighted in bold font on Supplementary Table 1) while an additional 112 were unique to normal diet-fed animals (Supplementary Table 2).
Figure 4.
Venn diagram showing the numbers of differentially regulated probes sets between strains when animals are fed a high fat diet (yellow) and those regulated between strains when animals are fed a normal diet (blue). Regulations between strains regardless of diet are depicted in green.
Immune/Inflammatory Processes
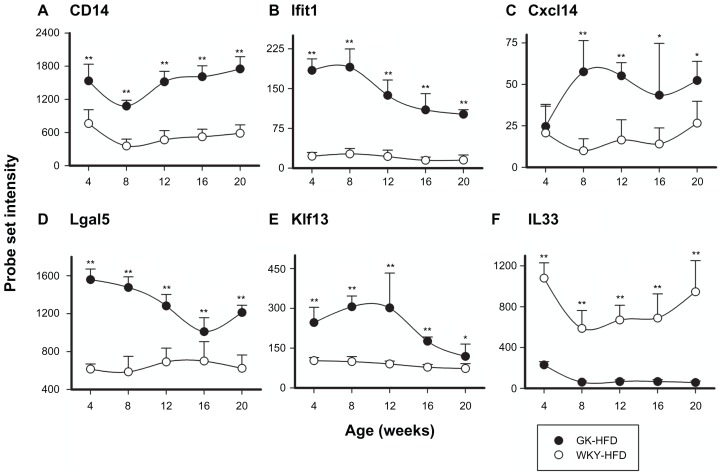
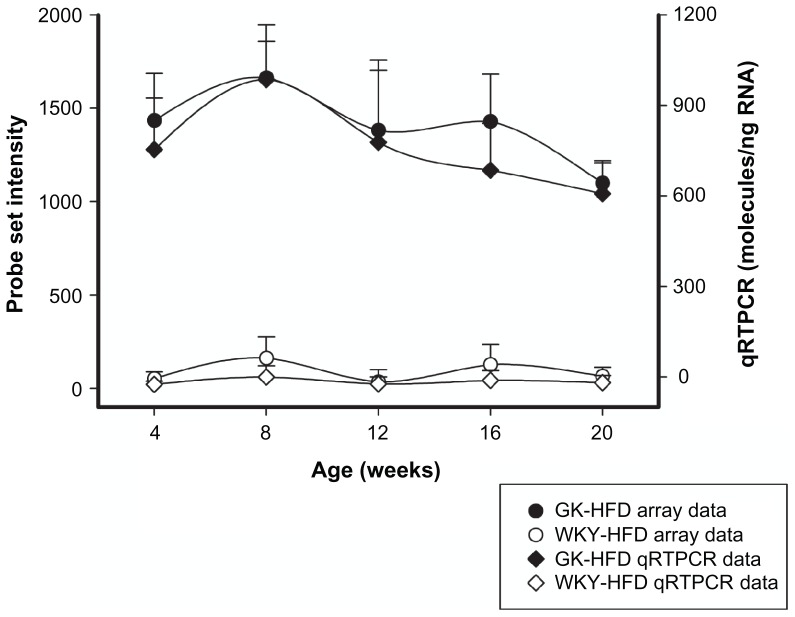
The immune/inflammatory category with 78 probe sets was the most populated group in the comparison of GK to WKY when the animals were fed a HFD (Supplementary Table 1). This category was also most abundant when the animals were fed a normal diet (63 probe sets). Of the 78 probe sets that were different between GK-HFD and WKY-HFD, 55 were also different in these strains when animals were fed a normal diet. The remaining 23 were differentially regulated only when animals were fed a HFD. There were 8 probe sets differentially regulated in animals fed a normal diet but not when fed a HFD (Supplementary Table 2). The initial comparison of GK and WKY from animals fed a normal diet indicated widespread inflammation in the liver of GK animals which is also evident in HFD fed animals. Examples are presented in Figures 5 and 6, with others listed in Supplementary Table 1. CD14 (5A), Ifit1 (5B), Cxcl14 (5C), Plap and Iigp (Fig. 6) were significantly up-regulated in GK liver compared to WKY controls in both ND and HFD fed animals. However, Lgal5 (5D), Klf33 (5E) and IL33 (5F) were all differentially regulated only in the HFD-fed GK compared to the control WKY, not in normal-fed animals. While Lgal5 and Klf33 were up-regulated in GK, IL33 expression was down-regulated. Confirmations of selected probe sets were obtained by comparing real-time qRTPCR data with array data. Figure 6, which presents both microarray data and qRTPCR data for Iigp, illustrates the high degree of similarity in expression patterns with both techniques.
Figure 5.
Representative probe sets related to Immune/Inflammatory Processes which are differentially regulated in GK-HFD animals (closed circles) and WKY-HFD animals (open circles).
Notes: CD14, Ifit1, and Cxcl14 are differentially regulated between strains when animals are fed either ND or HFD, but Lgal5, Klf13, and IL33 are only differentially regulated between strains when animals are fed HFD (*P < 0.05; **P < 0.001)
Figure 6.
Iigp expression in GK-HFD animals (closed symbols) and WKY-HFD animals (open symbols) measured by microarray analysis (circles) and qRTPCR (diamonds).
Transcription/Translation
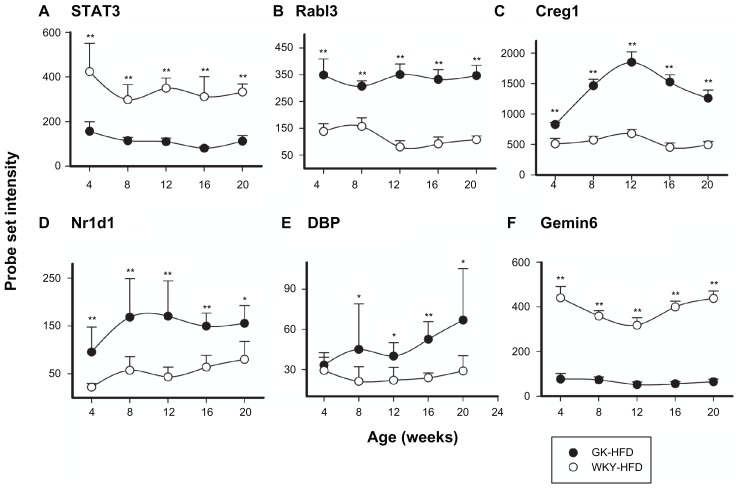
Transcription/Translation was the second most populated functional category with 71 probe sets on HFD and 53 probe sets on ND. Of the 71 probe sets that were differentially regulated between GK and WKY on HFD, 38 were also differentially expressed on ND while 33 were unique to HFD. There were 15 probe sets that were unique to ND. Supplementary Tables 1 and 2 provide lists of the probe sets in this category. Some examples include the expression of Stat3, Rabl3, Creg, and Gemin6 which are differentially regulated in GK compared to WKY on both diets. Stat3 and Gemin6 were down-regulated in GK liver compared to WKY, while expressions of the other two genes were upregulated as shown in Figure 7A–D. Examples of genes that are differentially regulated only in HFD fed animals include Dbp and Nr1d11. Both were up-regulated in GK compared to WKY liver (Fig. 7E and F).
Figure 7.
Representative probe sets related to Transcription/Translation which are differentially regulated in GK-HFD animals (closed circles) and WKY-HFD animals (open circles).
Notes: Stat3, Rabl3, Creg1, and Gemin6 are differentially regulated between strains when animals are fed either ND or HFD, but Nr1d1 and DBP are only differentially regulated between strains when animals are fed HFD (*P < 0.05; **P < 0.001).
Signal transduction
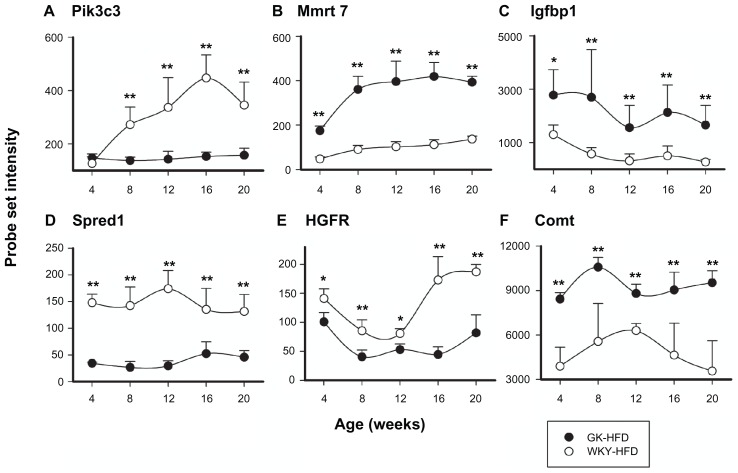
There were 62 probe sets in this group that were differentially expressed between GK and WKY on HFD. Of these probe sets, 32 were also different on normal diet while 30 were unique to HFD. There were 16 probe sets that were only different between the two strains on normal diet. A list of these probe sets can be found in Supplemental Tables 1 and 2. Genes that were differentially expressed from this category in both normal diet and HFD animals include, Pik3c3, Mmrt7, Igfbp1, and Spred1 (Fig. 8A–D). In contrast, Hgfr and Comt were differentially regulated only in HFD fed GK rats compared with WKY animals, but not in ND-fed animals (Fig. 8E and F). Spred1, Hgfr and Pik3c3 were lower in GK liver while Comt, Mmrt7 and Igfbp1 were higher.
Figure 8.
Representative probe sets related to signal transduction which are differentially regulated in GK-HFD animals (closed circles) and WKY-HFD animals (open circles).
Notes: Pik3c3, Mmrt7, Igfbp1, and Spred1 are differentially regulated between strains when animals are fed either diet, but HGFR and Comt are only differentially regulated between strains when animals are fed HFD (*P < 0.05; **P < 0.001).
Lipid metabolism
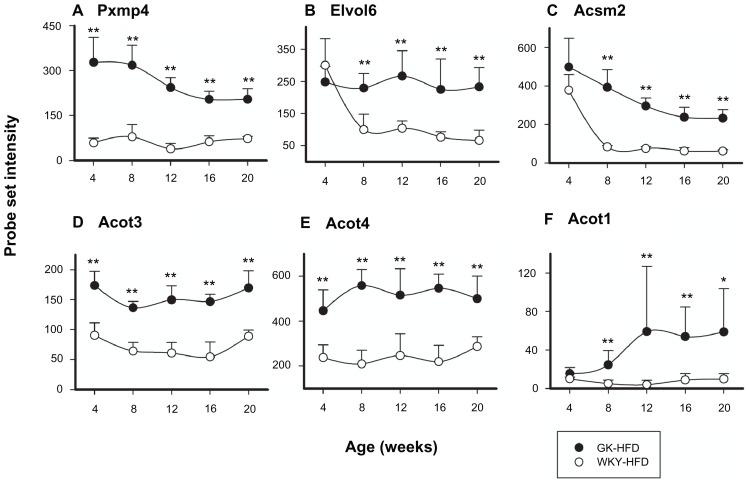
There were 29 probe sets in this group that were different in expression between GK and WKY on HFD (Supplementary Table 1). The vast majority of the probe sets in this category were common to both HFD and normal diet suggesting that the difference in lipid metabolism between the two strains is intrinsic and not diet-driven. For example, genes coding for Pxmp4, Elvol6, Acsm2, Acot3, and Acot4 were all higher in both normal diet and HFD fed GK compared to their respective WKY controls as shown in Figure 9. However, Acot1 was only higher in GK when animals were fed HFD.
Figure 9.
Representative probe sets related to Lipid Metabolism which are differentially regulated in GK-HFD animals (closed circles) and WKY-HFD animals (open circles).
Notes: All probe sets except Acot1 are differentially regulated between strains when animals are fed either diet, while Acot1 is only differentially regulated between strains when animals are fed HFD (*P < 0.05; **P < 0.001).
Response to HFD within a strain
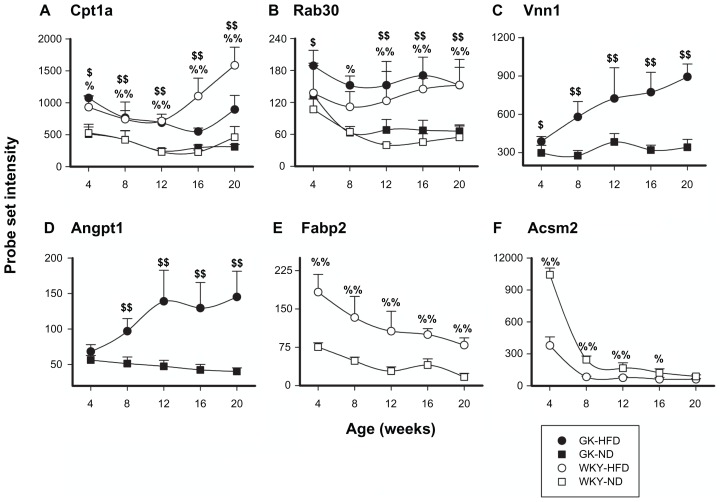
In order to understand the effect of HFD on gene expression in each strain, we compared GK-HFD to GK-normal diet as well as WKY-HFD to WKY-normal diet. These comparisons allowed us to identify genes that changed in both strains on HFD as well as those genes that changed only in one of the strains. Supplementary Table 3 lists 30 probe sets whose expression changed in both strains in response to HFD. Of the 30 genes that changed in both strains on HFD relative to normal diet, only two changed in opposite directions in the two strains. The remaining 28 genes on this list changed in the same way in both strains in response to HFD. For example, Cpt1a and Rab30 increased in both strains in response to HFD (Fig. 10A and B). In contrast to genes whose expression differed on HFD in both strains, an additional 71 genes were only differentially expressed in diabetic animals fed a HFD compared to normal diet, and were not different in control WKY animals fed a HFD (Supplementary Table 4). For example, Vnn1 and Angpt1 were up-regulated only in GK animals fed HFD (Fig. 10C and D). In addition, 99 probe sets were different in the WKY strain fed a HFD, but not in the GK strain (Supplementary Table 5). For example, Fabp2 was up-regulated and Acsm2 was down-regulated only in WKY animals fed HFD (Fig. 10E and F).
Figure 10.
Representative probe sets which are differentially regulated by diet in both GK and WKY animals (Panels A and B), in GK animals only (Panels C and D), or in WKY animals only (Panels E and F). GK-HFD animals (closed circles), WKY-HFD animals (open circles), GK-ND animals (closed squares), WKY-ND animals (open squares).
Notes: Cpt1a and Rab30 are regulated by diet in both GK and WKY animals, while Vnn1 and Angpt1 are only regulated in GK animals and Fabp2 and Acsm2 only in WKY animals; %WKY-HFD vs. WKY-ND, P < 0.05; %%WKY-HFD vs. WKY-ND, P < 0.001; $GK-HFD vs. GK-ND, P < 0.05; $$GK-HFD vs. GK-ND, P < 0.001.
Discussion
The liver plays a central role in both carbohydrate and lipid homeostasis. It is involved in the maintenance of normal glucose concentrations over a wide variety of nutritional conditions, from starvation to nutritional excess. Multiple hormones involved in regulating energy metabolism, including insulin, glucagon, and glucocorticoids, influence gene expression in the liver. In addition to endogenous glucose production, the liver is also involved in the synthesis of cholesterol, free fatty acids, triglycerides and amino acids. Because of the importance of liver in metabolic processes and the pathology of diabetes, we examined the relationships between type 2 diabetes and high fat feeding in this rodent model. Several physiological measurements along with genome-wide mRNA expression analysis across different ages were studied in diabetic GK and control WKY rats fed normal and HFDs.
Not unexpectedly, high fat feeding resulted in increased body weight in both strains (Fig. 1). Despite the fact that GK animals exhibit a lean phenotype, the weight gain was proportional to that in WKY animals. By 20 weeks of age, both strains were 20 percent heavier than comparable animals fed a normal diet. There are many reports in the literature indicating that both high fat feeding and diabetes can cause the buildup of triglycerides in the liver causing steatosis.1,13–15 Although there were no significant differences between the two strains, the liver triglyceride content was higher in animals fed a HFD in both strains at all ages (Fig. 3).
The effects of high fat-feeding on indices of diabetes were minimal (Fig. 2). While GK animals had highly elevated levels of plasma glucose compared to WKY animals at all ages studied, high fat feeding did not increase plasma glucose in either strain. There was a sharp rise in plasma insulin between 4 and 8 weeks in GK animals fed a normal diet, followed by a continuous decline throughout the remainder of the experiment. This suggests a progressive beta cell failure as reported by others.7 On HFD, the pattern was quite similar except that the peak of insulin did not occur until 12 weeks. In WKY animals there was no significant difference in plasma insulin between normal diet and HFD animals for the first 16 weeks of the experiment. However, between 16 and 20 weeks there was a sharp rise in plasma insulin in the HFD WKY animals. This result suggests that the WKYs on HFD may have entered a pre-diabetic state where there is a compensatory increase in insulin secretion from the beta islet cells.
Although there was no significant difference between strains, HFD-feeding caused significant increases in plasma FFAs in both GK and WKY animals (Fig. 3). There is ample evidence in the literature that high plasma FFAs can contribute to insulin resistance.16–20 However, in our study there is no indication that the high plasma FFAs exacerbated diabetes in the GK strain. The only indication of an effect of FFAs on glucose homeostasis in WKY is the significantly elevated insulin observed at 20 weeks. However, HFD resulted in a significant increase in liver triglycerides in both strains.
In order to provide a context for the physiological analysis of the response of both strains to HFD and to understand the underlying gene expression changes, we used Affymetrix 230-2 arrays which contain more than 31,000 probe sets to evaluate gene expression in the liver. We mined these arrays for genes that were at least 2-fold different in GK-HFD vs. WKY-HFD animals. We compared this analysis with a previously conducted identical analysis of the two strains except the animals were fed a normal diet.8 As shown in Figure 4, there were 283 probe sets that were different on both diets. We identified 212 probe sets that were differentially expressed only when the animals were fed a HFD and 112 probe sets that only differentially expressed when animals were fed a ND. Two additional relevant analyses include the comparison of GK on HFD vs. normal diet and WKY on HFD versus normal diet. This allowed us to determine similarities and differences is the responses of the two strains to HFD.
Comparison of GK-HFD versus WKY-HFD indicated that the largest number of probe sets (78) was in the group of genes related to Immune/Inflammatory Processes. The results indicate widespread inflammation in the livers of GK relative to WKY. A large number (55) of these probe sets were also different in GK relative to WKY when fed a normal diet. The fact that genes like CD14 are higher in the liver of GKs on both diets support the conclusion that the inflammation is innate in origin (Figs. 5 and 6). Innate immunity is activated by pathogen structures such as LPS which is a carbohydrate–lipid structure expressed on the outer cell wall of gram-negative bacteria.21 CD14 is a protein expressed on the surface of cells that serves as a co-receptor for LPS.22 Additionally, the liver secretes into circulation a soluble form of CD14 that confers LPS responsiveness to other tissues.23 Another gene that is more highly expressed on both diets in GK liver is Cxcl14, which has been reported to be expressed in CD14-positive cells.24 Similarly, the higher expression in liver on both diets of two interferon induced genes, Ifit1 and Iigp1, is consistent with the conclusion that a major difference between the two strains is chronic inflammation in the GK.8,11,12 IFNs are protein cytokines produced by immune cells in response to a variety of agents such as double stranded RNA. Another gene that is more highly expressed in GK on both diets is Pirin (Pir-Supplemental Table 1) which has been associated with macrophage recruitment and activation.25 It is probable that the GK strain is hyper-responding to foreign stimuli entering the liver through the hepatic portal vein.
However, high fat feeding does seem to increase the inflammatory difference between the two strains. For example, the higher expression of lectin, galactose binding, soluble 5 (Lgals5) in GK liver only on HFD suggests an exacerbation of the difference. Lgals5 is involved in NF-kappaB signaling.26,27 Similarly, Klf13, which is a transcription factor involved in regulation of RANTES (also known as CCL4) is more highly expressed in GK only on HF diet.28 RANTES is a cytokine whose increased expression is associated with many inflammatory conditions including diabetes.29,30
In contrast to GK, the livers of the WKY strain exhibit increased expression of several genes that actually inhibit inflammatory responses. For example, caspase 12 (Casp 12-Supplemental Table 1) which inhibits cytokine signaling is higher in the livers of the WKY strain on both diets. Similarly cytokine inducible SH2-containing protein (Cis) and Suppressor of cytokine signaling 2 (Socs2) are higher in WKY (Supplemental Table 1). Both of these genes inhibit cytokine signaling.31 Another very important gene that is higher in WKY on both diets is STAT3 (Fig. 7A).32,33 In vascular endothelial cells, STAT3 enhances the expression of genes that protect against inflammation induced by LPS. In liver cells, STAT3 is involved in the acute phase response promoting the expression of both pro- and anti- inflammatory proteins. It is also involved in both IL-6 (pro-inflammatory) and IL10 (anti-inflammatory) signaling. Another rather interesting gene that is more highly expressed in WKY liver on both diets is Gemin6 (Fig. 7D). Gemin6 is one of the proteins involved in spliceosome function.34 Decreased spliceosomal function is associated with a variety of degenerative disease processes.35,36
The comparison of HFD to normal diet within each strain also provided insight into inflammatory status. These analyses indicated that HFD feeding did not exacerbate the gene expression changes associated with heightened inflammation in GK animals, but did result in changes indicative of increased inflammation in the WKY strain. For example, with respect to genes functionally classified as Immune/ Inflammatory, there were no differences in the GK strain when comparing HFD to normal diet. In sharp contrast, in the WKY strain there were 13 probe sets differentially expressed between diets in this category. Among the probe sets that are up-regulated in WKY on HFD are three probe sets for Iigp1. Although the expression of this gene is still higher in GK than WKY on both diets, the increase on HFD in WKY suggests elevated inflammation in WKYs with HFD feeding. Consistent with this conclusion is the increased expression of Monocyte to macrophage differentiation-associated 2 (Mmd2), Proviral integration site 1 (Pim1), Vanin 1 (Vnn1) and Tumor necrosis factor receptor superfamily, member 9 (Tnfrsf9, CD137) with HFD (Supplemental Table 3 and Fig. 10C). Mmd2 facilitates the conversion of monocytes to tissue macrophages.37 Pim1 is a kinase that protects the main subunit of NF-kappa B from degradation.38 Vnn1 promotes an innate immune response39 and Tnfrsf9 is expressed on endothelial cells activated by pro-inflammatory stimuli and facilitates the recruitment of monocytes into areas of inflammation.40 The only change that is not consistent with increased inflammation in the liver of WKY on HFD is the increased expression of suppressor of cytokine signaling 2 (Socs2) which would be anti-inflammatory. It is notable that Socs2 was also higher in WKY compared to GK on both diets. Given the result that the WKY strain is resistant to HFD induced diabetes, it is quite relevant that interleukin 33 (IL-33) is more highly expressed in WKY livers. Recently, Miller et al provided data suggesting that IL-33 can play a protective role in glucose homoeostasis and metabolic-induced tissue damage when animals are fed a HFD.41 They attribute this to the down regulation of resistin, a mediator that is responsible for development of insulin-resistance and type 2 diabetes.
Several genes that are common to both diets help explain the diabetic phenotype of the GK strain. For example, Pik3c3, which is involved in insulin signaling,42 is more highly expressed on both diets in WKY (Fig. 7A). Similarly both Igfbp1 and Mtmr7 are also more highly expressed in GK on both diets (Fig. 7B and C). Igfbp1 is a liver derived secreted protein that binds and sequesters IGF1. IGF1 is structurally and functionally similar to insulin and contributes to glucose disposal. Elevating circulating Igfbp1 has been shown to increase plasma glucose.43 Mtmr7 is a lipid phosphatase that removes phosphate from the phosphorylated inositol head group and is counter- regulatory to Pik3c3.44
In contrast, there are genes that are differentially expressed between GK and WKY only when animals are fed HFD. For example, the expression of transforming growth factor, beta receptor II (Tgfbr2) is more highly expressed in WKY only on HFD (Supplemental Table 1). The enhanced expression of this gene has been shown to be involved in the development of obesity and related pathologies.45,46 In contrast, the higher expression of Hgfr in WKY may be ameliorating as HGF has been shown to be protective against the development of steatosis when mice are fed a HFD47 (Fig. 7E). Another important gene whose expression is different between the two strains only on HFD is Comt (Fig. 7F). Comt in liver, which is higher in GK, is the major systemic pathway for the inactivation of catecholamines including epinephrine and norepinephrine. The higher Comt in GK liver should reduce the systemic influence of the autonomic nervous system, reducing lipolysis in adipose tissue, glycogen breakdown in the liver, and fatty acid uptake by the musculature. The higher expression of Spred1 in WKY may also help explain why this strain is resistant to development of diabetes (Fig. 7D). Spred1 is a negative regulator of the Ras/ERK signaling pathway involved in some cytokine signaling.31
Several genes differentially regulated between strains were related to lipid metabolism. Genes whose expression is higher in GK on both diets include ELOVL family member 6 (Elovl6) which is involved in the biosynthesis of unsaturated fatty acid48 (Fig. 9A). Additional genes that are higher in GK on both diets are three peroxisomal genes, peroxisomal membrane protein 4 (Pxmp4), peroxisomal acyl-CoA thioesterase 3 (Acot3), and peroxisomal long chain acyl-CoA thioesterase Ia (Acot4) (Fig. 9B, D and E).49–51 It is rather surprising that so few genes in this category are unique to HFD. Among these is cytosolic acyl-CoA thioesterase 1 (Acot1) (Fig. 9F). The fact that two peroxisomal and one cytosolic Acots are higher in GK is rather interesting. ACOTs are important to the cellular balance between free fatty acids and acyl-CoAs. This balance is critical to many cellular processes. These processes include oxidation of fatty acids and biosynthesis of lipids. The balance between free fatty acids and acyl-CoAs is also involved in the allosteric regulation of several enzymes such as the inhibition of the activation of AMP-activated protein kinase by palmitoyl-coenzyme A and activation of the peroxisome proliferator-activated receptors (PPARs) by free fatty acids.18 The activity of Acots which can hydrolyze acyl-CoAs to the corresponding free fatty acid and CoASH is important to regulating the balance. In this regard it is also relevant that mitochondrial acyl-CoA thioesterase 2 (Acot2) is also higher in GK on normal diet but not HFD. A group of enzymes participating in the other side of the balance are acyl-CoA synthetases.52 In this regard, it is relevant that acyl-CoA synthetase medium-chain family member 2 (Acsm2) is higher on both diets in GK (Fig. 9C) while acyl-CoA synthetase medium-chain family member 3 (Acsm3) and acyl-CoA synthetase medium-chain family member 5 (Acsm5) are higher on both diets in WKY (Supplemental Table 1). All three of these Acsms are mitochondrial.
A variety of other genes were found to differ in expression when the two different diets were compared within each strain. Only one gene was different in the signaling group when both strains on normal diet were compared to the same strain on HFD. Rab30, a member RAS oncogene family, was elevated by HFD in both strains (Fig. 10B). Although only limited data on this gene is available, increased expression of Rab30 is elevated in regenerating liver53 possibly indicating that HFD causes liver damage.
High fat feeding caused a differential expression of 15 probe sets in the Signaling category in GK animals, but not in WKY animals. Regulator of G-protein signaling 5 (Rgs5) is more highly expressed in liver of GK on HFD as compare to the GK on normal diet (Supplemental Table 4). Increased expression of Rgs5 is associated with vascular remodeling.54 Consistent with the possibility that HFD is causing vascular remodeling in the liver of the GK strain is the increased expression of Angpt1 (Fig. 10D). Increased expression of Angpt1 is associated with both inflammation and vascular remodeling.55 Interestingly, Mtmr7, which is counter regulatory to insulin signaling and higher in GK on both diets, is further increased in GK on HFD when compared to GK on normal diet. Consistent with the chronic hyperglycemia of the GK rats is the further down regulation of caveolin 1 (Cav1) on HFD relative to GKs on normal diet (Supplemental Table 4). Hyperglycemia has been shown to reduce the expression of Cav1.56
The intra-strain diet comparison in WKY provides results that may explain why these animals were resistant to developing diabetes on HFD (Supplemental Table 5). For example, in WKY on HFD there is a reduced expression of phospholipase A2, group IB (Pla2g1b). Pla2g1b stimulates the production by neutrophils of pro-inflammatory leukotriene B4.57 Another very important observation concerning the resistance of WKY to the development of HFD induced diabetes is the increased expression of stanniocalcin 1 (Stc1) in the livers of WKY on HFD. There is significant evidence that Stc1 stimulates mitochondrial electron transport and uncouples oxidative phosphorylation.58 In addition, studies using transgenic mice over expressing Stc1 show that one consequence of this effect on mitochondria is an increase in glucose disposal in a glucose tolerance test.59 Similarly, the increased expression of fibroblast growth factor receptor 2 (Fgfr2) appears to be a protective adaptation to HFD in the WKY strain. For example, mice with defective signaling through Fgfr2 develop hepatic steatosis with age.60 Another interesting observation involves differential regulation between strains of 3 genes involved in regulation of circadian rhythms. Both Nuclear receptor subfamily 1, group D, member 1 (Nr1d1) also known as RevErbA, and D site of albumin promoter- binding protein (Dbp) showed higher expression in the liver GK compared to WKY animals when fed HFD (Fig. 7E and F). The third gene is carbon catabolite repression 4-like B (CCR4—also known as nocturnin) which showed higher expression in GK animals fed a normal diet compared to WKY animals fed that diet (Supplemental Table 2). At the time these animals were sacrificed, these genes should be at the nadir of their circadian expression pattern. The fact that these genes are differentially expressed between GK and WKY suggests the possibility of circadian disruption in the GK strain. Disruption of circadian rhythms can be both a cause and a result of diabetes. Because nocturnin is more highly expressed in GK relative to WKY on normal diet the down regulation in both strains on HFD is quite interesting. Nocturnin is a circadian deadenylase that is important to the regulation of genes necessary for nutrient uptake, metabolism, and storage.61–63 These results expand and elaborate on the recent work of Kohsaka et al noting the effects of HFD on circadian rhythms.64
The results of this study illustrate the complexity of diabetes as a disease process. Increased dietary fat intake and obesity are important etiological factors in the development of type 2 diabetes, especially in Western societies. However, the gene expression results observed with WKY demonstrate factors that can make an animal resistant to diet-induced type 2 diabetes. These factors are primarily associated with anti-inflammatory genes. In contrast to WKY, the leaner GK strain express genes associated with heightened innate immunity driven inflammation regardless of diet. This connection of inflammation to the development of type 2 diabetes is further supported by our recently published observation that salsalate, a specific inhibitor of NF kappa B, can ameliorate hyperglycemia in the GK strain.65
Supplementary Tables
Table S1. Differentially expressed genes in GK versus WKY animals fed HFD.
Table S2. Differentially expressed genes in GK versus WKY animals fed ND.
Table S3. Differentially regulated by diet in both strains.
Table S4. Differentially regulated by diet in only in GK animals.
Table S5. Differentially regulated by diet in only in WKY animals.
Footnotes
Author Contributions
Conceived and designed the experiments: RRA, WJJ, DCD. Analysed the data: All authors. Wrote the first draft of the manuscript: RRA. Contributed to the writing of the manuscript: RRA, SS, DCD, WJJ. Agree with manuscript results and conclusions: All authors. Jointly developed the structure and arguments for the paper: All authors. Made critical revisions and approved final version: RRA, DCD, SS, WJJ. All authors reviewed and approved of the final manuscript.
Competing Interests
Author(s) disclose no potential conflicts of interest.
Disclosures and Ethics
As a requirement of publication author(s) have provided to the publisher signed confirmation of compliance with legal and ethical obligations including but not limited to the following: authorship and contributorship, conflicts of interest, privacy and confidentiality and (where applicable) protection of human and animal research subjects. The authors have read and confirmed their agreement with the ICMJE authorship and conflict of interest criteria. The authors have also confirmed that this article is unique and not under consideration or published in any other publication, and that they have permission from rights holders to reproduce any copyrighted material. Any disclosures are made in this section. The external blind peer reviewers report no conflicts of interest.
Funding
This work was partly supported by grant GM 24211 from the National Institute of General Medical Sciences, NIH, Bethesda, MD, and by funds from the UB-Pfizer Strategic Alliance.
References
- 1.Agellon LB, Drozdowski L, Li L, et al. Loss of intestinal fatty acid binding protein increases the susceptibility of male mice to high fat diet-induced fatty liver. Biochim Biophys Acta. 2007;1771(10):1283–8. doi: 10.1016/j.bbalip.2007.08.004. [DOI] [PubMed] [Google Scholar]
- 2.Panchal SK, Brown L. Rodent models for metabolic syndrome research. J Biomed Biotechnol. 2011;2011:351982. doi: 10.1155/2011/351982. [DOI] [PMC free article] [PubMed] [Google Scholar]
- 3.Vial G, Dubouchaud H, Couturier K, et al. Effects of a high-fat diet on energy metabolism and ROS production in rat liver. J Hepatol. 2011;54(2):348–56. doi: 10.1016/j.jhep.2010.06.044. [DOI] [PubMed] [Google Scholar]
- 4.Zong H, Armoni M, Harel C, Karnieli E, Pessin JE. Cytochrome P-450 CYP2E1 knockout mice are protected against high-fat diet-induced obesity and insulin resistance. Am J Physiol Endocrinol Metab. 2012;302(5):E532–9. doi: 10.1152/ajpendo.00258.2011. [DOI] [PMC free article] [PubMed] [Google Scholar]
- 5.Brunetti P. The lean patient with type 2 diabetes: characteristics and therapy challenge. Int J Clin Pract Suppl. 2007;153:3–9. doi: 10.1111/j.1742-1241.2007.01359.x. [DOI] [PubMed] [Google Scholar]
- 6.Goto Y, Suzuki K, Ono T, Sasaki M, Toyota T. Development of diabetes in the non-obese NIDDM rat (GK rat) Adv Exptl Med Biol. 1988;246:29–31. doi: 10.1007/978-1-4684-5616-5_4. [DOI] [PubMed] [Google Scholar]
- 7.Portha B. Programmed disorders of B-cell development and function as one cause for type 2 diabetes? The GK rat paradigm. Diabet Metabol Res Rev. 2005;21(6):495–504. doi: 10.1002/dmrr.566. [DOI] [PubMed] [Google Scholar]
- 8.Almon RR, DuBois DC, Lai W, Xue B, Nie J, Jusko WJ. Gene expression analysis of hepatic roles in cause and development of diabetes in Goto- Kakizaki rats. J Endocrinol. 2009;200(3):331–46. doi: 10.1677/JOE-08-0404. [DOI] [PubMed] [Google Scholar]
- 9.Hazra A, Pyszczynski NA, DuBois DC, Almon RR, Jusko WJ. Modeling of corticosteroid effects on hepatic low-density lipoprotein receptors and plasma lipid dynamics in rats. Pharm Res. 2007;25:769–80. doi: 10.1007/s11095-007-9371-8. [DOI] [PMC free article] [PubMed] [Google Scholar]
- 10.Hundal RS, Krssak M, Dufour S, et al. Mechanism by which metformin reduces glucose production in type 2 diabetes. Diabetes. 2000;49(12):2063–9. doi: 10.2337/diabetes.49.12.2063. [DOI] [PMC free article] [PubMed] [Google Scholar]
- 11.Nie J, Xue B, Sukumaran S, Jusko WJ, Dubois DC, Almon RR. Differential muscle gene expression as a function of disease progression in Goto- Kakizaki diabetic rats. Mol Cell Endocrinol. 2010;338(1–2):10–17. doi: 10.1016/j.mce.2011.02.016. [DOI] [PMC free article] [PubMed] [Google Scholar]
- 12.Xue B, Sukumaran S, Nie J, Jusko WJ, Dubois DC, Almon RR. Adipose tissue deficiency and chronic inflammation in diabetic Goto-Kakizaki rats. PLoS One. 2011;6(2):e17386. doi: 10.1371/journal.pone.0017386. [DOI] [PMC free article] [PubMed] [Google Scholar]
- 13.Chen Z, Newberry EP, Norris JY, et al. ApoB100 is required for increased VLDL-triglyceride secretion by microsomal triglyceride transfer protein in ob/ob mice. J Lipid Res. 2008;49(9):2013–22. doi: 10.1194/jlr.M800240-JLR200. [DOI] [PMC free article] [PubMed] [Google Scholar]
- 14.Do GM, Oh HY, Kwon EY, et al. Long-term adaptation of global transcription and metabolism in the liver of high-fat diet-fed C57BL/6J mice. Mol Nutr Food Res. 2011;55(Suppl 2):S173–85. doi: 10.1002/mnfr.201100064. [DOI] [PubMed] [Google Scholar]
- 15.Hageman RS, Wagener A, Hantschel C, Svenson KL, Churchill GA, Brockmann GA. High-fat diet leads to tissue-specific changes reflecting risk factors for diseases in DBA/2J mice. Physiol Genomics. 2010;42(1):55–66. doi: 10.1152/physiolgenomics.00072.2009. [DOI] [PMC free article] [PubMed] [Google Scholar]
- 16.Chang BH, Chan L. Regulation of Triglyceride Metabolism. III. Emerging role of lipid droplet protein ADFP in health and disease. Am J Physiol Gastrointest Liver Physiol. 2007;292(6):G1465–8. doi: 10.1152/ajpgi.00566.2006. [DOI] [PubMed] [Google Scholar]
- 17.Man TY, Michailidou Z, Gokcel A, et al. Dietary manipulation reveals an unexpected inverse relationship between fat mass and adipose 11beta-hydroxysteroid dehydrogenase type 1. Am J Physiol Endocrinol Metab. 2011;300(6):E1076–84. doi: 10.1152/ajpendo.00531.2010. [DOI] [PMC free article] [PubMed] [Google Scholar]
- 18.Muurling M, van den Hoek AM, Mensink RP, et al. Overexpression of APOC1 in obob mice leads to hepatic steatosis and severe hepatic insulin resistance. J Lipid Res. 2004;45(1):9–16. doi: 10.1194/jlr.M300240-JLR200. [DOI] [PubMed] [Google Scholar]
- 19.Postic C, Dentin R, Girard J. Role of the liver in the control of carbohydrate and lipid homeostasis. Diabetes Metab. 2004;30(5):398–408. doi: 10.1016/s1262-3636(07)70133-7. [DOI] [PubMed] [Google Scholar]
- 20.Wang S, Kamat A, Pergola P, Swamy A, Tio F, Cusi K. Metabolic factors in the development of hepatic steatosis and altered mitochondrial gene expression in vivo. Metabolism. 2010;60(8):1090–9. doi: 10.1016/j.metabol.2010.12.001. [DOI] [PubMed] [Google Scholar]
- 21.Hajishengallis G, Martin M, Sojar HT, et al. Dependence of bacterial protein adhesins on toll-like receptors for proinflammatory cytokine induction. Clin Diagn Lab Immunol. 2002;9(2):403–11. doi: 10.1128/CDLI.9.2.403-411.2002. [DOI] [PMC free article] [PubMed] [Google Scholar]
- 22.Kubota K, Kim JY, Sawada A, et al. LRRC8 involved in B cell development belongs to a novel family of leucine-rich repeat proteins. FEBS Lett. 2004;564(1–2):147–52. doi: 10.1016/S0014-5793(04)00332-1. [DOI] [PubMed] [Google Scholar]
- 23.Fernandez-Real JM, Broch M, Richart C, Vendrell J, López-Bermejo A, Ricart W. CD14 monocyte receptor, involved in the inflammatory cascade, and insulin sensitivity. J Clin Endocrinol Metab. 2003;88(4):1780–4. doi: 10.1210/jc.2002-020173. [DOI] [PubMed] [Google Scholar]
- 24.Meuter S, Schaerli P, Roos RS, et al. Murine CXCL14 is dispensable for dendritic cell function and localization within peripheral tissues. Mol Cell Biol. 2007;27(3):983–92. doi: 10.1128/MCB.01648-06. [DOI] [PMC free article] [PubMed] [Google Scholar]
- 25.Woodruff PG, Ellwanger A, Solon M, Cambier CJ, Pinkerton KE, Koth LL. Alveolar macrophage recruitment and activation by chronic second hand smoke exposure in mice. Copd. 2009;6(2):86–94. doi: 10.1080/15412550902751738. [DOI] [PMC free article] [PubMed] [Google Scholar]
- 26.Anand PK. Exosomal membrane molecules are potent immune response modulators. Commun Integr Biol. 2010;3(5):405–8. doi: 10.4161/cib.3.5.12474. [DOI] [PMC free article] [PubMed] [Google Scholar]
- 27.Barres C, Blanc L, Bette-Bobillo P, et al. Galectin-5 is bound onto the surface of rat reticulocyte exosomes and modulates vesicle uptake by macrophages. Blood. 2010;115(3):696–705. doi: 10.1182/blood-2009-07-231449. [DOI] [PubMed] [Google Scholar]
- 28.Huang B, Ahn YT, McPherson L, Clayberger C, Krensky AM. Interaction of PRP4 with Kruppel-like factor 13 regulates CCL5 transcription. J Immunol. 2007;178(11):7081–7. doi: 10.4049/jimmunol.178.11.7081. [DOI] [PMC free article] [PubMed] [Google Scholar]
- 29.Lu M, Patsouris D, Li P, et al. A new antidiabetic compound attenuates inflammation and insulin resistance in Zucker diabetic fatty rats. Am J Physiol Endocrinol Metab. 2010;298(5):E1036–48. doi: 10.1152/ajpendo.00668.2009. [DOI] [PMC free article] [PubMed] [Google Scholar]
- 30.Nakagome K, Nagata M. Pathogenesis of airway inflammation in bronchial asthma. Auris Nasus Larynx. 2011;38(5):555–63. doi: 10.1016/j.anl.2011.01.011. [DOI] [PubMed] [Google Scholar]
- 31.Yoshimura A. Regulation of cytokine signaling by the SOCS and Spred family proteins. Keio J Med. 2009;58(2):73–83. doi: 10.2302/kjm.58.73. [DOI] [PubMed] [Google Scholar]
- 32.Clementi AH, Gaudy AM, van Rooijen N, Pierce RH, Mooney RA. Loss of Kupffer cells in diet-induced obesity is associated with increased hepatic steatosis, STAT3 signaling, and further decreases in insulin signaling. Biochim Biophys Acta. 2009;1792(11):1062–72. doi: 10.1016/j.bbadis.2009.08.007. [DOI] [PMC free article] [PubMed] [Google Scholar]
- 33.Osborn O, Olefsky JM. The cellular and signaling networks linking the immune system and metabolism in disease. Nat Med. 2012;18(3):363–74. doi: 10.1038/nm.2627. [DOI] [PubMed] [Google Scholar]
- 34.Kolb SJ, Battle DJ, Dreyfuss G. Molecular functions of the SMN complex. J Child Neurol. 2007;22(8):990–4. doi: 10.1177/0883073807305666. [DOI] [PubMed] [Google Scholar]
- 35.Cooper TA, Wan L, Dreyfuss G. RNA and disease. Cell. 2009;136(4):777–93. doi: 10.1016/j.cell.2009.02.011. [DOI] [PMC free article] [PubMed] [Google Scholar]
- 36.Wan L, Ottinger E, Cho S, Dreyfuss G. Inactivation of the SMN complex by oxidative stress. Mol Cell. 2008;31(2):244–54. doi: 10.1016/j.molcel.2008.06.004. [DOI] [PMC free article] [PubMed] [Google Scholar]
- 37.Gonez LJ, Naselli G, Banakh I, Niwa H, Harrison LC. Pancreatic expression and mitochondrial localization of the progestin-adipoQ receptor PAQR10. Mol Med. 2008;14(11–12):697–704. doi: 10.2119/2008-00072.Gonez. [DOI] [PMC free article] [PubMed] [Google Scholar]
- 38.Nihira K, Ando Y, Yamaguchi T, Kagami Y, Miki Y, Yoshida K. Pim-1 controls NF-kappaB signalling by stabilizing RelA/p65. Cell Death Differ. 2010;17(4):689–98. doi: 10.1038/cdd.2009.174. [DOI] [PubMed] [Google Scholar]
- 39.Berruyer C, Pouyet L, Millet V, et al. Vanin-1 licenses inflammatory mediator production by gut epithelial cells and controls colitis by antagonizing peroxisome proliferator-activated receptor gamma activity. J Exp Med. 2006;203(13):2817–27. doi: 10.1084/jem.20061640. [DOI] [PMC free article] [PubMed] [Google Scholar]
- 40.Schwarz H. Biological activities of reverse signal transduction through CD137 ligand. J Leukoc Biol. 2005;77(3):281–6. doi: 10.1189/jlb.0904558. [DOI] [PubMed] [Google Scholar]
- 41.Miller AM, Asquith DL, Hueber AJ, et al. Interleukin-33 induces protective effects in adipose tissue inflammation during obesity in mice. Circ Res. 2012;107(5):650–8. doi: 10.1161/CIRCRESAHA.110.218867. [DOI] [PMC free article] [PubMed] [Google Scholar]
- 42.Marone R, Cmiljanovic V, Giese B, Wymann MP. Targeting phosphoinositide 3-kinase: moving towards therapy. Biochim Biophys Acta. 2008;1784(1):159–85. doi: 10.1016/j.bbapap.2007.10.003. [DOI] [PubMed] [Google Scholar]
- 43.Bauer M, Hamm AC, Bonaus M, et al. Starvation response in mouse liver shows strong correlation with life-span-prolonging processes. Physiol Genomics. 2004;17(2):230–44. doi: 10.1152/physiolgenomics.00203.2003. [DOI] [PubMed] [Google Scholar]
- 44.Mochizuki Y, Majerus PW. Characterization of myotubularin-related protein 7 and its binding partner, myotubularin-related protein 9. Proc Natl Acad Sci U S A. 2003;100(17):9768–73. doi: 10.1073/pnas.1333958100. [DOI] [PMC free article] [PubMed] [Google Scholar]
- 45.Panagiotou G, Nielsen J. Nutritional systems biology: definitions and approaches. Annu Rev Nutr. 2009;29:329–39. doi: 10.1146/annurev-nutr-080508-141138. [DOI] [PubMed] [Google Scholar]
- 46.Yang X, Deignan JL, Qi H, et al. Validation of candidate causal genes for obesity that affect shared metabolic pathways and networks. Nat Genet. 2009;41(4):415–23. doi: 10.1038/ng.325. [DOI] [PMC free article] [PubMed] [Google Scholar]
- 47.Kosone T, Takagi H, Horiguchi N, et al. HGF ameliorates a high-fat diet-induced fatty liver. Am J Physiol Gastrointest Liver Physiol. 2007;293(1):G204–10. doi: 10.1152/ajpgi.00021.2007. [DOI] [PubMed] [Google Scholar]
- 48.Shimamura K, Nagumo A, Miyamoto Y, et al. Discovery and characterization of a novel potent, selective and orally active inhibitor for mammalian ELOVL6. Eur J Pharmacol. 2010;630(1–3):34–41. doi: 10.1016/j.ejphar.2009.12.033. [DOI] [PubMed] [Google Scholar]
- 49.Hunt MC, Rautanen A, Westin MA, Svensson LT, Alexson SE. Analysis of the mouse and human acyl-CoA thioesterase (ACOT) gene clusters shows that convergent, functional evolution results in a reduced number of human peroxisomal ACOTs. Faseb J. 2006;20(11):1855–64. doi: 10.1096/fj.06-6042com. [DOI] [PubMed] [Google Scholar]
- 50.Visser WF, van Roermund CW, Ijlst L, Waterham HR, Wanders RJ. Metabolite transport across the peroxisomal membrane. Biochem J. 2007;401(2):365–75. doi: 10.1042/BJ20061352. [DOI] [PMC free article] [PubMed] [Google Scholar]
- 51.Westin MA, Hunt MC, Alexson SE. The identification of a succinyl-CoA thioesterase suggests a novel pathway for succinate production in peroxisomes. J Biol Chem. 2005;280(46):38125–32. doi: 10.1074/jbc.M508479200. [DOI] [PubMed] [Google Scholar]
- 52.Watkins PA, Maiguel D, Jia Z, Pevsner J. Evidence for 26 distinct acylcoenzyme A synthetase genes in the human genome. J Lipid Res. 2007;48(12):2736–50. doi: 10.1194/jlr.M700378-JLR200. [DOI] [PubMed] [Google Scholar]
- 53.Chiba M, Murata S, Myronovych A, et al. Elevation and characteristics of Rab30 and S100a8/S100a9 expression in an early phase of liver regeneration in the mouse. Int J Mol Med. 2011;27(4):567–74. doi: 10.3892/ijmm.2011.614. [DOI] [PubMed] [Google Scholar]
- 54.Berger M, Bergers G, Arnold B, Hämmerling GJ, Ganss R. Regulator of G-protein signaling-5 induction in pericytes coincides with active vessel remodeling during neovascularization. Blood. 2005;105(3):1094–101. doi: 10.1182/blood-2004-06-2315. [DOI] [PubMed] [Google Scholar]
- 55.Kajiya K, Kidoya H, Sawane M, et al. Promotion of lymphatic integrity by angiopoietin-1/Tie2 signaling during inflammation. Am J Pathol. 2012;180(3):1273–82. doi: 10.1016/j.ajpath.2011.11.008. [DOI] [PubMed] [Google Scholar]
- 56.McGuire JF, Rouen S, Siegfreid E, Wright DE, Dobrowsky RT. Caveolin-1 and altered neuregulin signaling contribute to the pathophysiological progression of diabetic peripheral neuropathy. Diabetes. 2009;58(11):2677–86. doi: 10.2337/db09-0594. [DOI] [PMC free article] [PubMed] [Google Scholar]
- 57.Lee HY, Kim MK, Park KS, Shin EH, Bae YS. Group IB secretory phospholipase A2 stimulates leukotriene B4 production by a unique mechanism in human neutrophils. Biochem Biophys Res Commun. 2005;1334(2):500–8. doi: 10.1016/j.bbrc.2005.06.115. [DOI] [PubMed] [Google Scholar]
- 58.Ellard JP, McCudden CR, Tanega C, et al. The respiratory effects of stanniocalcin- 1 (STC-1) on intact mitochondria and cells: STC-1 uncouples oxidative phosphorylation and its actions are modulated by nucleotide triphosphates. Mol Cell Endocrinol. 2007;264(1–2):90–101. doi: 10.1016/j.mce.2006.10.008. [DOI] [PubMed] [Google Scholar]
- 59.Yoshiko Y, Aubin JE. Stanniocalcin 1 as a pleiotropic factor in mammals. Peptides. 2004;25(10):1663–9. doi: 10.1016/j.peptides.2004.04.015. [DOI] [PubMed] [Google Scholar]
- 60.Hale C, Chen MM, Stanislaus S, et al. Lack of overt FGF21 resistance in two mouse models of obesity and insulin resistance. Endocrinology. 2012;153(1):69–80. doi: 10.1210/en.2010-1262. [DOI] [PubMed] [Google Scholar]
- 61.Green CB, Douris N, Kojima S, et al. Loss of Nocturnin, a circadian deadenylase, confers resistance to hepatic steatosis and diet-induced obesity. Proc Natl Acad Sci U S A. 2007;104(23):9888–93. doi: 10.1073/pnas.0702448104. [DOI] [PMC free article] [PubMed] [Google Scholar]
- 62.Ramsey KM, Bass J. Lean gene and the clock machine. Proc Natl Acad Sci U S A. 2007;104(23):9553–4. doi: 10.1073/pnas.0703516104. [DOI] [PMC free article] [PubMed] [Google Scholar]
- 63.Wang Y, Osterbur DL, Megaw PL, et al. Rhythmic expression of Nocturnin mRNA in multiple tissues of the mouse. BMC Dev Biol. 2001;1:9. doi: 10.1186/1471-213X-1-9. [DOI] [PMC free article] [PubMed] [Google Scholar]
- 64.Kohsaka A, Laposky AD, Ramsey KM, et al. High-fat diet disrupts behavioral and molecular circadian rhythms in mice. Cell Metab. 2007;6(5):414–21. doi: 10.1016/j.cmet.2007.09.006. [DOI] [PubMed] [Google Scholar]
- 65.Cao Y, Dubois DC, Sun H, Almon RR, Jusko WJ. Modeling diabetes disease progression and salsalate intervention in Goto-Kakizaki rats. J Pharmacol Exp Ther. 2011;339(3):896–904. doi: 10.1124/jpet.111.185686. [DOI] [PMC free article] [PubMed] [Google Scholar]
Associated Data
This section collects any data citations, data availability statements, or supplementary materials included in this article.
Supplementary Materials
Table S1. Differentially expressed genes in GK versus WKY animals fed HFD.
Table S2. Differentially expressed genes in GK versus WKY animals fed ND.
Table S3. Differentially regulated by diet in both strains.
Table S4. Differentially regulated by diet in only in GK animals.
Table S5. Differentially regulated by diet in only in WKY animals.


