Abstract
Porous silicon (pSi) is emerging as a promising material in the development of nanovectors for the systemic delivery of therapeutic and imaging agents. The integration of photolithographic patterning, typical of the semiconductor industry, with electrochemical silicon etching provides a highly flexible strategy to fabricate monodisperse and precisely tailored nanovectors. Here, a microfabrication strategy for direct lithographic patterning of discoidal pSi particles is presented that enables precise and independent control over particle size, shape, and porous structure. Discoidal pSi nanovectors with diameters ranging from 500 to 2600 nm, heights from 200 to 700 nm, pore sizes from 5 to 150 nm, and porosities from 40 to 90% are demonstrated. The degradation in serum, interaction with immune and endothelial cells in vitro, and biodistribution in mice bearing breast tumors are assessed for two discoidal nanovectors with sizes of 600 nm × 400 nm and 1000 nm × 400 nm. It is shown that both particle types are degraded after 24 h of continuous gentle agitation in serum, do not stimulate cytokine release from macrophages or affect endothelial cell viability, and accumulate up to about 10% of the injected dose per gram tissue in orthotopic murine models of breast cancer. The accumulation of the discoidal pSi nanovectors into the breast tumor mass is found to be up to five times higher than for spherical silica beads with similar diameters.
1. Introduction
Despite the constant progress in the identification and in vitro validation of new pharmacological agents, the realization of their full potential in vivo can only be accomplished through a significant improvement in their accumulation at the biological target (tumor tissue). The reality of drug discovery encounters multiple obstacles which prevent candidates with relevant pharmacological activities in vitro from efficient clinical translation. These include insufficient drug solubility in a physiological environment and the multiple biophysical barriers disseminated along the journey of systemically administered agents.[1–4]
The use of injectable nanovectors has been proposed as a strategy to enhance the preferential accumulation of active agents at the biological target, reduce adverse effects and protect sensitive active molecules, such as siRNA, from rapid in vivo degradation.[5,6] In the last two decades, multiple different classes of nanovectors have been developed, including liposomes, polymer-drug conjugates, polymeric particles and micelles.[7] However, just a handfull of nanobased drug formulations have reached the clinic.[8] In the development of new injectable nanovectors, it is imperative to employ i) biocompatible and biodegradable materials; and ii) fabrication strategies that offer a precise control on particle size, shape and surface properties, design parameters that have been shown to dramatically affect the behavior of systemically administered particles.[9,10] Careful tuning of the size and surface properties was already recognized as a crucial step in particle fabrication in the late 1990s.[11–13] Lately, the shape has been also demonstrated to be relevant in the determining the vascular and extravascular transport efficiency of intravenously injectable particles.[10,14–18]
Porous silicon (pSi) is a promising material for the fabrication of injectable particles owing to its biodegradability and biocompatibility.[19–22] Several drug delivery applications of injectable pSi suspension, such as the pSi powder obtained by ultrasonic fracture or ball-milling of electrochemically etched free-standing pSi films followed by extensive sorting, have been reported.[21,23–25] Our group has previously described hemispherical shaped pSi particles fabricated by the combination of electrochemical etching and photolithography, a typical semiconductor industry process, to enable precise control over shape and size of the pSi particles.[26,27] Based on this, we developed the concept of multistage delivery system comprising several nested nanocomponents (stages), each of which is designed to negotiate one or more biological barriers. The stage 1 pSi particles is rationally designed and fabricated in a nonspherical geometry to enable preferential deposition within the tumor vasculature. The stage 2 can be any therapeutic and/or imaging nanoparticles within a characteriztic size of 5–100 nm, such as liposomes, micelles, or gold nanoshells. The main function of the stage 1 is to efficiently transport the stage 2, loaded into the pores of stage 1, to the lesion.[26,28,29] pSi particles with extended pore size range are therefore demanded in order to formulate multistage system with a wide range of stage 2 nanoparticles.
In this paper we present a strategy for the fabrication of discoidal porous silicon particles with a broad range of dimensions and pore sizes. Cell viability and immune cell inflamatory respose to the pSi particles are studied in vitro. Finally, three discoidal particles, with a characteristic size of 600 nm × 400 nm, 1000 nm × 400 nm and 1700 nm × 400 nm, are selected for the in vivo biodistribution analysis.
2. Results
2.1. Fabrication of Discoidal pSi Particles
A novel strategy was developed to fabricate arrays of mono-disperse porous silicon particles directly on pSi films, using photolithography. In this process, the particle porosity and pore size are controlled by electrochemical etching, while particle dimension is independently defined by photolithography. As such, this fabrication strategy provides enough flexibility to fabricate multistage vectors[26] and can be directly translated to large scale production within the framework of established good manufacturing practice (GMP) semiconductor processes.
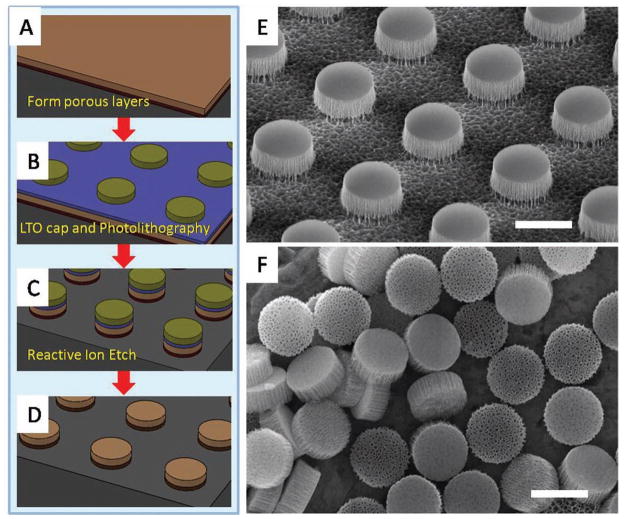
A schematic illustrating the fabrication steps is presented in Figure 1. First, a porous silicon film consisting of a device layer (light brown in Figure 1A) and a high porosity release layer (dark brown in Figure 1A) was formed in sequence by electrochemical etching in aqueous (hydrofluoric acid) HF solution. The porous film was then capped with a low temperature silicon oxide (LTO) layer (blue layer in Figure 1B) by a low pressure chemical vapor deposition (LPCVD). Arrays of discoidal porous silicon particle were thereby patterned on the film by photolithography (green in Figure 1B). The patterns were transferred into porous film by follow-up reactive ion etching (RIE; Figure 1C). After stripping the photoresist and the LTO, the as-made particles were retained on the substrate as an array allowing for further surface chemistry treatment (Figure 1D). Figure 1E shows a SEM image of an array of 1000 nm × 400 nm (diameter × height) discoidal particles retained on silicon substrate by the release layer. This array was released to yield mono-dispersed porous silicon particles by sonication. Figure 1F shows released 1000 nm × 400 nm discoidal particles made from 400 nm thick pSi film with 60 nm average pore size. The key fabrication steps are described in more details in the sequel. This fabrication strategy is robust and scalable. Our recent studies show the feasibility for a fabrication method of multilayer-stack discoidal particles, which will further increase the production yield by ten times. Taking 1000 nm × 400 nm discoidal particles as example, our results indicated that over 300 billion particles (≈100 mg at 60% porosity) could be obtained from an 8 in. wafer.
Figure 1.
Fabrication of discoidal porous silicon particles. A–D) Schematic process flow. E) SEM image of 1000 nm × 400 nm discoidal porous silicon particle array retained on a wafer. F) Released monodispersed 1000 nm × 400 nm discoidal porous silicon particle. Scale bars are 1 μm.
2.1.1. Capping of the Porous Silicon Film
Performing photolithographic processes directly on porous silicon structures has been challenging because of complexities associated with i) the uniform patterning of small critical features on a porous film, exhibiting locally altered optical reflectance and ii) the development and removal of the photo-resist seeped in the porous structure. To avoid this, a barrier coating was placed over the pSi film to protect it from the penetration of chemicals, thus leading to a more uniform exposure. The barrier coating was deposited by exploiting the pSi nucleation layer, which is a thin, low porosity microporous layer that always forms at the pSi-air interface due to instability phenomena at the onset of the electrochemical process. The nucleation layer acts as a diffusion barrier to the penetration of precursor gases necessary to deposit LTO by LPCVP. A 40 nm LTO film was proved to be an appropriate coating. It was limited to the region of the nucleation layer and provided an effective capping of the porous pSi film. Furthermore, the LTO film offered an additional hard mask layer for the reacting ion etching of higher aspect ratio patterns in the pSi. The LTO coating was easily stripped by selective wet etch in HF solution.
2.1.2. Tailoring the Geometry and Porous Structure of pSi Nanovectors
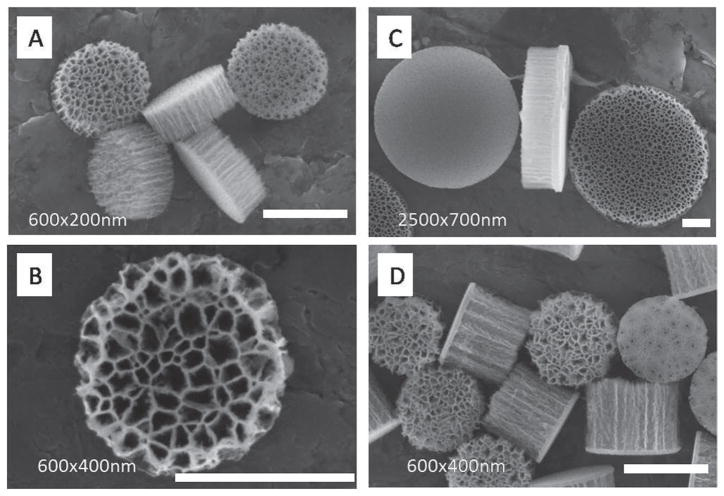
We fabricated monodisperse discoidal porous silicon particles with tunable diameters (500–2600 nm), heights (200–700 nm) and pore sizes (5–150 nm). Our unique fabrication process granted independent control over the dimension of the particles and their porous structure. Lithography defined the diameter of discoidal particles; its theoretical lower bound is defined by the current semiconductor technology node at tens of nanometers. Taking advantage of the high uniformity and reproducibility of the photolithography process, particles with a wide range of geometries (size, shape and aspect ratio) and porous structure (pore size and porosity) can be readily fabricated (Figure 2). Using a Karl Suss MA6 contact aligner (UV400) and a thin negative photoresist (Futurrex NR9-250P), we were able to make discoidal porous silicon particles with diameters as small as 500 nm and as thin as a few tens of nanometers at full wafer scale. As an example, a SEM image of 600 nm × 200 nm discoidal particles is shown in Figure 2A.
Figure 2.
Tailoring geometry and porosity of pSi discoidal particles. SEM images of: A) cluster of monodisperse 600 nm × 200 nm discoidal porous silicon particles with 30 nm pores. B) Front view of 600 nm × 400 nm disc with up to 100 nm pores. C) 2500 nm × 700 nm discoidal porous silicon particles showing front side, lateral, and backside view left to right. Frontside shows the microporous layer while backside shows the device layer with 80 nm pores. The lateral view (frontside to the right) shows the demarcation line between the cap and device layer. D) Cluster of monodisperse 600 nm × 400 nm discoidal porous silicon particles with 30 nm pores. Scale bars are 500 nm.
The porous structure of the particles is controlled by substrate properties and electrochemical etching. Using silicon wafer with 0.005 Ohm cm resistivity and HF/ethanol solution, we were able to fabricate nanovectors with a pore size ranging between 5 and 150 nm and porosity of 40–90%. Figure 2B shows a 600 nm × 400 nm particle with 100 nm average pore size. The fabricated discoidal particles featured two distinguishable flat surfaces: a microporous layer at the front and a layer with designed pore size at the back for hosting payload (Figure 2C). This differential pore size is very useful as it allows for the efficient loading and release of pay-loads only from one side, while preventing leakage from the opposite side.
The thickness of the pSi film has no effect on the photolithographic patterning of particles. Therefore, with the same photomask, discoidal particles with the same diameter but different aspect ratios can be fabricated. Discoidal particles with different height, namely 200 and 400 nm are shown in Figure 2A,D.
2.1.3. pSi Particles Handling and Release
Electrochemical porosification of silicon occurred almost exclusively at the moving pSi-Si interface during the formation of the porous silicon film. The duration of the electrochemical etching determines the thickness of the resulting pSi film. Typical electrochemical etching rates of the order of a few nanometers per second grant control over the thickness of the pSi film at the nanoscale. The current density controls the porous structure (pore size and porosity). Application of a stepwise current forms multilayer pSi film, where each layer has a characteristic porous structure.
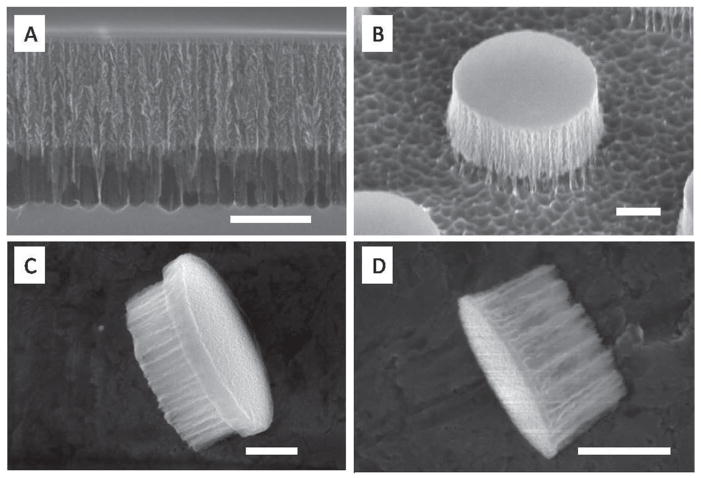
The multilayer structure is employed as particle release strategy. Once the pSi film is formed on the substrate, it must firmly adhere to the substrate and withstand without damage extensive handling. This includes extensive washing to remove hazardous chemicals, thermal treatment for dielectric film deposition and mechanical compression for contact lithography. A multilayer porous film (Figure 3), comprising at least a device layer surmounting a high porosity release layer, is necessary to meet the requirements for particle fabrication and release (Figure 3A). The device layer constitutes the structure hosting the stage 2 while the release layer is a high porosity structure that withstand extensive processing and can be removed rapidly upon sonication. The integration of the release layer simplifies the processing while simultaneously extending the range of possible processes, such as chemical and thermal treatments unsuitable to adhesives. It is the multilayer structure that allows thermal processing necessary to deposit a dielectric barrier coating which in turn is fundamental for successful lithography. After the photolithography and RIE processes, the release layer holds the as-formed particles during HF stripping of LTO and extensive flushing steps that ensure the removal of any chemical residuals. The cleaned particles are retained on the substrate further allowing differential surface modification (Figure 3B).
Figure 3.
Discoidal pSi particles. A) SEM image of multilayer porous silicon structure: 400 nm device layer and high porosity release layer; B) side view of 1000 nm × 400 nm particle retained on substrate by release layer; C) lateral view of 1200 nm × 500 nm discoidal pSi particle showing the device layer on the left side and the mechanical stability layer on the right side; and D) lateral view of 600 nm × 400 nm discoidal particles without mechanical stability layer. Scale bars are 300 nm.
2.1.4. Mechanical Stability Enhancement
With increasing pore size and porosity, the pSi particles become increasingly fragile, and a strategy to improve mechanical stability is required. The multilayer strategy is employed to realize a fabrication of a bilayer particle with a low porosity layer that provides overall mechanical stability to the particle, and a device layer with defined pore structure hosting biomedical agents (device layer). The multilayer strategy significantly reduces design constraints and extends the porosity and pore size range for the device layers. The native nucleation layer could be used as the mechanical stability layer for up to 60% porosity of device layer[27]. In case of higher porosity, an enhanced low porosity layer is designed as the mechanical stability layer. Figure 3C shows an example 1200 × 500 nm particle with a 90% porosity device layer, on which a 100 nm low porosity mechanical stability layer was formed by applying a 2 mA cm−2 current for 20 s, and steadily increasing the etching current from 2 mA cm−2 to 10 mA cm−2 over the course of 15 s to form a thick transition layer between low porosity and high porosity. This mechanical enhancement method enabled fabrication of stable particles with extended pore size range (over 150 nm) from a single type of silicon wafer. As comparison, a SEM image of 600 nm × 400 nm discoidal particle without a mechanical stability layer is shown in Figure 3D.
2.2. Biocompatibility of the Discoidal pSi Particles In Vitro
Since biocompatibility is one of the critical factors in developing drug delivery system, we examined degradation profiles of the discoidal pSi nanovectors in simulated physiological conditions as well as their interactions with endothelial and immune cells.
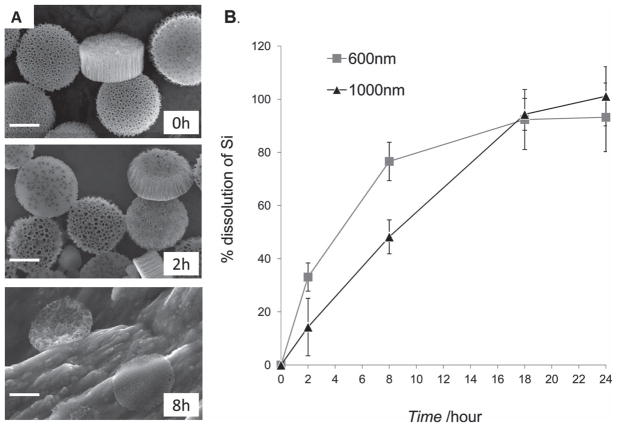
The biodegradation of 1000 nm × 400 nm discoidal pSi particles in fetal bovine serum was assessed by SEM imaging, and morphological changes with time are illustrated in Figure 4A, indicating discoidal pSi particles are readily degraded in serum. Quantitative analysis of elemental silicon in serum by means of inductive coupled plasma atomic emission spectroscopy (ICP-AES) also confirmed the dissolution of discoidal pSi particles with time in serum (Figure 4B). Recent studies by our group have shown that pSi particles of hemispherical geometry with 3.2 μm in diameter are readily degradable in PBS (pH 7.4), cell culture media, serum and blood[30] and that the degradation kinetics can be impeded by coating the surface of the particles with hydrophilic polymers[20]. It is important to note that the degradation product of pSi particles is a nontoxic silicic acid with a general formula of [SiOx(OH)4-2x]n released in the physiological pH range through hydrolysis of the Si-O bonds[31,32] and consequently excreted in the urine.[33] Interestingly, as seen from the SEM images, the discoidal pSi nanovectors maintain their general shape during the degradation process, with the mechanically enhancement layer “holding” the discoidal structure. This observation is of particular importance for drug delivery characteristics of the system, since the controlled release of the encapsulated inside the pores of the pSi nanovectors drugs/second stage therapeutic nanoparticles is mainly dependent on the degradation profile of the system and not on external triggers.[6,26]
Figure 4.
Degradation of pSi discoidal particles in fetal bovine serum. A) SEM images of 1000 nm × 400 nm pSi particles during the degradation process in fetal bovine serum at 37 °C. Time-points: 0, 2 and 8 h; scale bars are 500 nm. B) Degradation kinetics of pSi discoidal particles (600 nm × 400 nm and 1000 nm × 400 nm) as evaluated by ICP-AES. The degradation kinetic profile is expressed as a percentage of the total amount of pSi dissolved in medium.
The pore size and surface property of pSi particles can be tuned to store and hold specific molecules[32] or nanoparticles[28] through covalent bonds or static interaction, as a variety of silanization processes for pSi are available. Our previous works with hemispherical pSi particles have shown that, through appropriate chemical modifications of the pSi surface, we are able to conjugate and encapsulate fluorescent probes,[30] quantum dots,[26] liposomes,[6] iron oxide nanoparticles[34] and contrast agents[35] in the porous silicon structures. The association with pSi structures does not compromise the activity of the encapsulated agents and, on the opposite, in many cases due to the protection of the sensitive molecules, favorable distribution or confinement to the pores enables higher therapeutic[6] and imaging[35] efficiency. As an example, the study with pSi hemispherical particles bearing siRNA liposomes has shown a significantly superior efficacy in treatment of ovarian tumors as compared to free un-encapsulated liposomes.[6]
2.2.1. Interaction of Discoidal pSi Particles with Immune and Endothelial Cells In Vitro
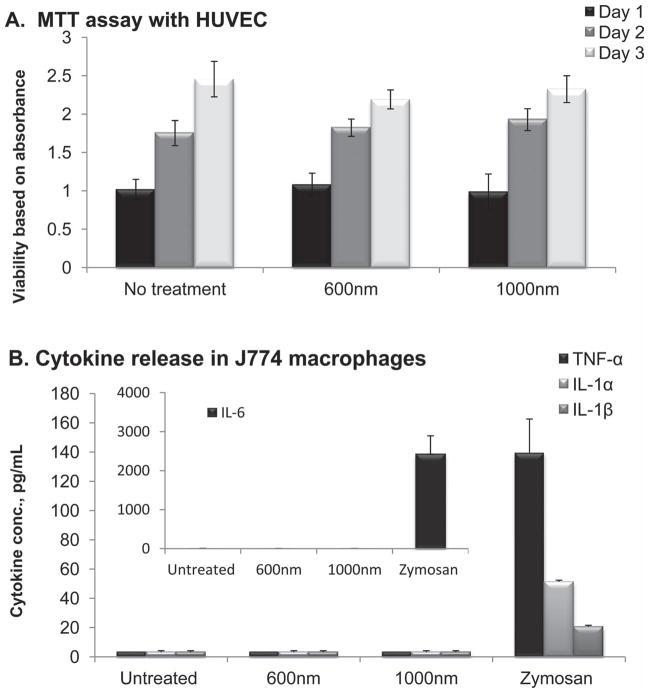
These two cells are the first line of defense with which any intravenously administered substance would have to interact. No effect on viability of human umbilical vein endothelial cells (HUVECs) following incubation with discoidal pSi nanovectors at the ratio of 5 particles per cell was recorded as indicated by no significant differences in the results of MTT cell growth assay over three days (Figure 5A). This ratio was chosen based on our previous studies with hemispherical particles. Taking into consideration the physical dimensions of the particles, five particles may occupy up to 50% of the volume of the cell cytoplasm.
Figure 5.
In vitro interactions of 600 nm × 400 nm and 1000 nm × 400 nm discoidal pSi particles with endothelial and immune cells. A) Proliferation assay of HUVECs exposed to pSi discoidal particles at a ratio of 5 particles/cell (n = 5). No significant differences in proliferation profiles of HUVECs were observed as compared to untreated controls (p > 0.05). B) Release of pro-inflammatory cytokines such as tumor necrosis factor-α (TNF-a), interleukins 1α, 1β and 6 following 24 h after incubation of J744 cells with pSi discoidal particles (5 particles/cell). Zymosan, positive control, caused significant increase in all four cytokines presented (p < 0.01). Both 600 and 1000 nm in diameter particles did not elicit cytokines release.
The major response of macrophages to stimuli is the release of cytokines, which can promote the cascade of inflammatory response to foreign substances.[36,37] Thus, to investigate the immune cells response to particle internalization, the release of 23 cytokines from murine J774A.1 macrophages following 24 hour incubation with the systems was evaluated as compared to Zymosan. The Zymosan particles, prepared from yeast cell wall and known to induce inflammatory responses in the macrophages, were used as a positive control in these experiments as we previously reported.[20] In general, we observed that the levels of the pro-inflammatory cytokines following introduction of the particles to immune cell are comparable with the negative control (untreated cells) levels. Figure 5B presents data on the levels of four pro-inflammatory cytokines TNF-α, IL-1α, IL-1β and IL-6, the cytokines that mostly reflect inflammatory processes, demonstrating that discoidal pSi particles did not induce the release of the cytokines while zymosan caused a very prominent increase in all of the inflammation factors tested. These data are in agreement with the previously reported studies on the interaction of hemispherical pSi particles of two different sizes (1.6 and 3.2 μm in diameter) with macrophages and endothelial cells, which showed that cellular proliferation, morphology, viability, mitotic potential as well as pro-inflammatory responses are not affected.[20,38] In vivo studies have shown no acute or sub-chronic toxicity of hemispherical pSi particles.[6,20,30]
2.3. Biodistribution in Murine Breast Cancer Model
2.3.1. Tumor Model
The 4T1 mammary carcinoma cell line is a triple negative highly tumorigenic and invasive cell line and, unlike most tumor models, can spontaneously metastasize from the mammary gland to multiple distant sites including lymph nodes, liver, lung, brain, and bone.[39] The 4T1 tumor has several characteristics that make it a suitable experimental animal model for human mammary cancer. First, tumor cells are easily transplanted into the mammary gland so that the primary tumor grows in the anatomically correct, orthotopic site. Second, 4T1 metastatic disease develops spontaneously from the primary tumor in a similar mode to human breast cancer. As an example, our data (Figure 1S, Supporting information) show that CD204 immunostaining revealed large quantities of macrophages in the tumor stroma, closely resembling the majority of clinical cases of breast cancer.[40]
2.3.2. Quantitative Analysis of pSi Discoidal Particle Distribution
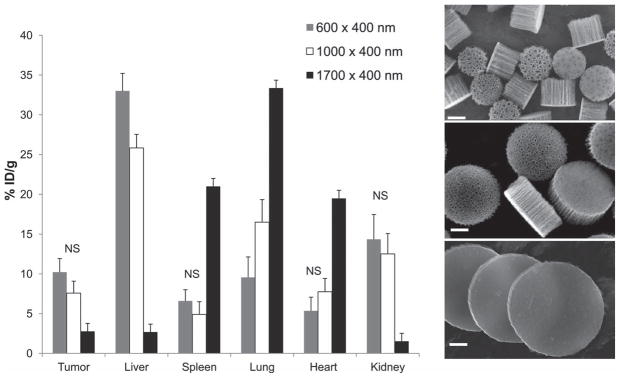
To evaluate organ distribution of discoidal pSi nanovectors, particles with nominal diameter of 600 and 1000 nm as well as nonporous silicon particles (d = 1700 nm) were injected in the tail vein of mice (n = 4–10 per group) bearing 4T1 orthotopic breast tumors. All the systems injected had a thickness of 400 nm and were oxidized to enable dispersion in aqueous solvents. No specific targeting moieties were introduced to their surface. Four animals were also injected with the identical volume of normal saline as a negative control. Four hours after injection the mice were sacrificed and tumors as well as the major organs (heart, lungs, liver, spleen, and kidneys) were collected. The samples were then analyzed for the silicon (Si) content by ICP-AES and treated for histological analysis. Initial pSi particle suspensions were also analyzed for Si content and the data is presented as% injected dose accumulated per mass unit of an organ (%ID/g). Figure 6 presents Si content in the organs following the injection of different particle sizes. While larger particles did not exhibit significant accumulation in the tumor tissue, high concentrations of both 600 nm × 400 nm and 1000 nm × 400 nm nanovectors, (up to 10.2% ID/g) were detected in the tumors. No statistically significant difference between the accumulation of 600 nm × 400 nm and 1000 nm × 400 nm nanovectors was detected. Nanovectors with diameter of 600 nm accumulated more prominently in the liver, but to a lesser extent in the lungs when compared to their 1000 nm in diameter counterparts (p < 0.05). For 1700 nm particles the amount of Si increased dramatically in the lungs, liver and spleen, the reticulo-endothelial system (RES) organs, as well as the heart.[15] A total of 66.4, 63.1 and 68.2% ID were recovered in the above five major organs and tumor for 600 nm × 400 nm, 1000 nm × 400 nm, and 1700 nm × 400 nm in diameter nanovectors after 4 h. These numbers can be attributed to a partial degradation of the systems leading to elevated levels of Si in kidneys without apparent presence of the nanovectors as will be discussed in the next session. Another possibility is that a distribution of the nanovectors to other organs/systems such as gastrointestinal tract and pancreas (through enterohepatic circulation), and lymphatic system occurred.
Figure 6.
Biodistribution of 600 nm (grey), 1000 nm (white), and 1700 nm (black) in diameter and 400 nm in thickness discoidal particles 4 h following intravenous administration at the dose of 7.5–9 mg Kg−1 to the tail vein of 4T1 orthotopic breast tumor bearing mice. Silicon analysis normalized to basal silicon levels in the tissues as evaluated by ICP-AES. The data is presented as% of injected dose/g organ. For all the entries besides those mentioned as NS, p < 0.05; NS- not significant; SEM images are acquired from the corresponding particles, scale bar 200 nm.
2.3.3. Histological Evaluation of pSi Distribution in the Tissues
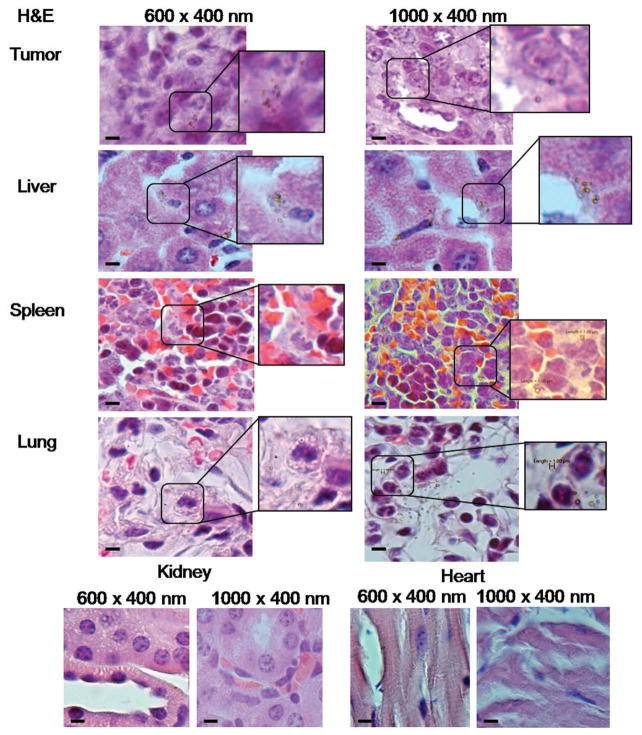
To gain further insight into the tumor accumulation mechanisms for the 600 and 1000 nm nanovectors, histological tissue sections stained with H&E were observed for the nanovector localization within the overall organ/tissue structures (Figure 7). The pSi nanovectors were detected in tumor, liver, spleen and lungs of the mice. No apparent accumulation in kidney and heart was seen, pointing toward a possibility that the detected levels of Si resulted from initial degradation of pSi, which was present in the circulation at the time of analysis and, being water-soluble, excreted through kidneys. This assumption is supported by in vitro degradation profiles showing 20–40% degradation within 4 h (Figure 4B).
Figure 7.
Organ distribution of 600 nm × 400 nm and 1000 nm × 400 nm discoidal particles 4 h following intravenous administration in the tail vein of 4T1 orthotopic breast tumor bearring mice. Histological analysis of H&E slides. pSi particles possess optical reflectance and are visualized as light green objects. Scale bars are 10 μm.
Our previous work with hemispherical pSi particles show that the in vivo dissolution of the particles is slower than in vitro.[6] It is partially related to the fact that when the pSi particles are trapped in tissues the flow rate of the fluid that the particles can be dissolved in is significantly reduced. In general, the degradation rate of pSi can be adjusted through surface modifications, such as PEGylation.[20] Similarly by controlling the thickness of silanes, such as 3-aminopropyltriethoxysilane, the degradation time of pSi particles can be tuned from hours to several weeks.[6]
2.3.4. Association of pSi with Macrophages and Endothelial Cells in Breast Cancer Tissue
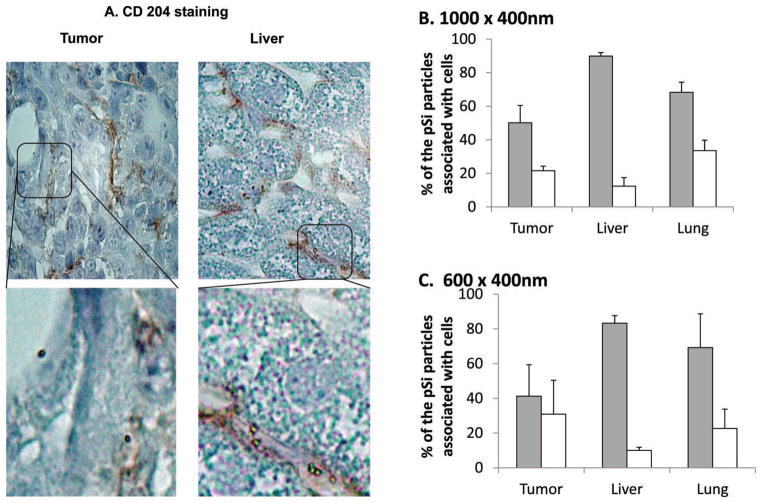
To shed more light on the pSi discoidal particles distribution in organs, association of the nanovectors in the tissue with vascular endothelium and macrophages was further evaluated. Endothelial cells were immunostained with CD31 antibody and tissue macrophages with CD204 antibody. Percentage of the pSi discoidal nanovectors associated with either cell population was assessed by counting at least 100 particles in each tissue section. Results presented in Figure 8 demonstrate that the majority of the nanovectors (≈90%) observed in the liver tissue were associated with CD204 positive cells (macrophages). In the tumor, on the contrary, for 600 nm × 400 nm almost equal amounts (no significant difference) of the nanovectors were attached/internalized by CD204 positive cells as by endothelial cells. For 1000 nm in diameter particles more prominent macrophage uptake was observed. Interestingly, in both cases close to 30% of the detected nanovectors in the tumor mass were neither associated with endothelial cells nor macrophages, but were found in the distance of up to 30 μm from the blood vessel. We suggest that these nanovectors can be directly associated with tumor cells.
Figure 8.
A) Immunohistochemical analysis of tumor and liver by staining macrophages with CD204 antibody-pSi particles can be seen in the cells as light reflecting objects; Quantitative analysis of association of B) 1000 nm × 400 nm and C) 600 nm × 400 nm discoidal nanovectors with macrophages (grey) and endothelial cells (white) in tumor, liver, and lung tissues.
2.3.5. Comparison with Spherical Beads Distribution
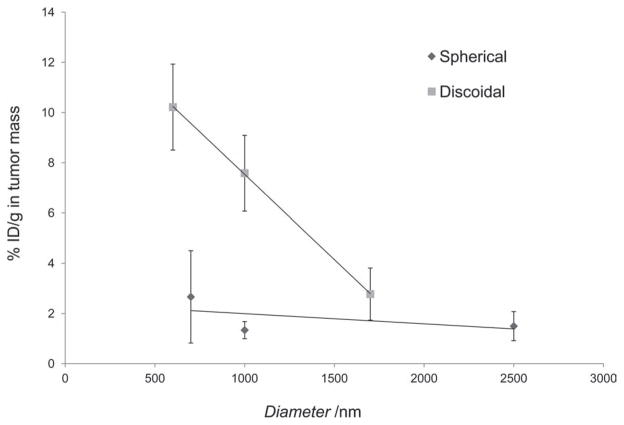
Once injected in the systemic circulation, particulates are transported along the vasculature and accumulate in the various organs through different size-dependent mechanisms. These mechanisms include trapping in the smallest capillaries, especially relevant for lung concentrations of >1 μm spherical particles[41] and the engulfment by mononuclear phagocytic cells, occurring mainly in the organs of the RES such as the liver and spleen.[42,43] In several pathological conditions vascular endothelium adjacent to the disease site has distinct features. For instance, tumor growth induces the development of neovasculature characterized by discontinuous endothelium with large fenestrations of 200–700 nm[44] allowing nanoparticle passage. Namely, passive accumulation in the extravascular space lined by a discontinuous endothelium with fenestrations of 100–700 nm, as for the permeable cancer vasculature[45,46] gives rise to enhanced permeability and retention (EPR), the dominant mechanism underlying the clinical efficacy of liposomes and polymer conjugates. Spherical nanoparticles currently approved for cancer treatment (e.g., Doxil, Abraxane) are in the range of 70 to 200 nm. However, more and more frequently the question “which particle size best suits the specific individual target?” is being asked and the aspect of rational design of nanovectors to enable delivery of therapeutics to the specific pathologic condition is within the research spotlight. Recently, nanoparticles geometry has been investigated as a tool to modulate biological behavior of the nanovectors.[1,10,14–17,47–49] Considering adhesion to the blood vessel walls as one of the main mechanisms for particle accumulation within the tumor mass, it should be emphasized that the vascular dynamics of discoidal nanovectors and spherical beads are significantly different. Non-spherical particles have been shown to spontaneously cross the stream lines in the blood flow (margination dynamics), interacting more frequently with the vessel walls and thus exhibiting a higher chance of recognizing the diseased endothelium. Also, discoidal particles can expose to the endothelial walls a larger surface of adhesion as compared to spherical beads with an equivalent diameter deq. Indeed, discoidal particles would more likely stick to the vessel walls with their bases, which has an area of ≈ deq2. Differently, only a very small portion of the surface area of a spherical bead is involved in the adhesion process. Finally, the hydrodynamic forces exerted over a discoidal particle adhering firmly to the vascular walls are smaller than those felt by a spherical bead with the same diameter. Summarizing, the margination dynamics of the discoidal particles and their higher strength of adhesion associated with lower hydrodynamic dislodging forces would explain the differences in tumor accumulation depicted in Figure 9.
Figure 9.
Effect of particle diameter on tumor accumulation of discoidal particles as compared to spherical particles. For discoidal particles, the height is 400 nm.
To estimate the effect of shape on the tumor accumulation a comparative analysis of the accumulation of the pSi discoidal nanovectors vs. spherical silica beads was performed. Data presented in Figure 9 clearly show that when considering similar radius of the particles, up to 5 times higher concentration of the pSi discoidal particles accumulated in the tumor mass. It is noteworthy to emphasize that none of the tested systems were conjugated to targeting ligands and all of them had similar zeta potential in the range of −24 to −41 mV and similar surface moieties (Si-OH), pointing that the observed in vivo behavior is related specifically to nanovectors’ geometry. Solid silica particles are not readily degradable in neutral pH in vitro, thus the time point of 4 hours was chosen for the comparison of the biodistribution. As it was earlier mentioned, pSi particles degrade slower in vivo than in vitro.[6] However, even if we assume that there is 20–30% degradation of particles with diameter of 1000 nm and compare their accumulation with 700 nm silica beads, it is very clear that the accumulation of discoidal particles in tumor is still ≈4 times higher. This behavior points towards other possible mechanisms that can be involved in the transport of non-spherical objects in the tumor tissue. It should be also noted that for example cells (non-spherical in their nature) with much larger dimensions (tens of micrometers) extravasate very efficiently into the tumor tissue.
3. Conclusions
In this study we developed a strategy for direct lithographic patterning of discoidal pSi particles, which enables independent control over particle dimensions and porous structure. Reproducible and scalable fabrication of monodisperse discoidal pSi particles was demonstrated. The resulting pSi nanovectors are biodegradable and do not induce toxic effects in endothelial/immune cells in culture, therefore suitable for injectable therapeutics and diagnostics drug delivery applications. Moreover, we have produced mechanically stable pSi particles with pore sizes over 150 nm that enables loading of a wide range of nanoparticles to formulate multistage delivery vectors.
Interestingly, in vivo studies have shown high accumulation of discoidal pSi nanovectors into the orthotopically grown breast tumors in mice, pointing towards the possibility to deliver high levels of drugs to the tumor loci. For 600 nm × 400 nm pSi particles, 10.2%ID/g were found in tumor, which is five times higher as compared to their spherical counterparts. It should be noted that tumor accumulation of discoidal pSi nanovectors was achieved without pursuing any active targeting strategy, emphasizing the effect of geometry on in vivo behavior of particles.
Collectively, these data support the notion that nanovectors can be rationally designed and realized using our microfabrication strategy, to achieve superior tumor accumulation efficiency. Based on the biocompitability and geometry-dependent biodistribution of discoidal pSi particles as well as their interaction with macrophages in the target tissue, we can expect that this system can be of benefit for the efficient delivery of therapeutics to tumors and other inflamatory conditions such as infectious and cardiovascular diseases.
4. Experimental Section
Fabrication of Discoidal Porous Silicon Particles
Starting with heavily doped P-type (100) silicon wafer with resistivity of 0.005 ohm cm (Silicon Quest, Inc, Santa Clara, CA) as the substrate, one surface of the wafer was exposed to 1:3 HF/ethanol solution, and electrochemically etched with applied current density of 10 mA cm−2 to form a porous silicon film with mean pore size of 40 nm. Then a high electrical current (≈76 mA cm−2) was applied to form a high porosity release layer. A 80 nm low-temperature oxide (LTO) was deposited on the porous silicon film in a low pressure chemical vapor deposition (LPCVD) furnace. A standard photolithography process was used to pattern the arrays of 600 nm and 1000 nm circles using a contact aligner (K.Suss MA6 mask aligner) and NR9-500P photoresist (Futurrex Franklin, NJ, USA). The patterns were transfered into LTO and porous silicon film by RIE in CF4 plasma (Plasmatherm Batchtop VII). After striping the LTO, the porous silicon disc arrays were released in IPA solution by sonication for 1 min. The morphology of pSi particles was verified using a Zeiss Neon 40 scanning electron microscope. The pSi particles were treated with H2O2 (30%) at 100 °C for 2 h to oxidize the surface. Volumetric particle size, size distribution and count were obtained using a Multisizer 4 Coulter Particle Counter (Beckman Coulter, Fullerton, CA, USA).
Evaluation of Biodegradation in Serum
Degradation of oxidized pSi particles in fetal bovine serum (FBS, Hyclone, USA) was assessed as previously described.[20] Briefly, 107 particles were added to 1.5 mL FBS in quadruplicates and incubated at 37 °C under constant mixing by rotary shaker until the appropriate time points had elapsed. Aliquots were taken from the tubes: 150 μL were filter-spun (0.2 μm filter) and ultracentrifuged (100K rpm, 30 min) to separate the non-degraded particles from the degradation medium and the resulting liquid was analyzed for Si contents by ICP-AES using a Varian Vista-Pro ICP–AES. Si was detected at 250.69; 251.43; 251.61 and 288.158 nm. Yttrium (1 ppm) was added to both standards and samples in order to correct for instrumental drift during the run. A calibration run including the internal control was done before each group of 15 samples. In addition, samples were analyzed in random order to avoid any bias in data acquisition. The detection limit of Si was 15 ppb. To analyze 100% Si contents, the S1MP were dissolved in 1 N NaOH overnight in 37 °C. The results are expressed as% of the silicic acid released into the medium.
Evaluation of Biocompatibility of the Particles with Human Macrophages and Endothelial Cells
J774A.1 murine macrophages were obtained from the American Type Culture Collection (ATCC) (Manassas, VA) and Human Umbelical Vein Endothelial Cells (HUVEC) from Lonza (USA). All reagents and medium were purchased from ATCC, Lonza and Gibco BRL (USA).
A viability assay in the presence of pSi discoidal particles at the concentration of 5 particles/cell was performed on HUVEC. Proliferation of the HUVEC cells was evaluated by the 3-(4,5-dimethylthiazol-2-yl)-2,5-diphenyltetrazolium bromide (MTT) assay at 24–96 h using the standard protocol.
For cytokine analysis J774A.1 macrophages were cultured overnight at 0.4–2 × 10⁶ cells mL−1 in RPMI 1640 containing fetal calf serum (10% w/v), glutamine (2 mM), penicillin (100 U mL−1), and streptomycin (100 μg mL−1), and maintained at 37 °C under 5% CO2 in 24 well plates. The cells were then washed and incubated with discoidal pSi particles for up to 24 h. Zymosan particles (Sigma, USA) were used as a positive control for cytokines production and untreated cells were tested for basal levels of cytokines release. The cell culture supernatant samples were collected at 1, 4 and 24 h and stored at −70 °C until the cytokine analysis. Samples were analyzed according to the manufacturer instructions, using a Milliplex mouse assay panel. Cytokines levels were read on the Luminex 200 System, Multiplex Bio-Assay Analyzer. The quantification was done based on standard curves for each cytokine in the concentration range of 1–32 000 pg mL−1.
In Vivo Biodistribution Studies
4T1 mammary gland tumor cell line was purchased from ATCC (Rockville, MD). The cells were maintained in Dulbecco modified Eagle’s medium (DMEM) containing 10% FBS supplemented with an antibiotic mixture in 5% CO2 at 37 °C. 8–10 weeks old female nu/nu nude mice were maintained in a VAF-barrier facility, and all animal procedures were performed in accordance with the regulation in the The Methodist Hospital Research Institute for the Care and Use of Laboratory Animals. 5 × 10⁵–106 4T1 cells (100μL of serum free DMEM) were injected into the mammary fat pad and allowed to establish tumors for 2–3 weeks (approx. 150–300 mm3) prior to intravenous injection with the nanovectors. Mice were injected with 7.5–9 mg Kg−1 of the carriers in 100 μL saline via tail vein. Four hours after the injection, the mice were sacrificed and the tumor and major organs (liver, spleen, heart, lungs and kidneys) were excised and weighed. Each organ was divided into two parts: one for elemental analysis of Si and another for histological evaluation.
Tissue was immediately placed in OCT, and rapidly frozen in dry ice isopentane. Frozen sections were cut at 6–8 μm sections, fixed with acetone, blocked, and IHC stained with anti-CD31 (endothelial cells, AbCam, USA) and anti-CD204 (macrophages, Imgenex, USA) antibodies according to the manufacturer instructions. Replicate serial sections from each organ were stained with Hematoxillin and Eosin. Further, at least 100 pSi particles were counted in each sample and the number of particles associated with the specific cell population (endothelial or immune) was analyzed. For qualitative and quantitative analysis of the number of macrophages in the proximity of primary 4T1 tumor area, the histological slides from the mammary fat pad of the healthy control mice and tumor bearing mice were stained by immuno-fluorescence technique with CD204 Alexa647 (AbD Serotec, Oxford, UK) accompanied by staining the cell nuclei with Sytox green (Invitrogen, USA).
The parts of the organs intended for analysis of Si were weighed, homogenized in 3 mL of 20% EtOH in 1N NaOH and left for 48 h at room temperature for extraction of Si. Then the extracts were centrifuged at 4200 rpm for 25 min and 0.5 mL of the supernatant were withdrawn, diluted with 2.5 mL of deionized water and analyzed for Si contents. Silicon content was measured using a Varian Vista-Pro ICP-AES as described above. Six standards were prepared using 1 ppm sodium silicate as a stock solution and 18-μΩ water as a diluent.
Further, all results were recalculated considering the dilutions performed and also normalized to percentage of total silicon resulting from the number of particles injected, or to the individual organ weight.
Acknowledgments
M.F., P.D., and X.L. share the seniority. The authors would like to thank I. J. Fidler (University of Texas MD Anderson Cancer Centre) for his insightful comments on the study and the manuscript. Q. Li is kindly acknowledged for her assistance with animal experiments. The microfabrication was performed in Microelectronics Research Center at University of Texas at Austin. The authors acknowledge financial support from the following sources: NIH U54CA143837 (CTO, PS-OC), NIH U54CA151668-01 (TCCN, CCNE), DOD W81XWH-09-1-0212, DOD W81XWH-07-2-0101, DOD W81XWH-10-2-0125, and National Natural Science Foundation of China 81128007.
Footnotes
Supporting Information
Supporting Information is available from the Wiley Online Library or from the author.
Contributor Information
Dr Biana Godin, Email: bgodin@tmhs.org.
Dr Xuewu Liu, Email: xliu@tmhs.org.
References
- 1.Ferrari M. Trends Biotechnol. 2010;28:181. doi: 10.1016/j.tibtech.2009.12.007. [DOI] [PMC free article] [PubMed] [Google Scholar]
- 2.Jain RK. Cancer Res. 1990;50:814s. [PubMed] [Google Scholar]
- 3.Jain RK. Annu Rev Biomed Eng. 1999;1:241. doi: 10.1146/annurev.bioeng.1.1.241. [DOI] [PubMed] [Google Scholar]
- 4.Jain RK, Stylianopoulos T. Nat Rev Clin Oncol. 2010;7:653. doi: 10.1038/nrclinonc.2010.139. [DOI] [PMC free article] [PubMed] [Google Scholar]
- 5.Whitehead KA, Langer R, Anderson DG. Nat Rev Drug Discovery. 2009;8:129. doi: 10.1038/nrd2742. [DOI] [PMC free article] [PubMed] [Google Scholar]
- 6.Tanaka T, Mangala LS, Vivas-Mejia PE, Nieves-Alicea R, Mann AP, Mora E, Han HD, Shahzad MM, Liu X, Bhavane R, Gu J, Fakhoury J, Chiappini C, Lu C, Matsuo K, Godin B, Stone RL, Nick AM, Lopez-Berestein G, Sood AK, Ferrari M. Cancer Res. 2010;70:3687. doi: 10.1158/0008-5472.CAN-09-3931. [DOI] [PMC free article] [PubMed] [Google Scholar]
- 7.Godin B, Serda RE, Sakamoto J, Decuzzi P, Ferrari M. Nanoparticles for Cancer Detection and Therapy. Wiley-VCH Verlag GmbH & Co; KGaA, Weinheim: 2010. [Google Scholar]
- 8.Peer D, Karp JM, Hong S, Farokhzad OC, Margalit R, Langer R. Nat Nanotechnol. 2007;2:751. doi: 10.1038/nnano.2007.387. [DOI] [PubMed] [Google Scholar]
- 9.Decuzzi P, Ferrari M. Biomaterials. 2006;27:5307. doi: 10.1016/j.biomaterials.2006.05.024. [DOI] [PubMed] [Google Scholar]
- 10.Godin B, Driessen WH, Proneth B, Lee SY, Srinivasan S, Rumbaut R, Arap W, Pasqualini R, Ferrari M, Decuzzi P. Adv Genet. 2010;69:31. doi: 10.1016/S0065-2660(10)69009-8. [DOI] [PMC free article] [PubMed] [Google Scholar]
- 11.Jain RK. Sci Am. 1994;271:58. doi: 10.1038/scientificamerican0794-58. [DOI] [PubMed] [Google Scholar]
- 12.Yuan F, Leunig M, Huang SK, Berk DA, Papahadjopoulos D, Jain RK. Cancer Res. 1994;54:3352. [PubMed] [Google Scholar]
- 13.Campbell RB, Fukumura D, Brown EB, Mazzola LM, Izumi Y, Jain RK, Torchilin VP, Munn LL. Cancer Res. 2002;62:6831. [PubMed] [Google Scholar]
- 14.Decuzzi P, Ferrari M. Biomaterials. 2008;29:377. doi: 10.1016/j.biomaterials.2007.09.025. [DOI] [PubMed] [Google Scholar]
- 15.Decuzzi P, Godin B, Tanaka T, Lee SY, Chiappini C, Liu X, Ferrari M. J Controlled Release. 2010;141:320. doi: 10.1016/j.jconrel.2009.10.014. [DOI] [PubMed] [Google Scholar]
- 16.Merkel TJ, Jones SW, Herlihy KP, Kersey FR, Shields AR, Napier M, Luft JC, Wu H, Zamboni WC, Wang AZ, Bear JE, DeSimone JM. Proc Natl Acad Sci USA. 2011;108:586. doi: 10.1073/pnas.1010013108. [DOI] [PMC free article] [PubMed] [Google Scholar]
- 17.Huang X, Li L, Liu T, Hao N, Liu H, Chen D, Tang F. ACS Nano. 2011;5:5390. doi: 10.1021/nn200365a. [DOI] [PubMed] [Google Scholar]
- 18.van de Ven AL, Kim P, Haley O, Fakhoury JR, Adriani G, Schmulen J, Moloney P, Hussain F, Ferrari M, Liu X, Yun S, Decuzzi P. J Controlled Release. 2012;158:148. doi: 10.1016/j.jconrel.2011.10.021. [DOI] [PMC free article] [PubMed] [Google Scholar]
- 19.Canham LT. Adv Mater. 1995;7:1033. [Google Scholar]
- 20.Godin B, Gu J, Serda RE, Bhavane R, Tasciotti E, Chiappini C, Liu X, Tanaka T, Decuzzi P, Ferrari M. J Biomed Mater Res A. 2010;94:1236. doi: 10.1002/jbm.a.32807. [DOI] [PMC free article] [PubMed] [Google Scholar]
- 21.Park J, Gu L, von Maltzahn G, Ruoslahti E, Bhatia SN, Sailor MJ. Nat Nanotechnol. 2009;8:331. doi: 10.1038/nmat2398. [DOI] [PMC free article] [PubMed] [Google Scholar]
- 22.Sun W, Puzas JE, Sheu TJ, Liu X, Fauchet PM. Adv Mater. 2007;19:921. [Google Scholar]
- 23.Salonen J, Kaukonen AM, Hirvonen J, Lehto VP. J Pharm Sci. 2008;97:632. doi: 10.1002/jps.20999. [DOI] [PubMed] [Google Scholar]
- 24.Salonen J, Laitinen L, Kaukonen AM, Tuura J, Bjorkqvist M, Heikkila T, Vaha-Heikkila K, Hirvonen J, Lehto VP. J Controlled Release. 2005;108:362. doi: 10.1016/j.jconrel.2005.08.017. [DOI] [PubMed] [Google Scholar]
- 25.Wu EC, Andrew JS, Buyanin A, Kinsella JM, Sailor MJ. Chem Commun. 2011;47:5699. doi: 10.1039/c1cc10993f. [DOI] [PubMed] [Google Scholar]
- 26.Tasciotti E, Liu X, Bhavane R, Plant K, Leonard AD, Price BK, Cheng MM, Decuzzi P, Tour JM, Robertson F, Ferrari M. Nat Nanotechnol. 2008;3:151. doi: 10.1038/nnano.2008.34. [DOI] [PubMed] [Google Scholar]
- 27.Chiappini C, Tasciotti E, Fakhoury JR, Fine D, Pullan L, Wang YC, Fu L, Liu X, Ferrari M. ChemPhysChem. 2010;11:1029. doi: 10.1002/cphc.200900914. [DOI] [PMC free article] [PubMed] [Google Scholar]
- 28.Godin B, Tasciotti E, Liu X, Serda RE, Ferrari M. Acc Chem Res. 2011;44:979. doi: 10.1021/ar200077p. [DOI] [PMC free article] [PubMed] [Google Scholar]
- 29.Mann A, Tanaka T, Somasunderam A, Liu X, Gorenstein DG, Ferrari M. Adv Mater. 2011;23:H278. doi: 10.1002/adma.201101541. [DOI] [PubMed] [Google Scholar]
- 30.Tasciotti E, Godin B, Martinez JO, Chiappini C, Bhavane R, Liu X, Ferrari M. Mol Imaging. 2011;10:56. [PMC free article] [PubMed] [Google Scholar]
- 31.Jugdaohsingh R, Anderson SH, Tucker KL, Elliott H, Kiel DP, Thompson RP, Powell JJ. Am J Clin Nutr. 2002;75:887. doi: 10.1093/ajcn/75.5.887. [DOI] [PubMed] [Google Scholar]
- 32.Anglin EJ, Cheng L, Freeman WR, Sailor MJ. Adv Drug Delivery Rev. 2008;60:1266. doi: 10.1016/j.addr.2008.03.017. [DOI] [PMC free article] [PubMed] [Google Scholar]
- 33.Carlisle EM. Science. 1970;167:279. doi: 10.1126/science.167.3916.279. [DOI] [PubMed] [Google Scholar]
- 34.Serda RE, Mack A, van de Ven AL, Ferrati S, Dunner K, Jr, Godin B, Chiappini C, Landry M, Brousseau L, Liu X, Bean AJ, Ferrari M. Small. 2010;6:2691. doi: 10.1002/smll.201000727. [DOI] [PMC free article] [PubMed] [Google Scholar]
- 35.Ananta JS, Godin B, Sethi R, Moriggi L, Liu X, Serda RE, Krishnamurthy R, Muthupillai R, Bolskar RD, Helm L, Ferrari M, Wilson LJ, Decuzzi P. Nat Nanotechnol. 2010;5:815. doi: 10.1038/nnano.2010.203. [DOI] [PMC free article] [PubMed] [Google Scholar]
- 36.Ward WK. J Diabetes Sci Technol. 2008;2:768. doi: 10.1177/193229680800200504. [DOI] [PMC free article] [PubMed] [Google Scholar]
- 37.Cerami A. Clin Immunol Immunopathol. 1992;62:S3. doi: 10.1016/0090-1229(92)90035-m. [DOI] [PubMed] [Google Scholar]
- 38.Serda RE, Ferrati S, Godin B, Tasciotti E, Liu X, Ferrari M. Nanoscale. 2009;1:250. doi: 10.1039/b9nr00138g. [DOI] [PMC free article] [PubMed] [Google Scholar]
- 39.Aslakson CJ, Miller FR. Cancer Res. 1992;52:1399. [PubMed] [Google Scholar]
- 40.De Palma M, Lewis CE. Nature. 2011;472:303. doi: 10.1038/472303a. [DOI] [PubMed] [Google Scholar]
- 41.Slack JD, Kanke M, Simmons GH, DeLuca PP. J Pharm Sci. 1981;70:660. doi: 10.1002/jps.2600700621. [DOI] [PubMed] [Google Scholar]
- 42.Ogawara K, Yoshida M, Higaki K, Kimura T, Shiraishi K, Nishikawa M, Takakura Y, Hashida M. J Controlled Release. 1999;59:15. doi: 10.1016/s0168-3659(99)00015-2. [DOI] [PubMed] [Google Scholar]
- 43.Wang J, Byrne JD, Napier ME, Desimone JM. Small. 2011;7:1919. doi: 10.1002/smll.201100442. [DOI] [PMC free article] [PubMed] [Google Scholar]
- 44.Hobbs SK, Monsky WL, Yuan F, Roberts WG, Griffith L, Torchilin VP, Jain RK. Proc Natl Acad Sci USA. 1998;95:4607. doi: 10.1073/pnas.95.8.4607. [DOI] [PMC free article] [PubMed] [Google Scholar]
- 45.Fang J, Nakamura H, Maeda H. Adv Drug Delivery Rev. 2011;63:136. doi: 10.1016/j.addr.2010.04.009. [DOI] [PubMed] [Google Scholar]
- 46.Maeda H, Matsumura Y. Adv Drug Delivery Rev. 2011;63:129. doi: 10.1016/j.addr.2010.05.001. [DOI] [PubMed] [Google Scholar]
- 47.Ferrari M. Nat Nanotechnol. 2008;3:131. doi: 10.1038/nnano.2008.46. [DOI] [PubMed] [Google Scholar]
- 48.Champion JA, Mitragotri S. Proc Natl Acad Sci USA. 2006;103:4930. doi: 10.1073/pnas.0600997103. [DOI] [PMC free article] [PubMed] [Google Scholar]
- 49.Mitragotri S. Pharm Res. 2009;26:232. doi: 10.1007/s11095-008-9740-y. [DOI] [PubMed] [Google Scholar]


