Abstract
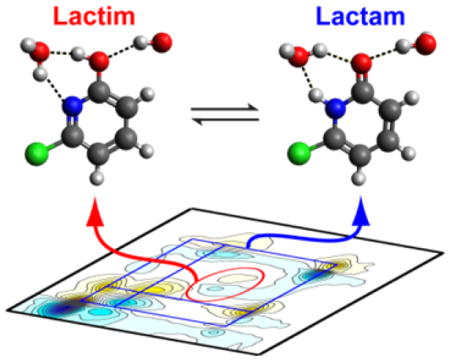
The tautomerism of aromatic heterocycles is of great interest because it directly affects their chemical properties and biological function. The tautomerism of 2-pyridone, 6-chloro-2-pyridone, and 4-pyrimidinone have been examined in D2O using FTIR, two-dimensional IR (2D IR) spectroscopy and density functional theory (DFT) calculations. Using the 2D IR cross-peak patterns, the lactim tautomer of 6-chloro-2-pyridone was separated from the lactam tautomer, and its population was observed to increase with temperature. The equilibrium constant of [lac-tam]/[lactim] was determined to be 2.1 at room temperature for 6-chloro-2-pyridone. Similarly, the N1H and N3H lactam tautomers of 4-pyrimidinone were identified with 2D IR. To assign the vibrational modes of different tautomers, DFT calculations of these chemical species were performed with explicit water molecules, and the hydration effects on the vibrational frequencies and intensities were established.
Keywords: 2-pyridone, lactam (keto), lactim (enol) tautomerization, 2D IR spectroscopy, vibrational spectroscopy, density functional theory
Understanding the tautomerism of aromatic heterocycles is of great importance in many areas of chemistry and biology.1–4 Histidine residues are often present in enzyme active sites because tautomerism of their imidazole rings provides chemical versatility and facilitates proton transfer in the catalytic steps.5,6 Since the canonical keto-amino forms of DNA nucleobases define the hydrogen-bonding structure for Watson-Crick base-pairing, tautomerization can lead to spontaneous mutagenesis when minor tautomers mispair during replication.7–9
One of the major limitations in identifying minor tautomers is the lack of experimental methods available for distinguishing interconverting tautomeric species. Tautomers cannot be separated by simple chemical methods; rather, a non-contact in situ probe is required. For example, UV-vis spectroscopy has been used extensively.4,10,11 Electronic spectra, although relatively easy to acquire, are often broad and featureless, which complicates the analysis when multiple tautomers co-exist. X-ray crystallography cannot determine accurate proton positions, hence limiting its use for directly identifying weakly populated tautomers.12,13 NMR spectroscopy is sensitive to tautomerizations since different atomic arrangements result in distinct chemical shifts. However, the observation of minor tautomers in aqueous solution and at room temperature becomes challenging since the exchange rates between tautomers can be rapid compared to the NMR time-scale and lead to motional narrowing.14 Improvements on these spectroscopic techniques towards the goal of determining tautomeric equilibria in water are crucial to understand relevant processes under physiological conditions. Finally, we note that quantum mechanical calculations are an important tool for comparing the relative stability of tautomeric systems;15,16 nevertheless, their predictions have not been tested extensively against experiment. Different levels of theory can lead to calculated energy differences of as much as 5 kcal/mol, and variation in the relative stability of species.17,18
Two-dimensional infrared spectroscopy (2D IR) is an emerging molecular vibrational spectroscopy which can be used to characterize tautomeric equilibria. These experiments use sequences of ultrafast IR pulses to characterize vibrational couplings, which appear as cross-peaks in 2D IR spectra.19 The distinct cross-peaks originating from different tautomers in 2D IR spectra enable unambiguous peak assignments that are often not possible in the congested FTIR or Raman spectra. Furthermore, the intrinsic picosecond time-resolution means that these measurements can potentially characterize the time-scale of tautomer exchange processes.
Here we describe the capability of 2D IR spectroscopy to characterize tautomeric equilibria using a study of keto-lactam to enol-lactim tautomerization in 2-pyridone derivatives. 2-pyridone has been regarded as the prototype for the keto-enol tautomerization in heterocycles.4,10,17 We focus on 2-pyridone and 6-chloro-2-pyridone to discuss the spectral signatures of the lactam and lactim tautomers. We chose these two model compounds to benchmark with existing experimental and computational results, and also to examine the agreement between the experimental IR spectra and DFT calculations. We study 4-pyrimidinone as an application to systems with multiple lactam tautomers.
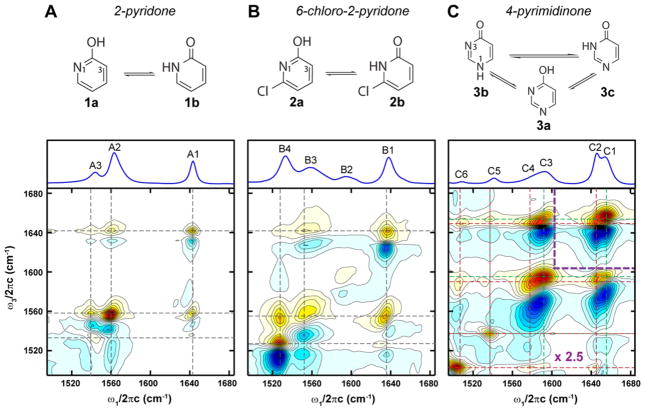
The chemical structures of the possible tautomers of the molecules studied, along with their FTIR and 2D IR spectra at room temperature in D2O, are shown in Figure 1. Each resonance in a 2D IR spectrum appears as a doublet with a positive peak (red) originated from the fundamental vibrational 0–1 transition, and a negative peak (blue) due to the 1–2 transition. The diagonal features correspond to the vibrational modes seen in the FTIR spectrum. Cross-peaks in the off-diagonal region correlate the vibrational excitation (ω1) and detection (ω3) frequencies, which allow the separation of different chemical species in a mixture. Previous 2D IR work on nucleic acid bases in the in-plane base vibration region has shown that clear cross-peaks can be observed between all of the diagonal peaks due to the delocalized nature of these in-plane C=O and ring vibrations in the aromatic system.20
Figure 1.
Chemical structures of possible tautomers (top), FTIR (middle) and 2D IR spectra (bottom) for: (A) 2-pyridone; (B) 6-chloro-2-pyridone; (C) 4-pyrimidinone. The IR spectra were taken at 23° C and in D2O (phosphate buffer at pH = 7.4). The 2D IR spectra, acquired with all-parallel polarization (ZZZZ), were normalized to the maximum of absolute value, and 25 equally spaced contours from −1 to 1 were plotted. 2D IR spectrum of 4-pyrimidinone have been scaled by x2.5 for frequencies < 1605 cm−1 to allow better visualization of the cross-peaks.
The infrared spectra of 2-pyridone from 1500 cm−1 – 1700 cm−1 display three well-separated peaks at 1643 cm−1 (A1), 1560 cm−1 (A2), and 1541 cm−1 (A3). In general, vibrational modes with high intensity and frequency > 1640 cm−1 can be assigned to C=O stretching; therefore A1 is expected to be the carbonyl stretch of the lactam tautomer 1b. Additionally, since prominent cross-peaks exist between all three modes in the 2D IR spectrum, these vibrational modes are attributed to the same chemical species, the lactam tautomer 1b. The presence of a monomeric species is confirmed with concentration dependence study and UV-vis absorption (SI), as well as studies in varying organic solvents (data not shown). The monomer/dimer equilibrium of 2-pyridone is dependent on solvent polarity,21–23 with monomers and dimers predominating in polar and non-polar solvents, respectively.
To assign the three observed vibrational resonances in Figure 1A to 1b, DFT calculations of deuterated 1b and 1a (2-hydroxypyridine) were performed using B3LYP/6-31G(d,p). Figure 2 shows the calculated IR spectra of 1b with zero, one, and two explicit D2O molecules making hydrogen-bonds (H-bonds) to the oxygen and nitrogen atoms (calculated frequencies and energies are tabulated in SI). The calculated frequencies and intensities for 1b with two explicit D2O molecules match experiment very well. This allows us to conclude that 1b is the major species for 2-pyridone under the experimental conditions. This is consistent with previous findings that the lactam-lactim equilibrium shifts to lactam in polar solvents such as water.23,24
Figure 2.
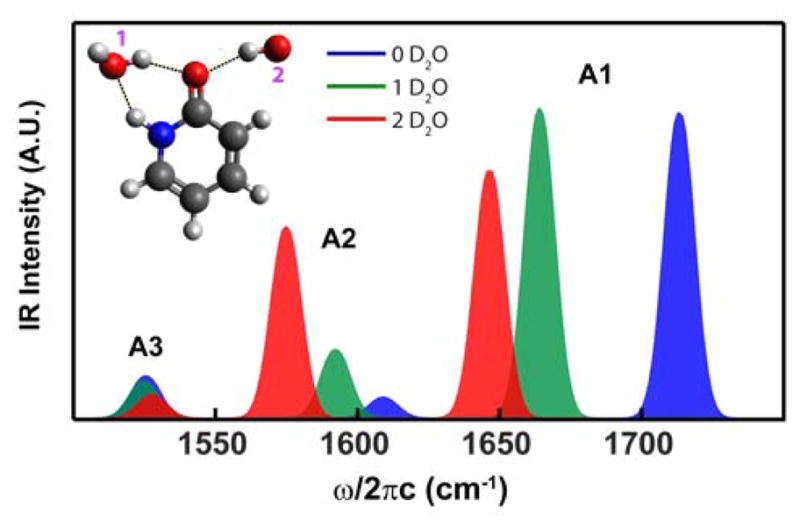
DFT calculated FTIR spectra of 2-pyridone with different number of explicit D2O molecules: 0 (blue), 1 (green) and 2 (red). All peak line-shapes were generated by convoluting stick spectra with a Gaussian profile with σ = 5 cm−1.
The importance of including explicit water molecules for describing the vibrational spectra, especially the two higher frequency modes A1 and A2, can be illustrated by looking at the normal mode composition in these calculations. We find that all three modes are highly delocalized with C=O stretch strongly mixed with the ring vibrations. Although A1 is predominately C=O stretch, as the number of D2O molecules hydrogen bonded to the oxygen increases from 0 to 2, the A1 frequency red-shifts from 1713 cm−1 to 1646 cm−1, and its ring breathing mode character increases. Dramatic red-shifting and intensification were also observed for A2. Frequency shift and intensity variation upon hydration have also been observed in DFT calculations of DNA base-pairs.25 On the other hand, A3, a ring deformation mode consisting of symmetric C=C stretches, is less affected by solvation. These results not only show the influence of water on vibrational frequencies, but also provide evidence for the presence of a bridging water molecule that facilitates the proton transfer induced exchange between 1a and 1b.
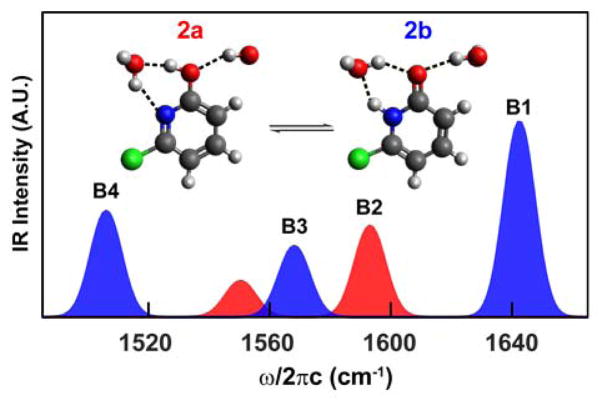
Substituents on aromatic heterocycles are known to shift the tautomeric equilibrium, and the addition of chloride at the 6 position was found to increase the lactim population.23,26 We therefore investigated the IR spectral signatures of 6-chloro-2-pyridone (2b) and its lactim tautomer, 6-chloro-2-hydroxypyridine (2a). The FTIR spectrum of 6-chloro-2-pyridone shows 4 bands of which the B1, B3, and B4 peak frequencies and 2D IR lineshapes are close to those of the parent 2-pyridone, suggesting that these peaks may arise from the lactam tautomer. Interestingly, the 2D IR spectrum shows that the 1591 cm−1 peak (B2) has no cross-peaks to the three peaks mentioned above, indicating that this vibrational mode originates from a separate species. IR harmonic frequencies and amplitudes of 2a and 2b with two solvating D2O molecules were computed and shown in Figure 3. There is a good correspondence with the experimental spectra where the three measured peaks at 1637 cm−1 (B1), 1550 cm−1 (B3), and 1528 cm−1 (B4) match well with the calculated modes for 2b at 1642 cm−1, 1568 cm−1, and 1506 cm−1. Likewise, the experimental 1591 cm−1 (B2) peak can be assigned to the calculated 1593 cm−1 peak for the lactim tautomer 2a. The second calculated band for 2a was not observed experimentally, most likely due to the lower oscillator strength and the low population of 2a. In addition, this peak overlaps with B3 and B4 peaks in 2b in a congested spectral region that would also make it difficult to be detected. The 2D IR spectrum of 6-chloro-2-pyridone clearly reveals the existence of two chemical species, and by comparing the experimental spectra to DFT calculations, we assigned the two species to be the lactam and lactim tautomers hydrogen-bonded with D2O. IR spectroscopy has been used in the gas phase to identify the lactim tautomer by detecting the O-H stretching vibration. This approach is not feasible in aqueous systems since the water O-H signal dominates. The identification of the distinct lactim vibration in the fingerprint region therefore provides an alternative means of characterizing the lactim tautomer.
Figure 3.
DFT calculated FTIR spectra of the lactam (blue) and lactim (red) tautomers of 6-chloro-2-pyridone with two explicit D2O molecules.
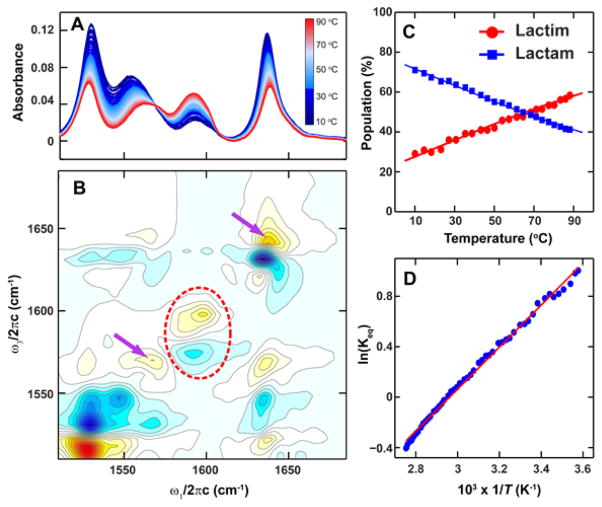
Temperature-dependent FTIR spectra of 6-chloro-2-pyridone (Figure 4A) show gain of the B2 peak and loss of the other three peaks, providing evidence that the ratio of lactim to lactam population increases with temperature. For the temperature-dependent 2D IR spectra (Figure S6), we performed singular value decomposition (SVD), which linearly decomposes the spectra and encapsulates the major spectral changes in response to temperature in the second spectral component (Figure 4B). Similar observations were found with a gain of the 2a peak (red dotted ellipse) and loss of 2b diagonal and cross-peaks. Integrating the FTIR peak intensities under bands B1 and B2 allows a thermodynamic analysis of the tautomerism within a simple two-state picture (see SI). The resulting temperature dependent tautomer populations are shown in Figure 4C. At room temperature, the equilibrium constant Keq = [2b]/[2a] = [lactam]/[lactim] was found to be 2.1 and in agreement with the value reported by Forlani and coworkers.23 Fitting the Arrhenius equation resulted in ΔH = −3.3 kcal/mol and ΔS = −9.8 cal/mol·K for the lactim to lactam conversion.
Figure 4.
Temperature dependence of 6-chloro-2-pyridone. (A) FTIR from 10oC (blue) to 90° C (red). (B) The second component spectrum calculated from the SVD analysis of the temperature dependent 2D IR spectra. (C) Populations of the lactim (2a, red circle) and lac-tam (2b, blue square) tautomers determined from the temperature-dependent FTIR. The solid lines are fits to Equation S3. (D) Arrhenius plot.
In addition to the tautomer equilibria, changes of the lactam hydration environment were also captured in 2D IR spectra. On the diagonal, Figure 4B shows that both B1 and B3 peaks are lost with temperature, but that this loss originates from the red-side of the lineshape, and is accompanied by some gain on the blue side (marked by purple arrows). This spectral feature corresponds to a blue-shift of the peak that is consistent with the weakening and disruption of the H-bonds around the molecule. A blue-shift of 12 cm−1 of the C=O peak can be compared to the amide car-bonyl red-shifts of ~ 16 cm−1 with the each addition of a H-bond to oxygen.27,28 Similar to 2-pyridone, DFT calculations show that the two higher frequency modes of the lactam tautomer 2b red-shift with increasing number of H-bonds to the carbonyl, whereas the modes of the lactim tautomer 2a are less affected (Figure S4).
2D IR spectrum of 4-pyrimidinone (Figure 1C) demonstrates how different lactam tautomers can be distinguished. 4-pyrimidinone is structurally similar to 2-pyridone with the replacement of C by N at the para- position of the carbonyl. Therefore, besides the lactim tautomer (3a), 4-pyrimidinone can exist in two different lactam forms depending on which N atom is protonated: the N1H lactam (3b) and N3H lactam (3c) tautomers. The FTIR spectrum of 4-pyrimidinone is distinct from those of 2-pyridone and 6-chloro-2-pyridone, most noticeably by the two carbonyl peaks at 1654 cm−1 (C1) and 1646 cm−1 (C2). This spectral feature is also reflected by the well-separated diagonal peaks in the 2D IR spectrum. As demonstrated earlier, the diagonal line-width reports the degree of solvent exposure since different surrounding environment leads to frequency distribution that results in peaks elongating along the diagonal. As a consequence, the C=O peak splitting can potentially be due to different solvent configurations around the carbonyl group which differ by one hydrogen bond to the C=O on average.29 However, the distinct cross-peak patterns of these two diagonal peaks to the 1503 cm−1 (C6) mode rule out this possibility, and indicate that they are two separate chemical species. The DFT calculations of the three tautomers 3a–3c with explicit solvent molecules predict that the carbonyl stretching mode of 3b is 5 cm−1 lower than that of 3c (see SI). Furthermore, the calculations show that, besides both lactam tautomers sharing a peak at ~ 1520 cm−1, 3b has a distinct mode at 1439 cm−1 whereas 3c has a peak at 1578 cm−1. These results are consistent with the cross-peak patterns seen in the experimental 2D IR spectrum, where cross-peaks are observed between the C5 peak and both C=O peaks, in addition to the distinctive cross-peaks at (ω1, ω3) = (1503 cm−1, 1646 cm−1) and (1593 cm−1, 1654 cm−1). Therefore, we assign C1 and C2 to 3c and 3b, respectively. Comparing the experimental spectra and DFT calculations, we did not detect significant lactim tautomer. This is in agreement with previous IR results of 4-pyrimidinone in CCl4 where an equilibrium constant of 0.012 was measured using [OH]/[NH].30 However, despite the general agreement between the DFT calculations and experimental spectra, we observed a larger intensity mismatch at 1590 cm−1 compared to the cases of 2-pyridone and 6-chloro-2-pyridone. The additional intensity is likely contributed by some amount of deprotonated 4-pyrimidinone, as shown by the pH = 13 spectrum in Figure S8.
In summary, we have demonstrated the capability of 2D IR spectroscopy in identifying the lactam and lactim tautomers in aromatic heterocycles using the distinctive cross-peak patterns. The observation of a ring vibrational marker for the lactim tautomer in the fingerprint region offers a way to probe the lactim tautomer in aqueous solution where water signal dominates in the O-H or O-D stretching region. We concluded that 2-pyridone exists mainly in the lactam form. 6-chloro substitution of 2-pyridone shifts the tautomeric equilibrium towards the lactim tautomer, and the fraction of this form increases with temperature. We have also observed that the N1H and N3H lactam tautomers of 4-pyrimidinone lead to frequency shifts of the carbonyl group and different cross-peak patterns. We should note that in principle, the equilibrium distribution can be obtained solely with FTIR once the assignment has been determined with 2D IR spectra and if the peaks are well-separated. The analysis presented here thereby provide a starting point to further develop 2D IR spectroscopy into a complementary technique to add to the existing toolbox in probing tautomerism in complex biological systems. Relevant biological processes take place in aqueous solutions, and water facilitates proton transfer by forming water bridges. With the intrinsic ultrafast time resolution and the capability of fast triggering technique such as photo-initiation or temperature-jump, transient 2D IR spectroscopy will offer insights into the dynamics of proton transfer during tautomerization. Such studies will help to explain phenomena such as preferential ligand recognition, spontaneous mutation, and enzyme catalytic functions.
EXPERIMENTAL METHODS
Chemicals were purchased from Sigma-Aldrich and used without further purification. The samples were dissolved in 100 mM phosphate buffer (pH = 7.4) in D2O at 5–10 mg/ml. For IR measurements, 25 μL of sample solution was sandwiched between two 1 mm thick CaF2 windows that are separated by a 50 μm Teflon spacer. Absorptive 2D IR spectra were collected using a 2D IR spectrometer as describe in detail previously.31 The waiting time (τ2) between the first two pulses and the third pulse was fixed at 150 fs. The coherence time between the first and the second pulse was scanned in 4 fs steps from −60 fs to 3.0 ps and 2.4 ps for rephasing and non-rephasing spectra, respectively. The coherence time (τ1) was Fourier-transformed to obtain the first frequency axis ω1. The heterodyned signal was dispersed in a monochrometer to obtain the ω3 frequency dimension and collected using a 64 × 2 pixel mercury-cadmium-telluride (MCT) array detector. Linear absorption from the solvent and solute was divided out along both the ω1 and ω3 axes to remove spectral distortions.32
Supplementary Material
Acknowledgments
We thank Carlos Baiz and Mike Reppert for their stimulating discussions, and our collaborators Vipender Singh, Deyu Li and John Essigmann for providing us with a problem that motivated our work on tautomerism. We thank the NSF (CHE-0911107), the MIT Center for Environmental Health Sciences (NIH Center Grant P30-ES002109), the MIT Laser Biomedical Research Center (NIH center grant P41-EB015871), and Agilent Technologies for support of this research. C.S.P. thanks the Poitras Foundation for a graduate fellowship.
Footnotes
Notes
The authors declare no competing financial interests.
ASSOCIATED CONTENT
Supporting Information. Details of the experimental methods, characterizations of the samples using FTIR and UV absorption, DFT calculation results, and temperature-dependent 2D IR spectra and thermodynamic analysis of 6-chloro-2-pyridone. This material is available free of charge via the Internet at http://pubs.acs.org.
References
- 1.Llor J, Munoz L. Tautomeric Equilibrium of Pyridoxine in Water. Thermodynamic Characterization by 13C and 15N Nuclear Magnetic Resonance. J Org Chem. 2000;65:2716–2722. doi: 10.1021/jo991821t. [DOI] [PubMed] [Google Scholar]
- 2.Nemeria NS, Chakraborty S, Balakrishnan A, Jordan F. Reaction Mechanisms of Thiamin Diphosphate Enzymes: Defining States of Ionization and Tautomerization of the Cofactor at Individual Steps. FEBS J. 2009;276:2432–3446. doi: 10.1111/j.1742-4658.2009.06964.x. [DOI] [PMC free article] [PubMed] [Google Scholar]
- 3.Thore S, Leibundgut M, Ban N. Structure of the Eukaryotic Thiamine Pyrophosphate Riboswitch with Its Regulatory Ligand. Science. 2006;312:1208–1211. doi: 10.1126/science.1128451. [DOI] [PubMed] [Google Scholar]
- 4.Beak P. Energies and Alkylations of Tautomeric Heterocyclic Compounds: Old Problems - New Answers. Acc Chem Res. 1977;10:186–192. [Google Scholar]
- 5.Hass MAS, Hansen DF, Christensen HEM, Led JJ, Kay LE. Characterization of Conformational Exchange of a Histidine Side Chain: Protonation, Rotamerization, and Tautomerization of His61 in Plastocyanin from Anabaena Variabilis. J Am Chem Soc. 2008;130:8460–8470. doi: 10.1021/ja801330h. [DOI] [PubMed] [Google Scholar]
- 6.Vila JA, Arnautova YA, Scheraga HA. Assessing the Fractions of Tautomeric Forms of the Imidazole Ring of Histidine in Proteins as a Function of pH. Proc Natl Acad Sci US A. 2011;108:5602–5607. doi: 10.1073/pnas.1102373108. [DOI] [PMC free article] [PubMed] [Google Scholar]
- 7.Wang W, Hellinga HW, Beese LS. Structural Evidence for the Rare Tautomer Hypothesis of Spontaneous Mutagenesis. Proc Natl Acad Sci U S A. 2011;108:17644–17648. doi: 10.1073/pnas.1114496108. [DOI] [PMC free article] [PubMed] [Google Scholar]
- 8.Jang YH, Goddard WA, III, Noyes KT, Sowers LC, Hwang S, Chung DS. First Principles Calculations of the Tautomers and pKa Values of 8-Oxoguanine: Implications for Mutagenicity and Repair. Chem Res Toxicol. 2002;15:1023–1035. doi: 10.1021/tx010146r. [DOI] [PubMed] [Google Scholar]
- 9.Goodman MF. Mutations Caught in the Act. Nature. 1995;378:237–238. doi: 10.1038/378237a0. [DOI] [PubMed] [Google Scholar]
- 10.Fujimoto A, Inuzuka K, Shiba R. Electronic Properties and Π-Π* Absorption Spectrum of 2-Pyridone. Bull Chem Soc Jpn. 1981;54:2802–2806. [Google Scholar]
- 11.Katritzky AR, Popp FD, Rowe JD. Potentially Tautomeric Pyridines. Part VII. Glutaconimide and Its Methyl Derivatives. J Chem Soc B. 1966:562–564. [Google Scholar]
- 12.Hunter WN, Brown T, Anand NN, Kennard O. Structure of an Adenine-Cytosine Base Pair in DNA and Its Implications for Mismatch Repair. Nature. 1986;320:552–555. doi: 10.1038/320552a0. [DOI] [PubMed] [Google Scholar]
- 13.Thore Sp, Frick C, Ban N. Structural Basis of Thiamine Pyrophosphate Analogues Binding to the Eukaryotic Riboswitch. J Am Chem Soc. 2008;130:8116–8117. doi: 10.1021/ja801708e. [DOI] [PubMed] [Google Scholar]
- 14.Kuhne RO, Schaffhauser T, Wokaun A, Ernst RR. Study of Transient Chemical Reactions by NMR. Fast Stopped-Flow Fourier Transform Experiments. J Magn Reson. 1979;35:39–67. [Google Scholar]
- 15.Brown RD, Godfrey PD, McNaughton D, Pierlot AP. Tautomers of Cytosine by Microwave Spectroscopy. J Am Chem Soc. 1989;111:2308–2310. [Google Scholar]
- 16.Colominas C, Luque FJ, Orozco M. Tautomerism and Protonation of Guanine and Cytosine. Implications in the Formation of Hydrogen-Bonded Complexes. J Am Chem Soc. 1996;118:6811–6821. [Google Scholar]
- 17.Mata S, Cortijo V, Caminati W, Alonso JL, Sanz ME, López JC, Blanco S. Tautomerism and Microsolvation in 2-Hydroxypyridine/2-Pyridone. J Phys Chem A. 2010;114:11393–11398. doi: 10.1021/jp104625z. [DOI] [PubMed] [Google Scholar]
- 18.Moreno M, Miller WH. On the Tautomerization Reaction 2-Pyridone ⇌ 2-Hydroxypyridine: An Ab Initio Study. Chem Phys Lett. 1990;171:475–479. [Google Scholar]
- 19.Hamm P, Zanni MT. Concepts and Methods of 2D Infrared Spectroscopy. Cambridge, U.K: Cambridge Press; 2011. [Google Scholar]
- 20.Peng CS, Jones KC, Tokmakoff A. Anharmonic Vibrational Modes of Nucleic Acid Bases Revealed by 2D IR Spectroscopy. J Am Chem Soc. 2011;133:15650–15660. doi: 10.1021/ja205636h. [DOI] [PubMed] [Google Scholar]
- 21.Inuzuka K, Fujimoto A. Theoretical Considerations of the Dimer-Formation Energy and Electronic Structures of the Monomer and Dimer of the 2-Pyridone by the Molecular Orbital Method. Bull Chem Soc Jpn. 1982;55:2537–2540. [Google Scholar]
- 22.Bensaude O, Chevrier M, Dubois JE. Lactim-Lactam Tautomeric Equilibriums of 2-Hydroxypyridines. 1. Cation Binding, Dimerization, and Interconversion Mechanism in Aprotic Solvents. A Spectroscopic and Temperature-Jump Kinetic Study. J Am Chem Soc. 1978;100:7055–7060. [Google Scholar]
- 23.Forlani L, Cristoni G, Boga C, Todesco PE, Vecchio ED, Selva S, Monari M. Reinvestigation of the Tautomerism of Some Substituted 2-Hydroxypyridines. ARKIVOC (Gainesville, FL, U S) 2002;2002:198–215. [Google Scholar]
- 24.Weisstuch A, Neidig P, Testa AC. A Fluorescence Study of Hydroxypyridines. J Lumin. 1975;10:137–144. [Google Scholar]
- 25.Lee C, Cho M. Vibrational Dynamics of DNA. II. Deuterium Exchange Effects and Simulated IR Absorption Spectra. J Chem Phys. 2006;125:114509-1–12. doi: 10.1063/1.2213258. [DOI] [PubMed] [Google Scholar]
- 26.Michelson AZ, Petronico A, Lee JK. 2-Pyridone and Derivatives: Gas-Phase Acidity, Proton Affinity, Tautomer Preference, and Leaving Group Ability. J Org Chem. 2012;77:1623–1631. doi: 10.1021/jo201991y. [DOI] [PubMed] [Google Scholar]
- 27.Ham S, Kim J-H, Lee H, Cho M. Correlation between Electronic and Molecular Structure Distortions and Vibrational Properties. II. Amide I Modes of NMA–nD2O Complexes. J Chem Phys. 2003;118:3491–3498. [Google Scholar]
- 28.Smith AW, Lessing J, Ganim Z, Peng CS, Tokmakoff A, Roy S, Jansen TLC, Knoester J. Melting of a Beta-Hairpin Peptide Using Isotope-Edited 2D IR Spectroscopy and Simulations. J Phys Chem B. 2010;114:10913–10924. doi: 10.1021/jp104017h. [DOI] [PubMed] [Google Scholar]
- 29.Woutersen S, Mu Y, Stock G, Hamm P. Hydrogen-Bond Lifetime Measured by Time-Resolved 2D-IR Spectroscopy: N-Methylacetamide in Methanol. Chem Phys. 2001;266:137–147. [Google Scholar]
- 30.Padermshoke A, Katsumoto Y, Aida M. Dimerization and Double Proton Transfer-Induced Tautomerism of 4(3H)-Pyrimidinone in Solution Studied by IR Spectroscopy and Quantum Chemical Calculations. J Phys Chem B. 2006;110:26388–26395. doi: 10.1021/jp065408i. [DOI] [PubMed] [Google Scholar]
- 31.Chung HS, Khalil M, Smith AW, Tokmakoff A. Transient Two-Dimensional IR Spectrometer for Probing Nanosecond Temperature-Jump Kinetics. Rev Sci Instrum. 2007;78:063101-1–10. doi: 10.1063/1.2743168. [DOI] [PubMed] [Google Scholar]
- 32.Jones KC, Ganim Z, Peng CS, Tokmakoff A. Transient Two-Dimensional Spectroscopy with Linear Absorption Corrections Applied to Temperature-Jump Two-Dimensional Infrared. J Opt Soc Am B. 2012;29:118–129. [Google Scholar]
Associated Data
This section collects any data citations, data availability statements, or supplementary materials included in this article.


