Abstract
This paper uses newly collected household survey data from Accra, Ghana, to investigate whether incomes affect acute and chronic health outcomes in settings that can be considered representative for the large and rapidly growing urban centers of sub-Saharan Africa. The Time Use and Health Study in Accra collected information on incomes, current health status, and health care use from 5,484 persons in 1,250 households, each repeatedly sampled on a rolling basis for a period of 13 weeks. Data collection took place during September 2008–March 2010 to capture seasonal variations. The study found that incomes varied widely between households, and that a high fraction of persons lived below the poverty line. Despite this level of income poverty and an overall remarkably high burden of treatable disease, no systematic differences in self-reported and objectively measured health conditions were detected across socioeconomic groups.
Introduction
As part of a broader effort to measure and document the urban burden of disease in modern sub-Saharan Africa, the Women's Health Study of Accra (WHSA) was launched in 2003,1–6 and a second round of household interviews was conducted during September 2008–March 2010. One of the central findings of the initial surveys was the remarkably high prevalence of chronic disease, and the rather weak relationship between ill health and household asset holdings.7 Given the focus of the WHSA on health and the epidemiology of health among adult women, no information was collected on household income or household finances in the original survey.
To address this issue, the Time-Use and Health Study of Accra (TUHS) was designed and launched in 2008 with the explicit goal of capturing short-term variations in health status and income fluctuations at the household level. A large literature has highlighted the important effects of poverty on health on the one hand, and at the same time noting the negative effect of severe health conditions on economic outcomes in general, and poverty in particular.8–11 However, most of these conclusions for sub-Saharan Africa are based on results from the various demographic and health surveys conducted throughout the region. The focus of these surveys was almost entirely on fertility, reproductive health, and children's health; little information was obtained about the health of adults; and no information was gathered for adults more than 49 years of age.
This gap is in the process of being filled in selected countries, including Ghana, through the coordination of data analyses from the International Network for the Demographic Evaluation of Populations and Their Health in Developing Countries (INDEPTH) and from the World Health Organization Study on global AGEing and adult health (SAGE) surveys. For example, data from the Kassena-Nankana Surveillance District in Ghana show that older adults (> 50 years of age) in the poorest three socioeconomic status quintiles were significantly more likely to self-report their health as poor than were adults in the two highest socioeconomic status quintiles.12 However, because that survey was conducted in a predominantly rural region of northern Ghana, the results may not necessarily be generalizable to an urban setting. In this report, we use the data collected within the TUHS to first assess the prevalence of poverty, and then directly investigate the associations between poverty and health in the modern urban sub-Saharan African setting of Accra.
Methods
Using a rolling-sample design, the TUHS monitored 1,254 households with respect to their health and economic activities over a period of three months. Chronic and acute health problems were documented, and all health expenditures and sources of income were tracked through weekly visits. Conceived as a sub-study within the larger WHSA project, household enrollment in the TUHS was conditional on prior participation of at least one adult woman in the household in the WHSA. At the end of the WHSA-II interview, respondents were asked if they were willing to participate in a new follow-up study. Women willing to do so entered the pool of potential study participants. Of the 1,819 women interviewed in the WHSA-I and WHSA-II, 1,561 (87%) expressed their willingness to participate in the follow-up study. Interested women were visited by a trained interviewer at their homes and provided with further details regarding the study.
Given the high rates of illiteracy in the population, interviewers were trained to carefully read the consent form to study participants. The consent form contained a detailed description of the structure, purpose, and duration of the study, and carefully informed participants about their right to refuse to participate in the study and the right to not answer specific questions or exit the study at any point of time. Participants were also informed that no payments would be made for participating in the survey.
All study procedures and consent forms were approved by the Noguchi Memorial Institute for Medical Research Institutional Review Board and the Institutional Review Boards at the Harvard School of Public Health and San Diego State University. Twenty-two household members died during the surveying period, and an additional 249 members left the household for other reasons. A total of 421 new members entered the households over the same period. The average exchange rate over the study period was 1.5 New Ghana Cedis per US$.
Because interviewers had to visit an average of six households per day, sampling was restricted to households living in the original enumeration areas (spatial areas comparable to U.S. census tracts). Since Wave I, 194 women had moved away and were thus excluded from the TUHS study pool. Of the remaining 1,367 women, 113 were physically unable or refused to participate in the study when first visited, leaving a final sample of 1,254 respondents and their respective households. Standard t-tests were performed to compare average characteristics of women participating in the TUHS to women in the larger WHSA-II sample. There were no statistically significant differences found across the two samples with respect to age, income, and wealth, or with respect to self-assessed health, blood pressure, or body mass index.
Given that a full set of asset holdings had already been collected during the WHSA-II household survey, the TUHS survey focused on a detailed monitoring of time use, the economic activities of household members, and differences in typical time use associated with acute health problems in the household. After obtaining the respondent's informed consent following the national human subject guidelines, households were enrolled into the study during the first visit, and a full listing of household members was obtained, including personal details such as age, sex, education, and relation to the household head. To minimize recall bias on health issues, each enrolled household was then visited by an interviewer on a weekly basis over a period of three months (13 weeks). During each of the 12 subsequent follow-up visits, respondents were asked to identify any episodes of illness among any of the household members, including adults and children, since the last interview. Once an illness episode had been identified, interviewers completed a detailed treatment module, asking about the nature and duration of the health problem, treatment location, cost, and type of payment. In addition, special modules on schooling and economic activities of all household members were added during the visits in weeks 7 and 11. This staged collection of information helped reduce study fatigue among participants and to increase the level of trust and familiarity between study participants and enumerators. After 13 weeks, households left the study after a final interview.
For persons who had completed their schooling, interviewers implemented an economic activity questionnaire. This questionnaire asked respondents to list the number of hours spent on each of the preceding seven days on up to three principal activities, and the typical income generated by each activity. Interviewers were intensively trained to be able to support and assist with the income calculations. Most working respondents in the sample engaged in informal labor with highly varying income. Rather than focusing on any specific days, interviewers were instructed to obtain an average income for the activity of interest. Given the large fraction of the urban population engaged in minor sales activities (petty trading), particular attention was directed to measuring the net revenue generated by these jobs; interviewers were carefully soliciting expenses and revenues for a typical market day and then netting out the resulting income flows. In addition to the labor income collected for up to three economic activities per person, each person was also prompted for non-labor income flows, such as income from real estate or vehicle rental (taxis), pensions or, most commonly, financial transfers and remittances from friends and family members.
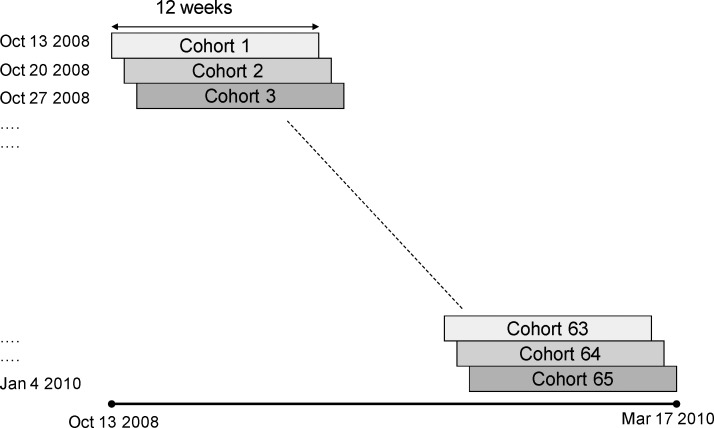
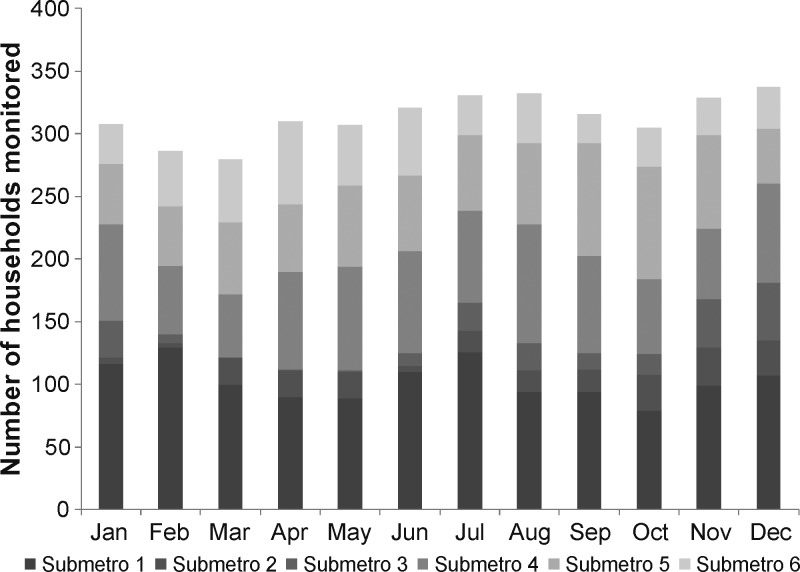
As shown in Figure 1, the rolling sample design used in the TUHS meant that the number of households enrolled over time slowly increased from 25 in week 1 to 275 in week 13, and then slowly decreased as the last cohorts were enrolled in late December 2010. The objective of the sampling procedure was to achieve a roughly constant sample size across all seasons, while keeping the spatial and thus the socioeconomic mixture of households roughly the same across all rounds. As shown in Figure 2, this objective was achieved: a total coverage of approximately 300 households (1,250 persons) was monitored in each calendar month and a roughly constant fraction of households was allocated to each of the city's six sub-Metro areas.
Figure 1.
Time-Use and Health Study of Accra, Ghana, rolling sample design.
Figure 2.
Survey coverage by calendar month, Accra, Ghana.
The main outcomes of interest for the study are self-reported acute and chronic health problems collected during the weekly follow-up visits. In addition to the self-reported health measures, we also investigate the relationship between income and hypertension and obesity as two biometric measures of adult health collected as part of the WHSA-II, the data for which are incorporated into the TUHS, as noted above. Women are classified as hypertensive if their systolic blood pressure was ≥ 140, their diastolic blood pressure was ≥ 90, or they were currently taking blood pressure medication. Women were classified as obese if their body mass index (weight in kilograms divided by height in meters squared) was ≥ 30.
Results
The main sample characteristics by age group collected during the baseline interview are shown in Table 1. The average age of the sample population was 29 years; 42% were of the Ga ethnic group, 31% were Akan, and 12.4% were Ewe. Given the original sampling frame, the adult population was predominantly female and the sex balance was more even for children and teenagers. Approximately 90% of children 5–18 years of age were in school, highlighting the solid progress made with respect to primary and secondary education in Ghana over the past decades. Most (91%) adults in the sample engaged in at least one income-generating activity. The mean daily salary in the sample was approximately US$5 at exchange rates prevalent during the study; 75% of persons reported a regular income, and only 17% of the sample earned more than US$10 per work day or US$200 per month.
Table 1.
Descriptive characteristics of the study population by subsample, Accra, Ghana*
| Characteristic | Total, n = 5,484 | Children > 5 years of age, n = 414 | Children 5–18 years of age, n = 1,472 | Adults > 18 years of age, n = 3,487 | ||||
|---|---|---|---|---|---|---|---|---|
| Female | 3,422 | (62.4) | 198 | (48.1) | 784 | (53.3) | 2,384 | (68.4) |
| Age, years, mean (SD) | 29 | (20.7) | 2 | (1.4) | 12 | (3.8) | 40 | (17.4) |
| Ga ethnicity | 2,312 | (42.2) | 161 | (38.9) | 595 | (40.5) | 1,507 | (43.2) |
| Akan ethnicity | 1,699 | (31.0) | 135 | (32.9) | 464 | (31.5) | 1,068 | (30.6) |
| Ewe ethnicity | 680 | (12.4) | 37 | (9.2) | 200 | (13.6) | 427 | (12.3) |
| Married | 1,564 | (28.5) | 3 | (0.7) | 18 | (1.2) | 1,542 | (44.3) |
| No schooling | 964 | (17.6) | 137 | (9.3) | 434 | (12.4) | ||
| Primary schooling | 1,202 | (21.9) | 769 | (52.2) | 334 | (9.6) | ||
| Secondary schooling | 2,853 | (52.0) | 556 | (37.8) | 2,289 | (65.6) | ||
| Tertiary schooling | 392 | (7.2) | 6 | (0.4) | 387 | (11.1) | ||
| In school | 1,928 | (35.2) | 237 | (57.2) | 1,317 | (89.5) | 275 | (7.9) |
| Working | 3,299 | (60.2) | 119 | (8.1) | 3,181 | (91.2) | ||
| No income | 2,824 | (51.5) | 1,411 | (95.9) | 888 | (25.5) | ||
| Income 0 to ≤ $100 | 1,270 | (23.2) | 50 | (3.5) | 1,219 | (35.0) | ||
| Income $100 to ≤ $200 | 793 | (14.5) | 2 | (0.2) | 791 | (22.7) | ||
| Income > US$200 | 594 | (10.8) | 6 | (0.4) | 587 | (16.9) | ||
Values are no. (%) unless otherwise indicated.
A total of 644 household members reported having at least one chronic health problem. Although chronic conditions are relatively rare among young adults, approximately 50% of household members > 60 years of age had at least one chronic condition. The most frequently reported health conditions are shown in Table 2: as documented in the initial WHSA-I study, hypertension/high blood pressure is the most common health problem in this population, followed by chronic pain, diabetes, vision issues, and asthma.
Table 2.
Self-reported chronic conditions in study population, Accra, Ghana*
| Condition | Total, n = 5,484 | Persons 18–59 years of age, n = 3,023 | Persons ≥ 60 years of age, n = 613 | |||
|---|---|---|---|---|---|---|
| No. | % | No. | % | No. | % | |
| Hypertension | 197 | 3.6 | 89 | 2.9 | 98 | 16.0 |
| Chronic pain | 86 | 1.6 | 44 | 1.5 | 41 | 6.7 |
| Asthma | 64 | 1.2 | 41 | 1.4 | 18 | 2.9 |
| Eye or ear problems | 65 | 1.2 | 39 | 1.3 | 21 | 3.4 |
| Diabetes | 51 | 0.9 | 21 | 0.7 | 29 | 4.7 |
| Other | 181 | 3.3 | 95 | 3.1 | 80 | 13.1 |
| Any condition | 644 | 11.7 | 329 | 10.9 | 287 | 46.8 |
All variables were based on a baseline survey question asking members of the households to list all (if any) chronic condition they had from at the time of the interview.
Over the whole study interval, 1,193 health problems were reported. The principal causes of acute health problems are shown in Table 3. By far the most common health issue was malaria; approximately 25% of all health issues were attributed to the disease. Because the term malaria is used for a large number of conditions in the region, interviewers were instructed to carefully distinguish malaria from other generic fevers; non-malarial fever was reported as the third most-common cause behind general body pains. Other major health issues were diarrhea, respiratory infections, and a range of cardiovascular issues.
Table 3.
Frequency and shares of most common acute health problems in study population, Accra, Ghana
| Health problem | No. | % |
|---|---|---|
| Malaria | 301 | 25.3 |
| General body pains | 281 | 23.6 |
| Fever | 192 | 16.2 |
| Diarrhea | 147 | 12.3 |
| Respiratory infection | 92 | 7.8 |
| Cardiovascular problem | 20 | 1.7 |
| Other | 156 | 13.2 |
Income distribution and poverty levels.
Income distribution for all persons in the sample is shown in Table 4. Mean annual income per capita was US$950, and the median was US$730. These figures were derived by summing total monthly incomes from all sources and all household members. To calculate daily income per capita, the monthly household income was then divided by the number of household members (adults and children each counting as one person) and the number of days (30). As shown in Table 4, 20% of persons had less than US$1 at their disposal per day. With a poverty line of US$2, nearly 50% of persons in the sample live in poverty.
Table 4.
Income and poverty levels in study population, Accra, Ghana
| Income per day and person | No. | % |
|---|---|---|
| < 1 | 1,123 | 20.48 |
| $1 to < $2 | 1,587 | 28.94 |
| $2 to < $4 | 1,834 | 33.44 |
| ≥ $4 | 940 | 17.14 |
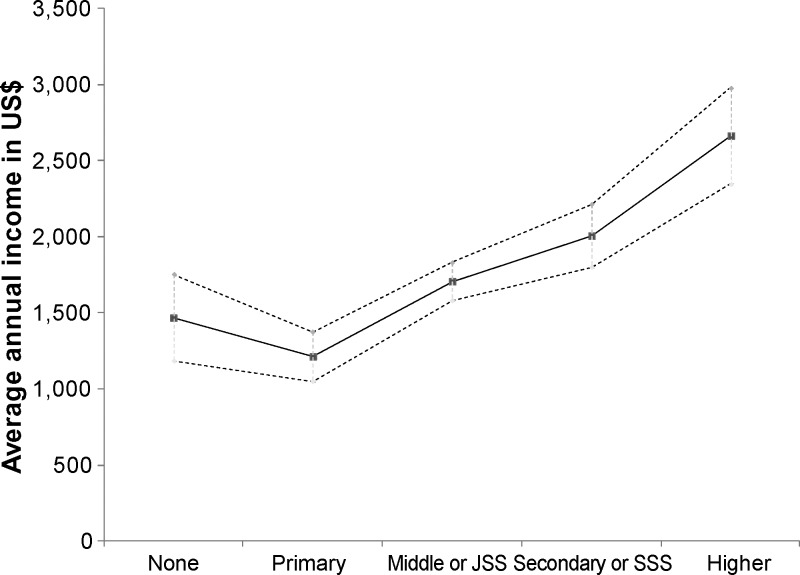
As documented extensively in the economics literature,13,14 schooling is a powerful predictor of personal incomes, with an estimated return of close to 10% per year of schooling beyond primary education (i.e., each year of schooling increases annual incomes by 10%). The distribution of personal income by education group for adults 25–59 years of age is shown in Figure 3. Although there was no difference between non-educated persons and persons with primary schooling, the returns to additional schooling appear to be large: individuals in the college group earned an average of approximately twice as much per year than persons with less than secondary schooling.
Figure 3.
Adult income by educational attainment group (ages 25–59 years), Accra, Ghana. JCS; junior secondary school; SSS = senior secondary school.
It is worth highlighting that the income data collected were not directly comparable to asset-based rankings frequently used in household surveys according to the principal component method proposed by Filmer and Pritchett.15 Although income data collected as part of the TUHS project conceptually constitutes a measure of current income, household assets are a measure of accumulated wealth and thus more a measure of past or life-time earnings than a measure of concurrent income flows. As shown in Table 5, both measures are positively correlated as expected, but do not produce the same welfare ranking. Approximately 33% of persons with income below one dollar per day live in households that would be considered as very poor on the basis of their asset holdings (lowest asset quintile), and most persons with very low incomes actually would not be classified as poor on the basis of the observed asset ownership. A similar picture emerges at the opposite end of the income spectrum. Although 40% of persons with incomes higher than US$ 4 per day live in households in the top asset quintile, 13%, 16%, and 24% of persons live in households from the second, third, and fourth asset quintiles, respectively.
Table 5.
Income and asset quintiles in the study population, Accra, Ghana
| Income group | Average wealth quintile | Fraction of persons in wealth quintile | ||||
|---|---|---|---|---|---|---|
| Poorest | 2 | 3 | 4 | Richest | ||
| < $1/day | 2.51 | 0.33 | 0.19 | 0.19 | 0.21 | 0.08 |
| $1 to < $2 | 2.94 | 0.19 | 0.20 | 0.26 | 0.21 | 0.15 |
| $2 to < $4 | 3.17 | 0.11 | 0.24 | 0.22 | 0.20 | 0.22 |
| ≥ $4 | 3.75 | 0.07 | 0.13 | 0.16 | 0.24 | 0.40 |
Asset rankings are frequently used by researchers because such data are simpler and more straightforward to collect than income data. At the same time, such data may reflect longer-term financial status that could be associated with degenerative diseases. Conversely, current income is more closely associated with health outcomes because it will influence a person's ability to pay for health clinic services and/or for medications at the pharmacy. For this reason, we focus our analysis on the income rather than the data on assets from the TUHS because they represent a rare opportunity to understand the actual cash flow situation of households.
Chronic health by income group.
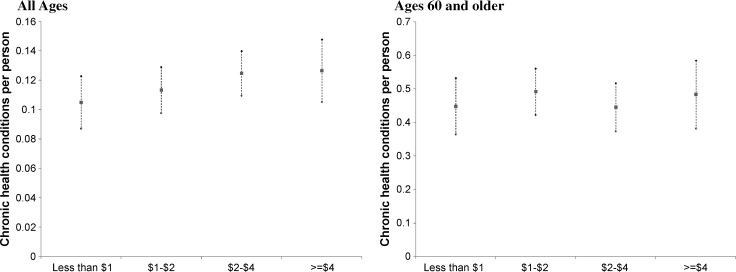
The prevalence of chronic health conditions by income group is shown in Figure 4. Overall, the income gradient was surprisingly weak. Persons with higher incomes reported more chronic health problems. This finding was observed for the pooled sample and the subset of household members more than 60 years of age.
Figure 4.
Proportions with chronic health conditions by income group, Accra, Ghana.
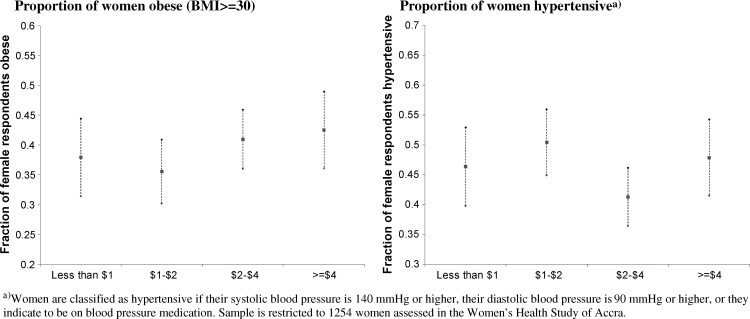
Results for hypertension and obesity among women participating in the WHSA are shown in Figure 5. Overall, obesity rates were remarkably high, and 39.2% of all women in the sample were classified as obese. The wealth gradient appears not to be steep, but wealthier women are on average marginally more likely to be obese than those with lower incomes (42.5% in the highest income group versus 38.0% and 35.6% in the poorest and second poorest groups). Hypertension is almost startlingly common among women in this sample, and 46.1% were classified as hypertensive. This finding is considerably higher than the figure reported for the United States, in which 29.8% of women ≥ 20 years of age are classified as hypertensive.16 No clear relationship between hypertension and income could be detected for women in the Accra sample (Figure 5).
Figure 5.
Proportions of women obese and hypertensive by income group, Accra, Ghana.
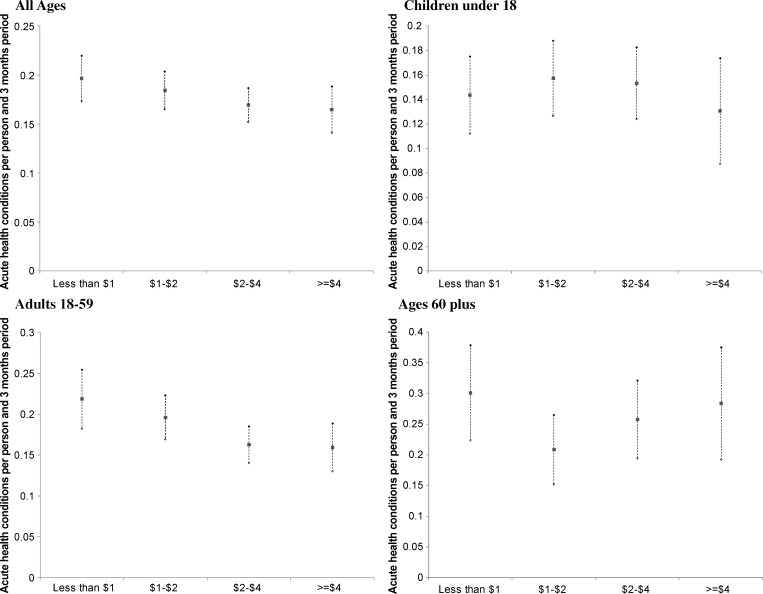
The relative risk of acute ill health by income and age group is shown in Figure 6. On average, 18% of persons reported a health problem over the three-month monitoring period. The rate was highest in persons ≥ 60 years of age (25.5% versus 15% in children < 18 years of age and 18% in adults 18–59 years of age). The overall picture is consistent with the results for chronic health conditions, with rather small, and not statistically significant, differences across socioeconomic groups.
Figure 6.
Proportions reporting acute health issues by income group, Accra, Ghana.
Treatment seeking.
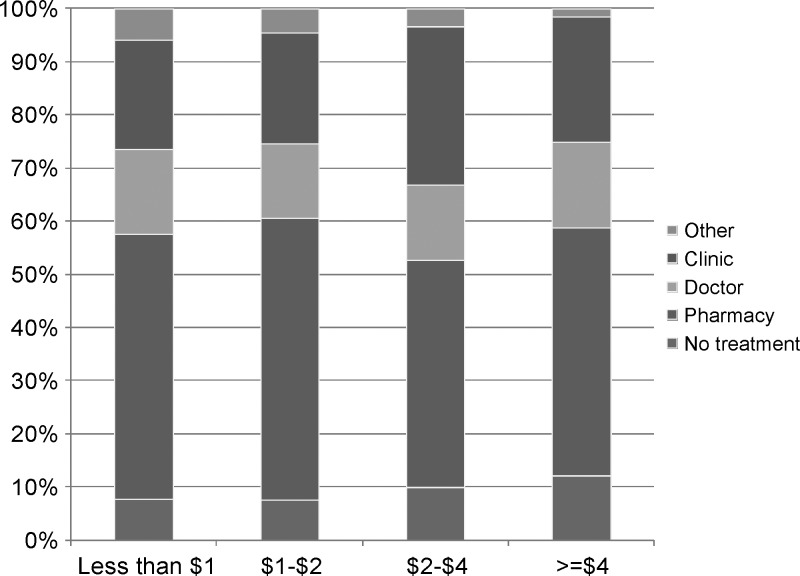
The relationship between income and treatment seeking is shown in Figure 7. Overall, there was remarkably little difference in treatment of acute health problems. On average, the highest income group was least likely to seek or receive treatment (12%), and the two poorest groups were more likely to be treated. Across all groups, the most common treatment locations were pharmacies, followed by clinics and private doctors. The only area where a social gradient was apparent is alternative (other) treatment, which comprises treatment through friends and traditional healers. Although 6% of the lowest income group relied on such treatment, less than 2% of the richest group relied on such treatment.
Figure 7.
Place of treatment of recent illnesses by income group, Accra, Ghana.
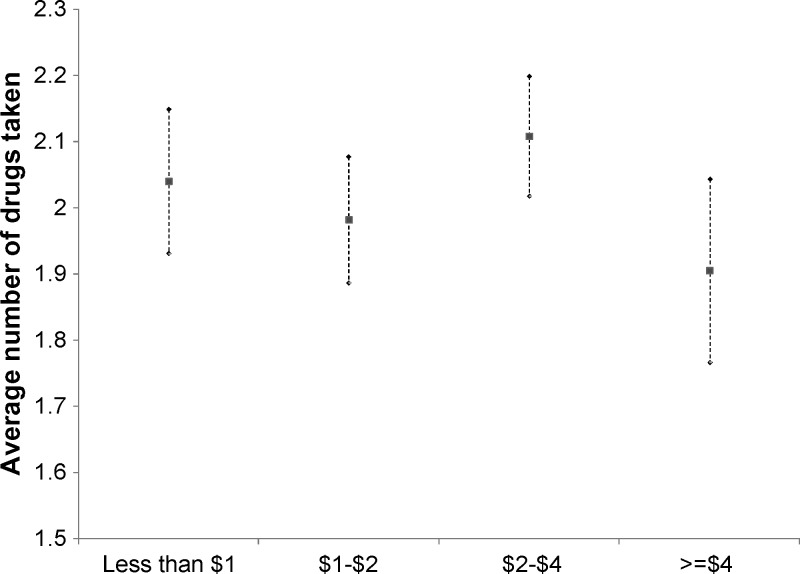
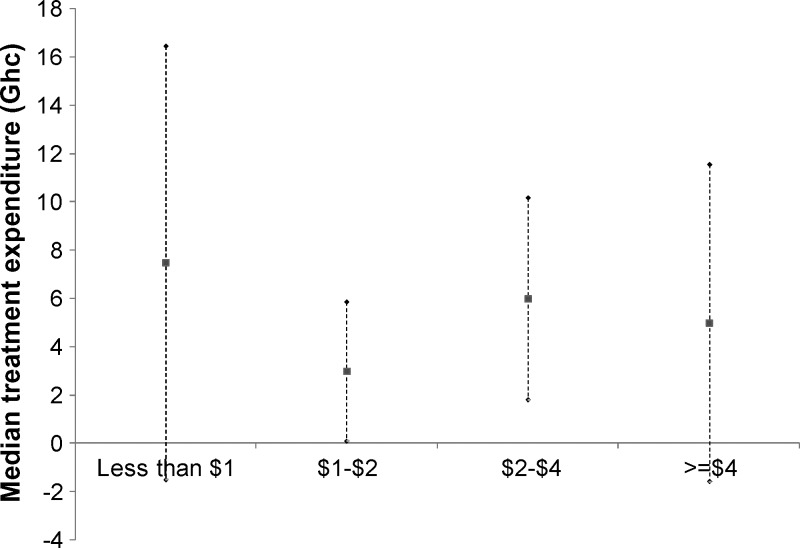
The relationship between income and the number of drugs taken per health problem as a second indicator of the average treatment received by patients is shown in Figure 8. On average, each patient used approximately two drugs per health issue, and there were no differences across income groups. The equality in treatment access was also apparent from the total treatment cost. The median expenditure per health problem was 5 Cedis, which translates to approximately US$3.3 at exchange rates current during the study. Although the mean expenditure was substantially higher (20 Cedis, US$13.3) no systematic differences across income groups emerged from the data (see Figure 9). With an average number of approximately one acute health problem requiring treatment per household per three-month-period, the average (mean) expected treatment cost per household per month is less than US$5.
Figure 8.
Number of drugs taken per episode of ill health, Accra, Ghana.
Figure 9.
Median expenditure per acute health condition reported, Accra, Ghana. Ghc = cedi.
Discussion
Our results suggest that there is a rather shallow gradient in health status by income level in Accra, possibly the result of the relatively flat distribution of income. Most of the respondents in our sample, which was designed to be representative of the city's female population and their households, have incomes that are quite low. Half of the respondents lived in households in which persons were living on less than $USD2 per day. Our results are consistent with an emerging literature suggesting that developing countries are now seeing different patterns in the health transition than were observed in the history of now developed nations.17 Although our differences in obesity are generally not statistically significant, they are consistent directionally with other literature suggesting that in the middle of the health transition, obesity may be higher among the economically better off because of traditionally positive associations between social status and body weight in developing countries.17–20 This finding recalls the pre-transition era in now developed nations when being obese was associated with being rich and being thin was associated with being poor.21 Similar patterns have also been observed among minority group members in the United States.22
Data from the 2008 Ghana Demographic and Health Survey show that among women 40–49 years of age, only 3% who were in the poorest quintile of wealth were obese, compared with 42% in the richest quintile, and there was a monotonic increase between those two extremes. However, because nearly half of the women in the country who were in richest quintile lived in the Greater Accra Region of Ghana, and virtually all women in that region were in the top two DHS wealth quintiles, the urban environment may confound the wealth calculations. The low level of income among our respondents in Accra was a reminder of overall high-risk levels throughout the country.
Similar to obesity, we also found a rather weak relationship between hypertension and income. This finding is not consistent with a recent study among civil servants in Accra, in which those of higher status had the highest levels of hypertension.23 However, that study used assets rather than income, and looked only at civil servants, who already represent a relatively privileged and small class of persons within Accra.
The rather weak relationship between income and acute health problems noted above suggests that on average, persons of all income groups face recurring health risks in the short term. It appears that malaria, diarrheal diseases, and respiratory infections are the most common causes of acute health problems and such conditions seem quite widely distributed in the study population. More remarkable is the low correlation between health at older ages (as measured by chronic health conditions) and income. In a setting where average incomes are low and at least part of the treatment cost has to be paid out-of-pocket, differential access to health care services may result in longer-term health differentials. However, this finding does not appear to be the case in Accra. All evidence presented suggests that treatment costs are low enough to make treatment accessible to households from all income groups in the area.
The most striking finding was that this urban population has high levels of potentially treatable illnesses. Although the relative levels of income in Accra do not explain much of the observed variability in obesity and hypertension, the high prevalence of chronic and infectious diseases in a population that is on average poor does not only highlight the emerging double burden of disease in developing countries,24 but is actually also consistent with the extraordinarily high prevalence of these diseases among the poorest population groups within developed countries, such as the United States.
Disclaimer: The content of this report is solely the responsibility of the authors and does not necessarily represent the official views of the National Institute of Child Health and Human Development or the National Institutes of Health.
Footnotes
Financial support: This study was supported in part by grant R01 HD054906 from the Eunice Kennedy Shriver National Institute of Child Health and Human Development (Health, Poverty and Place in Accra, Ghana, John R. Weeks, Project Director/Principal Investigator) and Hewlett/PRB (Reproductive and Overall Health Outcomes and Their Economic Consequences for Households in Accra, Ghana, Allan G. Hill, Project Director/Principal Investigator).
Authors' addresses: Günther Fink and Alan G. Hill, Harvard School of Public Health, Boston, MA, E-mails: gfink@hsph.harvard.edu and ahill@hsph.harvard.edu. John R. Weeks, Department of Geography, San Diego State University, San Diego, CA, E-mail: john.weeks@sdsu.edu.
References
- 1.Duda R, Darko R, Adanu R, Seffah J, Anarfi JK, Gautam S, Hill AG. HIV prevalence and risk factors in women of Accra, Ghana: results from the Women's Health Study of Accra. Am J Trop Med Hyg. 2005;73:63–66. [PubMed] [Google Scholar]
- 2.Duda RB, Chen GL, Hill AG, Adanu RM, Seffah J, Anarfi J. Screening for cervical cancer still not included as routine care for women. Int J Trop Med. 2005;1:1–6. [Google Scholar]
- 3.Duda RB, Kim MP, Darko R, Adanu RM, Seffah J, Anarfi JK, Hill AG. Prevalence of elevated blood pressure in women residing in Accra, Ghana: report from the Women's Health Survey of Accra. Int J Cardiol. 2006;108 (see appendix) [Google Scholar]
- 4.Hill AG, Darko R, Seffah J, Adanu RM, Anarfi J, Duda RB. Health of urban Ghanaian women as identified by the Women's Health Study of Accra. Int J Gynaecol Obstet. 2007;99:150–156. doi: 10.1016/j.ijgo.2007.05.024. [DOI] [PubMed] [Google Scholar]
- 5.Duda RB, Kim MP, Darko R, Adanu RM, Seffah J, Anarfi JK, Hill AG. Results of the Women' Health Study of Accra: assessment of blood pressure in urban women. Int J Cardiol. 2007;117:115–122. doi: 10.1016/j.ijcard.2006.05.004. [DOI] [PubMed] [Google Scholar]
- 6.Hill A, Douptcheva N. Final Report on the Women's Health Study of Accra, Wave 2 2008/2009. Accra, Ghana: ISSER, University of Ghana; 2011. [Google Scholar]
- 7.Hill AG, Douptcheva N. Links between the Urban Mortality and Health Transitions: A Case Study from Accra, Ghana. Organized by the IUSSP Scientific Panel on Historical Demography; Seville, Spain: 2011. Seminar on New Approaches to Death in Cities during the Health Transition. [Google Scholar]
- 8.Torpy JM, Lynm C, Glass RM. Poverty and health. JAMA. 2007;298:1968. doi: 10.1001/jama.298.16.1968. [DOI] [PubMed] [Google Scholar]
- 9.Parmley WW. Poverty and health. J Am Coll Cardiol Found. 2000;35:1359–1360. doi: 10.1016/s0735-1097(00)00604-5. [DOI] [PubMed] [Google Scholar]
- 10.Wagstaff A. Poverty and health sector inequalities. Bull World Health Organ. 2002;80:97–105. [PMC free article] [PubMed] [Google Scholar]
- 11.Montgomery M, Hewett PC. Urban poverty and health in developing countries: household and neighborhood effects. Demography. 2005;42:397–425. doi: 10.1353/dem.2005.0020. [DOI] [PubMed] [Google Scholar]
- 12.Debpuur C, Welaga P, Wak G, Hodgson A. Self-reported health and functional limitations among older people in the Kassena-Nankana District Ghana. Global Health Action Supplement. 2010;2:3. doi: 10.3402/gha.v3i0.2151. 2010 Sep 27. 10.3402/gha.v3i0.2151. [DOI] [PMC free article] [PubMed] [Google Scholar]
- 13.Patrinos HA, Psacharopoulos G. Returns to education in developing countries. In: Penelope P, Eva B, Barry M, editors. International Encyclopedia of Education. Oxford, UK: Elsevier; 2010. pp. 305–312. [Google Scholar]
- 14.Psacharopoulos G, Patrinos HA. Returns to Investment in Education: A Further Update. 2002. World Bank Policy Research Working Paper, 2881. [Google Scholar]
- 15.Filmer D, Pritchett LH. Estimating wealth effects without expenditure data—or tears: an application to educational enrollments in states of India. Demography. 2001;38:115–132. doi: 10.1353/dem.2001.0003. [DOI] [PubMed] [Google Scholar]
- 16.National Center for Health Statistics . Health, United States, 2010: With Special Feature on Death and Dying. Hyattsville, MD: US National Center for Health Statistics; 2011. [PubMed] [Google Scholar]
- 17.Subramanian S, Perkins J, Özaltin E, Davey Smith G. Weight of nations: a socioeconomic analysis of women in low- to middle-income countries. Am J Clin Nutr. 2011;93:413–421. doi: 10.3945/ajcn.110.004820. [DOI] [PMC free article] [PubMed] [Google Scholar]
- 18.Popkin BM, Gordon-Larsen P. The nutrition transition: worldwide obesity dynamics and their determinants. Int J Obes Relat Metab Disord. 2004;28:S2–S9. doi: 10.1038/sj.ijo.0802804. [DOI] [PubMed] [Google Scholar]
- 19.Popkin BM. The dynamics of the dietary transition in the developing world. In: Caballero B, Popkin BM, editors. The Nutrition Transition: Diet and Disease in the Developing World. San Diego, CA: Academic Press; 2002. pp. 147–164. [Google Scholar]
- 20.Sobal J, Stunkard AJ. Socioeconomic status and obesity: a review of the literature. Psychol Bull. 1989;105:260–275. doi: 10.1037/0033-2909.105.2.260. [DOI] [PubMed] [Google Scholar]
- 21.Caballero B. The global epidemic of obesity: an overview. Epidemiol Rev. 2007;29:1–5. doi: 10.1093/epirev/mxm012. [DOI] [PubMed] [Google Scholar]
- 22.Chang VW, Lauderdale DS. Income disparities in body mass index and obesity in the United States, 1971–2002. Arch Intern Med. 2005;165:2114–2120. doi: 10.1001/archinte.165.18.2122. [DOI] [PubMed] [Google Scholar]
- 23.Addo J, Smeeth L, Leon DA. Socioeconomic position and hypertension: a study of urban civil servants in Ghana. J Epidemiol Community Health. 2009;63:646–650. doi: 10.1136/jech.2008.081828. [DOI] [PubMed] [Google Scholar]
- 24.Marshall SJ. Developing countries face double burden of disease. Bull World Health Organ. 2004;82:556. [PMC free article] [PubMed] [Google Scholar]


