Abstract
Hainan Province is the main area threatened by malaria in China. However, the epidemiologic patterns of malaria in this region are not yet defined. In this study, we determined the spatio-temporal distribution and variation of Plasmodium falciparum and Plasmodium vivax malaria in Hainan during 1995–2008 by using wavelet and cluster quantitative approaches. The results indicated a decreasing secular trend and obvious seasonal fluctuation of malaria in Hainan. In addition, the characteristic annual peak of malaria could not be detected after 2005. The southcentral region of Hainan has remained an area of relatively high malaria risk, but the incidence of P. falciparum malaria increased significantly in the southeast and southwest regions during 2002–2008. These findings identify epidemic patterns of malaria in Hainan, and are applicable for designing an effective and dynamic public health campaign to combat malaria in this region.
Introduction
The mosquito-borne infectious disease malaria remains one of the most prevalent threats to human health worldwide. In 2009, global malaria rates exceeded 200 million cases and 780,000 deaths.1 Although nations in Africa account for most of these cases, other countries with tropical and subtropical climates represent areas of significant impact. In China, 14,098 malaria cases and 10 deaths were reported in 2009.2 Hainan Province on the southern coast of China is one of the country's two regions to which Plasmodium falciparum is endemic,3 and accounts for up to 46% of the annual endemic P. falciparum malaria cases over the past decade.4 As a result, Hainan has become the focus of recent national efforts towards malaria control and prevention. However, for these efforts to succeed, a detailed understanding of the epidemiologic features of malaria transmission in this region must be achieved.
Of the two species that infect humans in Hainan, P. vivax is the most prevalent, but P. falciparum is the most deadly. Both are transmitted by Anopheles species mosquitoes, P. falciparum by Anopheles dirus and P. vivax by An. minimus. Initial attempts to understand the general distribution of the malaria epidemic in Hainan considered P. falciparum and P. vivax malaria as a whole.5 However, distinct types of Plasmodium and infectious vectors of these species suggest that the spatio-temporal distribution of their related diseases may be not consistent. To design an effective public health campaign that will eradicate malaria in this region, a more detailed distribution analysis must be performed.
In the traditional method, periods or areas with high malaria risk are identified by observing the incidence time series data and subjectively interpreting the results. Wavelet analysis was developed to characterize non-stationary events in a time series,6 and non-stationary refers to the statistical properties of the data, such as mean, variance and covariance, which vary with time and are common in epidemiologic and environmental time series. Thus, wavelet analysis is capable of quantitatively analyzing the cyclical fluctuations of infectious diseases, and quantifying the main periodic component of a given time series and its time evolution. This approach was first applied to epidemiology to determine the benefit of measles immunization by exploring the cyclical fluctuation of the disease in London.7 Since then, wavelet analysis has been successfully used to generate time schedules for intervention measures and perform ongoing evaluations of control outcomes for various infectious diseases, including pertussis,8 malaria in Africa,9 and cutaneous leishmaniasis.10 In this study, the wavelet analysis approach was applied to the P. falciparum and P. vivax malaria time series for Hainan Province to detect its cyclical fluctuations.
Many studies have explored the distribution of malaria in different areas of the world. The worldwide distribution of P. falciparum malaria is of particular interest to global organizations and aims to understand transmission patterns and healthcare beyond political and national borders.11,12 Focused analysis to determine spatial distribution of malaria in specific regions, such as in the western Kenya highlands,13 is carried out to target populations that are most affected and contribute significantly to the global problem. Studies in high-risk malaria provinces in China14–17 have provided scientific basis for malaria control and prevention in these areas.
The highest malaria incidences in Hainan during the 1995–2008 epidemics were found in the southcentral counties of the province.5,18 However, the microepidemiology and variations of P. falciparum and P. vivax malaria in these regions are not known. Cluster analysis is commonly used to identify geographic distributions of disease and evaluate the statistical differences between regions and monitor variations over time or due to interventions.16,19,20 The dynamic scanning window make the clusters flexible enough to detect periods and areas with high risk by using a likelihood ratio test, and classify them according to the risk level. In this study, temporal and spatial cluster analysis was used to explore the distribution and variation of areas with high risk of P. falciparum and P. vivax malaria in Hainan.
The principal aim of this study was to gain a clear understanding of the epidemiologic characteristics of malaria in Hainan Province in China. This study will provide a scientific basis for analyzing epidemic pattern of infectious diseases quantitatively, and for the targeted control and prevention of malaria in Hainan, guiding public health resource allocation to key areas and times during outbreaks of the different kinds of malaria.
Materials and Methods
Study area.
The study area was the main island of Hainan Province (18°10′–20°10′ N, 108°37′–111°03′ E), which has a tropical monsoon and tropical marine climate . The region has an area of 339,000 km2 and a population of 8.26 million. The landscape is mainly mountainous and hilly.
Data collection and management.
Malaria is a notifiable disease in China. Monthly records of P. falciparum and P. vivax malaria cases were obtained from the Hainan Center for Disease Control and Prevention. The malaria cases used in this study, including microscopy-confirmed cases and suspected cases that had responded to malaria drugs, were diagnosed in the medical and health units of each county and reported to the Hainan Center for Disease Control and Prevention through the Reporting System of Communicable Diseases and Unexpected Public Health Events. The annual populations of each county during 1995–2008 were derived from the Hainan statistical yearbooks compiled by the Hainan Provincial Bureau of Statistics. Population data were estimated by using the annual records of household registration maintained by the local police departments. The incidences of P. falciparum and P. vivax malaria for each county were geo-coded and matched to a corresponding polygon on a digital map of Hainan.
Secular trend analysis.
The P. falciparum and P. vivax malaria incidences during 1995–2008 in Hainan were calculated and plotted by year to show annual fluctuations. The Cochran-Armitage trend test was used to examine the temporal trends in the annual incidence of these two types of malaria. The index Z > 0 denotes an increasing trend of annual malaria incidence, and Z < 0 denotes a decreasing trend. The trend was considered significant when P was < 0.05.
Seasonal fluctuation analysis.
The incidences and seasonal indexes of each month during 1995–2008 were calculated to observe the seasonal fluctuations of these two types of malaria epidemic. The expression of seasonal index was made according to the equations:
where
The term Sk denotes the seasonal indexes in month k, where  . The terms
  ,
,  , and
, and  represent the mean incidence in month k, the mean incidence during the entire study period, and the incidence in year i month k, respectively. The parameter n denotes the total number of years, which was 14 in the study. No obvious seasonal fluctuation was expected if all the seasonal indexes in each month were close to 1.
Cyclical fluctuation analysis.
Wavelet analysis was used to detect the cyclical fluctuations of the P. falciparum and P. vivax malaria epidemics. The Morlet wavelet was taken as basis function for wavelet transforms because it is able to decompose a signal using functions that narrow when high-frequency features are present and widen with low-frequency structures.21 The series of P. falciparum and P. vivax malaria cases were first filtered and then normalized. The local wavelet power spectrum (LWPS) was obtained by computing wavelet transforms and was subsequently color-coded from blue to red to denote increasing power. The global wavelet spectrum was estimated by averaging the LWPS across time, and the lower limit of significance was denoted by a dotted line. This analysis was performed by using Matlab 7.0 (www.mathworks.com/products/matlab/).
Spatial distribution analysis.
Counties in Hainan were divided into four regions according to P. falciparum malaria incidence and into six regions according to P. vivax malaria incidence to show the different levels of malaria incidence. The annual P. falciparum and P. vivax malaria incidences in each county were mapped during 1995–2008, respectively. Each incidence region was denoted by a different color on the county-level digital map.
Spatio-temporal cluster analysis.
Cluster analysis was used to detect and evaluate malaria epidemic clusters in a temporal or spatial setting quantitatively by using spatial scan statistics detailed by Kulldorff22 to avoid the annual adjustment of key areas for malaria control and prevention according to the incidence map. The procedure involves gradual scanning of a data window across time or space, and noting the number of observed and expected observations inside the window at each location. For each scanning window of varying position and size, the risk of malaria within and outside the window was tested by likelihood ratio test using likelihood ratio (LLR), and the null hypothesis equaled risk. The expression of LLR was made according to the equation:
where C is the total number of cases, c is the observed number of cases within the window, and E(c) is the covariate adjusted expected number of cases within the window under the null hypothesis. I() is an indicator function, which is equal to 1 when the window has more cases than expected under the null hypothesis, and 0 otherwise. The window having the maximum LLR was indicative of the most likely cluster and considered the area with the highest malaria risk. The window with the next to maximum LLR (the secondary likely cluster) was considered the area with the second highest malaria risk.23 The relative risk of malaria within and outside the window was calculated to evaluate the degree of malaria risk.24
In this study, temporal cluster analyses of P. falciparum and P. vivax malaria epidemic during 1995–2008 were performed to detect the periods of high malaria risk, respectively. To analyze the variation of areas with relatively high malaria risk, the period from 1995 through 2008 was divided into several stages according to the results of temporal cluster analyses. Next, spatial cluster analyses of the malaria epidemics occurring within each stage were conducted to detect the distribution and variation of areas with relatively high risk of P. falciparum and P. vivax malaria in Hainan. Annual incidence data was used for the above analysis. A maximum cluster size of 30% of the study period was specified in the temporal cluster analysis. In the spatial cluster analyses, 25% of the population was specified for P. falciparum and P. vivax malaria epidemic respectively. This analysis was performed by using SatScan version 7.0.3 (www.satscan.org/cgi-bin/satscan/register.pl/SaTScan%20User%20Guide?todo=process_version_history_download).
Results
Secular trend of the P. falciparum and P. vivax malaria epidemic.
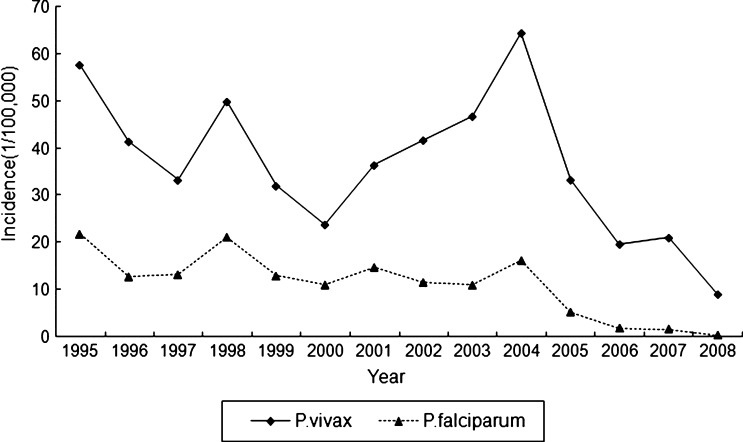
There were 11,712 P. falciparum malaria cases and 39,014 P. vivax malaria cases reported in Hainan during 1995–2008, the ratio of P. falciparum malaria cases to P. vivax malaria cases was 0.30. The annual incidences of P. falciparum and P. vivax malaria in Hainan showed a clear year-to-year variation during 1995–2008. The highest incidence of P. falciparum malaria occurred in 1995 (21.87/100,000), and that of P. vivax malaria occurred in 2004 (64.38/100,000). A fluctuating but distinctly decreasing trend of annual malaria incidence was identified for the study years (P. falciparum malaria: Z = –54.62, P < 0.01, by Cochran-Armitage trend test; P. vivax malaria: Z = –43.12, P < 0.01, by Cochran-Armitage trend test) (Figure 1).
Figure 1.
Annual incidence of Plasmodium falciparum and Plasmodium vivax malaria in Hainan, China, 1995–2008. The highest incidence of P. falciparum malaria was 21.87 cases/100,000 in 1995, and that of P. vivax malaria was 64.38 cases/100,000 in 2004. A fluctuating but distinctly decreasing temporal trend of these two types of malaria was identified.
Seasonal index of the P. falciparum and P. vivax malaria epidemic.
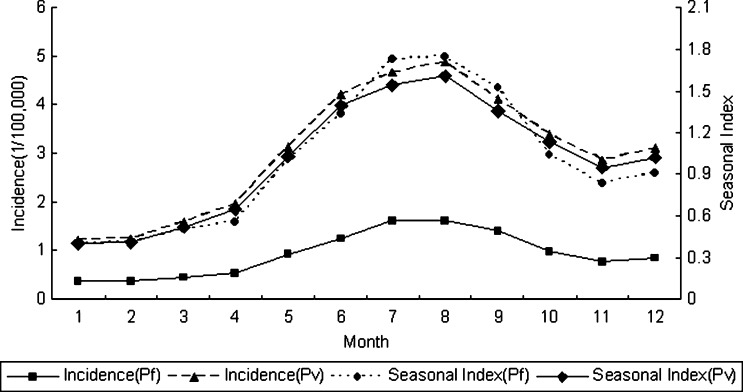
Relatively high malaria incidence was observed during May–October, during which 69.8% of P. falciparum malaria cases and 67.0% of P. vivax malaria cases were reported. The cumulative monthly incidence of these two types of malaria reached their peaks in August (P. falciparum malaria, 16.20/100,000; P. vivax malaria, 48.78/100,000). The highest seasonal index was 1.75 for P. falciparum malaria and 1.61 for P. vivax malaria, and the lowest was 0.40 for both types of malaria (Figure 2).
Figure 2.
Seasonal index and monthly incidence of Plasmodium falciparum and Plasmodium vivax malaria in Hainan, China, 1995–2008. Relatively high malaria incidence was observed during May–October, during which 69.8% of P. falciparum malaria cases and 67.0% of P. vivax malaria cases were reported. The cumulative monthly incidence of these two types of malaria reached their peaks in August (P. falciparum malaria, 16.20/100,000; P. vivax malaria, 48.78/100,000). The highest seasonal index was 1.75 for P. falciparum malaria and 1.61 for P. vivax malaria, and the lowest was 0.40 for both types of malaria.
Cyclical fluctuation of the P. falciparum and P. vivax malaria epidemic.
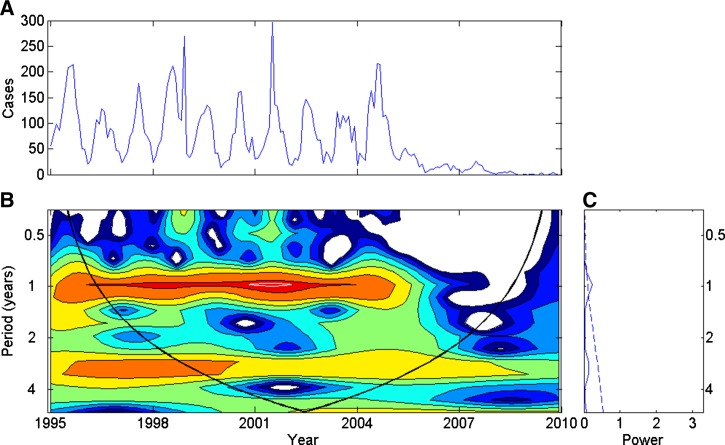
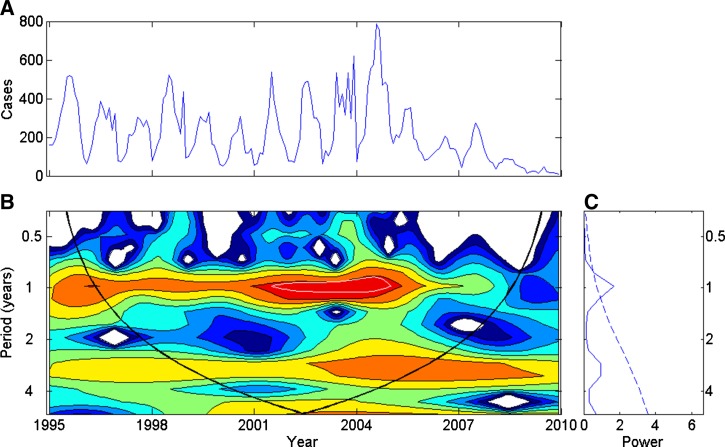
The time series of monthly P. falciparum and P. vivax malaria cases in Hainan during 1995–2008 generated a peak in power around one year before 2005, which was pronounced during 2001–2003 for P. falciparum malaria and during 2002–2005 for P. vivax malaria. The annual summer peak was less distinct after 2006, as shown by the wavelet figures. In addition, although not significant, peaks in power were detected at approximately three years during 1998–2006 in these two types of malaria time series (Figures 3 and 4).
Figure 3.
Wavelet time series analysis for the monthly Plasmodium falciparum malaria cases time series, Hainan, China, 1995–2008. A, Time series. B, Local wavelet power spectrum (LWPS). Blue to red color-coding indicates increasing power. The white line in LWPS corresponds to the 5% significance level. The area encompassed by the white line indicates that the annual peak was pronounced during 2001–2003. A relatively strong, but not significant, periodicity was detected in the area with red or orange color, but which was not encompassed by the white line; note the annual peak before 2005 and the three-year periodicity during 1998–2006. The trend of periodicity could be analyzed according to the color of the LWPS, but it was determined to not reach statistical significance. The superimposed parabola indicates the cone of influence, measuring the extent of edge effects. C, Global wavelet spectrum, which is analogous to the traditional Fourier spectrum. The peaks of power around one year and three years can be observed.
Figure 4.
Wavelet time series analysis for the monthly Plasmodium vivax malaria case time series, Hainan, China, 1995–2008. A, Time series. B, Local wavelet power spectrum (LWPS). Blue to red color-coding indicates increasing power. The white line in LWPS corresponds to the 5% significance level. The area encompassed by the white line indicates that the annual peak was pronounced during 2002–2005. A relatively strong, but not significant, periodicity was detected in the area with red or orange color, but which was not encompassed by the white line; note the annual peak before 2005 and the three-year periodicity during 1998–2006. The trend of periodicity could be analyzed according to the color of the LWPS, but it was determined to not reach statistical significance. The superimposed parabola indicates the cone of influence, measuring the extent of edge effects. C, Global wavelet spectrum, which is analogous to the traditional Fourier spectrum. The peaks of power around one year and three years can be observed.
Spatial distribution of annual P. falciparum and P. vivax malaria incidence.
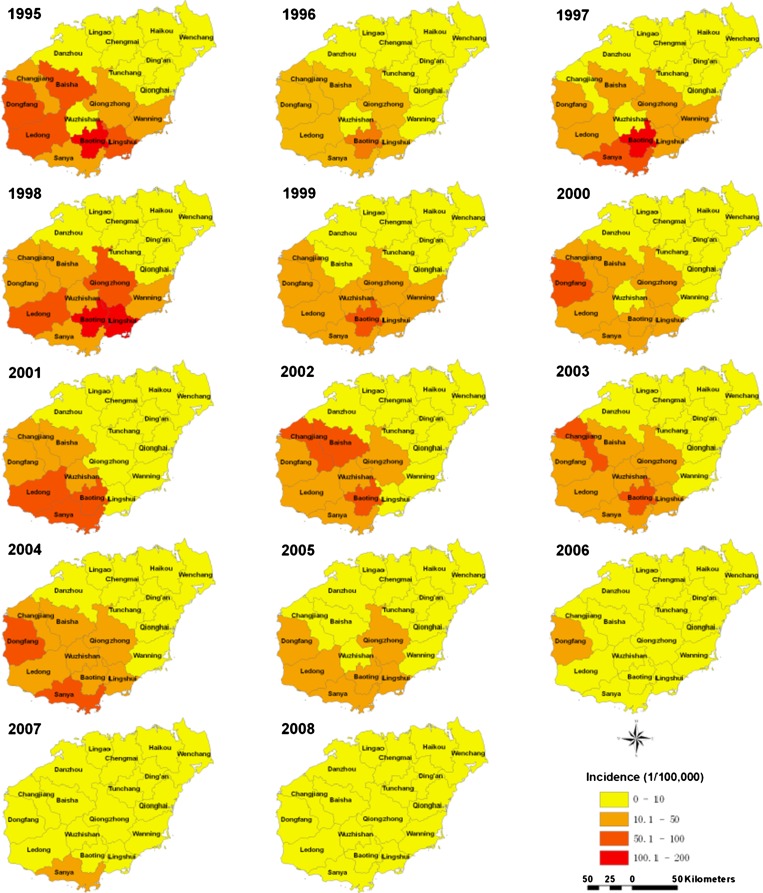
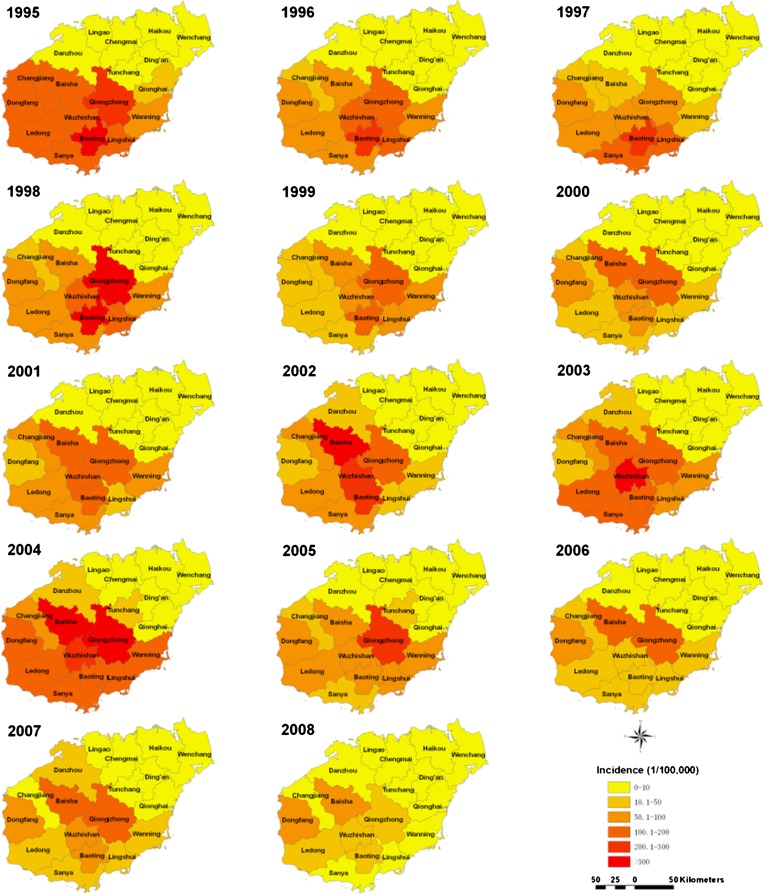
Plasmodium falciparum and P. vivax malaria were reported in all counties of Hainan during the epidemic period of 1995–2008. The highest incidences of these two types of malaria mainly occurred in the southern counties of the province. The county with the highest incidence was not consistent year to year (Figures 5 and 6). The overall highest incidence of P. falciparum malaria occurred in 1995 in Baoting County (193.42/100,000), and that of P. vivax malaria occurred in 1998 in Baoting County (415.82/100,000). Plasmodium falciparum malaria incidence in all counties decreased to less than 10 cases per 100,000 in 2008.
Figure 5.
Annual incidence of Plasmodium falciparum malaria at the county level in Hainan, China, 1995–2008. The county with the highest incidence changed from year to year. The highest incidence was 193.42 cases per 100,000 in Baoting in 1995.
Figure 6.
Annual incidence of Plasmodium vivax malaria at the county level in Hainan, China, 1995–2008. The county with the highest incidence changed from year to year. The highest incidence was 415.82 cases/100,000 in Baoting in 1998.
Temporal clusters of the P. falciparum and P. vivax malaria epidemic.
The most likely temporal cluster of P. falciparum malaria epidemic during 1995–2008 occurred within a window encompassing 1995–1998 (relative risk [RR] = 2.04, P < 0.01), and that of P. vivax malaria epidemic encompassed 2002–2004 (RR = 1.61, P < 0.01). Therefore, the entire period for each malaria type was subdivided for further spatial cluster analysis; P. falciparum malaria was divided into 1995–1998 and 1999–2008, and P. vivax malaria was divided into 1995–2001, 2002–2004, and 2005–2008.
Spatial clusters of the P. falciparum and P. vivax malaria epidemic.
The spatial cluster analysis of P. falciparum malaria epidemic during 1995-1998 showed that seven counties constituted the most likely cluster (average incidence = 52.19/100,000; RR = 9.58, P < 0.01) (Figure 7). During 1999–2008, eight counties made up the most likely cluster (average incidence = 25.38/100,000: RR = 14.27, P < 0.01) and two counties composed the secondary likely cluster (average incidence = 9.53/100,000; RR = 1.14, P < 0.01) (Figure 7).
Figure 7.
Spatial distribution of clusters of Plasmodium falciparum malaria with high risk in Hainan, China, 1995–2008. The risk of malaria was ordered by using the likelihood ratio. The most likely cluster indicates the area with the highest malaria risk, and the secondary likely cluster indicates the area with the second highest malaria risk.
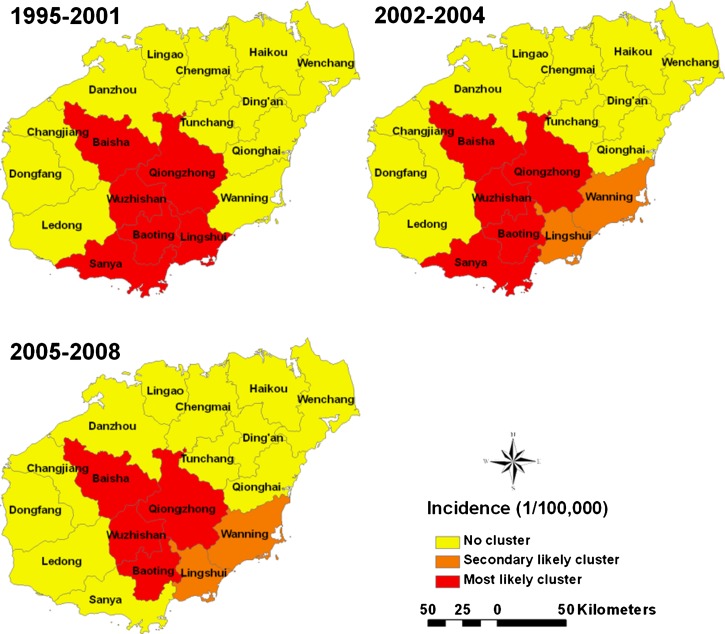
Spatial cluster analysis of P. vivax malaria epidemic during 1995–2001 showed that six counties constituted the most likely cluster (average incidence = 145.49/100,000; RR = 6.63, P < 0.01) (Figure 8). During 2002–2004, five counties made up the most likely cluster (average incidence = 186.62/100,000; RR = 6.70, P < 0.01) and two counties composed the secondary likely cluster (average incidence = 67.06/100,000; RR = 1.37, P < 0.01) (Figure 8). Analysis for the period 2005–2008 showed that four counties made up the most likely cluster (average incidence = 124.91/100,000; RR = 6.51, P < 0.01) and two counties composed the secondary likely cluster (average incidence = 47.19/100,000; RR = 1.87, P < 0.01) (Figure 8).
Figure 8.
Spatial distribution of clusters of Plasmodium vivax malaria with high risk in Hainan, China, 1995–2008. The risk of malaria was ordered by using the likelihood ratio. The most likely cluster indicates the area with the highest malaria risk, and the secondary likely cluster indicates the area with the second highest malaria risk.
Discussion
Wavelet analysis is a powerful statistical method for detecting cyclical fluctuations across a time period. Compared with the conventional method that analyzes cyclical fluctuations of an infectious disease epidemic by observing the incidence time series, wavelet analysis can provide more reliable and accurate information on the cyclical fluctuations of an infectious disease epidemic. Therefore, wavelet analysis was applied to explore the cyclical fluctuations of two types of malaria in Hainan, China. During 1995–2008, annual incidence rates were consistently higher during May–October. Furthermore, a characteristic peak occurred each year for each of the two malaria types. However, this peak was cannot be detected over time after 2003 for P. falciparum malaria and after 2005 for P. vivax malaria. This finding indicated that the seasonal fluctuation of these two types of malaria epidemic gradually weakened over the recent years. Therefore, malaria epidemics are as likely to occur during November–April as during other months, and health facilities should be aware of this finding.
The annual incidence of P. falciparum and P. vivax malaria showed a fluctuating but distinctly decreasing temporal trend, which was consistent with the secular trend of malaria epidemic in Hainan.5 Some researchers have suggested that fluctuations in secular trend and periodicity of infectious disease are closely related to changes in intervention measures.7,25 It is interesting to consider that the Global Fund Program on Malaria was implemented in Hainan in 2003. This program provides treatment and prevention measures, including standard early treatment of current infections, mass drug prophylaxis, and insecticide impregnating of bed nets, and is conducted in 10 counties of Hainan.26 Because of this program, more than 90% of infected persons have received standard early treatment, ≈70% of infected persons received free prophylactic treatment, and the number of impregnated bed nets reached 10,386, all of which effectively reduced the possibility of future outbreaks of malaria in Hainan. Therefore, the number of malaria cases and the difference in number of cases of each month may be decreased. That may also be a reason for weakened seasonal fluctuation of these two types of malaria epidemic during recent years. It is likely that the recent fluctuation of malaria epidemic in Hainan reflects the successful campaign to combat the disease and its causative agent.
Nonetheless, malaria is not yet eradicated in the Hainan Province. It is necessary to take advantage of the downward trend in malaria cases and modify eradication efforts to allocate existing public health resources to the counties that remain most affected. This study showed that the county in Hainan with the highest P. falciparum and P. vivax malaria incidence was not consistent. If such analysis was conducted on an ongoing basis, a real-time picture of the epidemiologic status of malaria in Hainan might be captured. Thus, the program of eradication can be continually modified to match the dynamic needs of the region.
This study also showed that the area with a relatively high risk of P. falciparum and P. vivax malaria fluctuated over time but remained centered in southcentral Hainan, including Baoting, Wuzhishan, Qiongzhong and Baisha, which are located in mountain areas and have relatively low-level medical services. Many persons in this region perform farm work in a mountainous environment, which increases their opportunity of exposure to mosquitoes. This finding indicates the need to focus malaria control and prevention in southcentral Hainan. However, the differential status of the two malaria types through these regions suggests that monitoring should be dynamic through the southcentral region. Plasmodium falciparum malaria incidence rates increased in the southeastern and southwestern regions during 1999–2008, and malaria incidence rates for P. vivax malaria increased in southeastern Hainan during 2002–2008. Implementation of a continuous and dynamic strategy could make public health resource allocation more cost-effective and beneficial. Moreover, this strategy should also be extended to other high malaria risk provinces in China, such as Anhui Province.16,17
It is important to note that unlike the extent of periodicity characteristically seen in other studies of infectious disease epidemics, this study showed that the annual peak of the two types of malaria in Hainan disappeared in recent years. This finding may have resulted from the study period being too short to facilitate accurate observations of a relatively long remarkable periodicity of malaria in Hainan. Because minimal relevant data are available from the Hainan regions for years before the 1990s, further study using future data of malaria epidemics will help to provide more insights into the epidemiology of malaria in Hainan. In addition, the case reporting data used in this study may not include all malaria cases in Hainan; it is well recognized that case reporting data is rarely absolute in any country. Many factors, such as testing technique, inspection apparatus, and technical standard of medical personnel, may have influenced the data reported. Finally, it is possible that there may have been a relative increase in case reporting after the Global Fund supported program was instituted.
In summary, this study showed that the annual incidence of P. falciparum and P. vivax malaria decreased during 1995–2008. The epidemiology of these two malaria types was remarkably dynamic; the characteristic annual peaks of P. falciparum and P. vivax malaria incidence could not be detected after 2005, and geographic areas with relatively high risk of P. falciparum and P. vivax malaria changed year to year. These results identified the current epidemiologic features of the two types of malaria in Hainan, and will provide a basis by which public health resource allocation may be maximized to combat malaria in this province.
Footnotes
Financial support: This study was supported by National Special Grant for Prevention and Treatment of Infectious Diseases, China (2008ZX10004-012) and the Program for Changjiang Scholars and Innovative Research Team in University (PCSIRT).
Authors' addresses: Dan Xiao, Yong Long, Kejian Wu, Dezhong Xu, Haitao Li, and Yongping Yan, No. 169, Changle West Road, Xi'an, Shannxi, China, E-mails: danxiao@fmmu.edu.cn, longyong@fmmu.edu.cn, octopuspie@126.com, xudezh69@163.com, haitaoli@fmmu.edu.cn, and yanyping@fmmu.edu.cn. Shanqing Wang and Guangze Wang, 44 Haifu Road, Haikou, China, E-mails: wangsqkevin@163.com and wangguangze63@126.com.
References
- 1.World Health Organization World Malaria Report 2010. 2010. http://www.who.int/malaria/publications/atoz/9789241564106/en/ Available at. Accessed July 1, 2011.
- 2.Ministry of Health of the People's Republic of China Chinese Health Statistics Yearbook 2010. 2010. http://www.moh.gov.cn/publicfiles/business/htmlfiles/zwgkzt/ptjnj/year2010/index2010.html Available at. Accessed October 1, 2011.
- 3.Lin H, Lu L, Tian L, Zhou S, Wu H, Bi Y, Ho S, Liu Q. Spatial and temporal distribution of falciparum malaria in China. Malar J. 2009;8:130. doi: 10.1186/1475-2875-8-130. [DOI] [PMC free article] [PubMed] [Google Scholar]
- 4.Zhou S, Tang L, Sheng H, Wang Y. Malaria situation in the People's Republic of China in 2004. Zhong Guo Ji Sheng Chong Xue Yu Ji Sheng Chong Bing Za Zhi. 2006;24:1–3. [PubMed] [Google Scholar]
- 5.Xiao D, Long Y, Wang S, Fang L, Xu D, Wang G, Li L, Cao W, Yan Y. Spatiotemporal distribution of malaria and the association between its epidemic and climate factors in Hainan, China. Malar J. 2010;9:185. doi: 10.1186/1475-2875-9-185. [DOI] [PMC free article] [PubMed] [Google Scholar]
- 6.Cazelles B, Chavez M, Magny GC, Guegan JF, Hales S. Time-dependent spectral analysis of epidemiological time-series with wavelets. J R Soc Interface. 2007;4:625–636. doi: 10.1098/rsif.2007.0212. [DOI] [PMC free article] [PubMed] [Google Scholar]
- 7.Grenfell BT, Bjornstad ON, Kappey J. Travelling waves and spatial hierarchies in measles epidemics. Nature. 2001;414:716–723. doi: 10.1038/414716a. [DOI] [PubMed] [Google Scholar]
- 8.Broutin H, Guegan J, Elguero E, Simondon F, Cazelles B. Large-scale comparative analysis of pertussis population dynamics: periodicity, synchrony, and impact of vaccination. Am J Epidemiol. 2005;161:1159–1167. doi: 10.1093/aje/kwi141. [DOI] [PubMed] [Google Scholar]
- 9.Pascual M, Cazelles B, Bouma MJ, Chaves LF, Koelle K. Shifting patterns: malaria dynamics and rainfall variability in an African highland. Proc Biol Sci. 2008;275:123–132. doi: 10.1098/rspb.2007.1068. [DOI] [PMC free article] [PubMed] [Google Scholar]
- 10.Chaves LF, Pascual M. Climate cycles and forecasts of cutaneous leishmaniasis, a nonstationary vector-borne disease. PLoS Med. 2006;3:1320–1328. doi: 10.1371/journal.pmed.0030295. [DOI] [PMC free article] [PubMed] [Google Scholar]
- 11.Snow RW, Guerra CA, Noor AM, Myint HY, Hay SI. The global distribution of clinical episodes of Plasmodium falciparum malaria. Nature. 2005;434:214–217. doi: 10.1038/nature03342. [DOI] [PMC free article] [PubMed] [Google Scholar]
- 12.Hay SI, Guerra CA, Gething PW, Patil AP, Tatem AJ, Noor AM, Kabaria GW, Manh BH, Elyazar IRF, Brooker S, Smith DL, Moyeed RA, Snow RW. A world malaria map: Plasmodium falciparum endemicity in 2007. PLoS Med. 2009;6:286–302. doi: 10.1371/journal.pmed.1000048. [DOI] [PMC free article] [PubMed] [Google Scholar]
- 13.Munyekenye OG, Githeko AK, Zhou G, Mushinzimana E, Minakawa N, Yan G. Plasmodium falciparum spatial analysis, western Kenya highlands. Emerg Infect Dis. 2005;11:1571–1577. doi: 10.3201/eid1110.050106. [DOI] [PMC free article] [PubMed] [Google Scholar]
- 14.Hui FM, Xu B, Chen ZW, Cheng X, Liang L, Huang HB, Fang LQ, Yang H, Zhou HN, Yang HL, Zhou XN, Cao WC, Gong P. Spatio-temporal distribution of malaria in Yunnan Province, China. Am J Trop Med Hyg. 2009;81:503–509. [PubMed] [Google Scholar]
- 15.Clements AC, Barnett AG, Cheng ZW, Snow RW, Zhou HN. Space-time variation of malaria incidence in Yunnan Province, China. Malar J. 2009;8:180. doi: 10.1186/1475-2875-8-180. [DOI] [PMC free article] [PubMed] [Google Scholar]
- 16.Zhang W, Wang L, Fang L, Ma J, Xu Y, Jiang J, Hui F, Wang J, Liang S, Yang H, Cao W. Spatial analysis of malaria in Anhui Province, China. Malar J. 2008;7:206. doi: 10.1186/1475-2875-7-206. [DOI] [PMC free article] [PubMed] [Google Scholar]
- 17.Wang LP, Xu YF, Wang JJ, Xu X, Zhang WY, Fang LQ, Ma JQ, Cao WC, Jin SG. Spatial-temporal analysis on the distribution of malaria in Anhui, 1990–2006. Ji Bing Kong Zhi Za Zhi. 2008;12:156–159. [Google Scholar]
- 18.Wen L, Xu DZ, Wang SQ, Li CX, Zhang ZY, Su YQ. Epidemic of malaria in Hainan Province and modeling malaria incidence with meteorological parameters. Ji Bing Kong Zhi Za Zhi. 2003;7:520–524. [Google Scholar]
- 19.Fang L, Yan L, Liang S, de Vlas SJ, Feng D, Han X, Zhao W, Xu B, Bian L, Yang H, Gong P, Richardus JH, Cao W. Spatial analysis of hemorrhagic fever with renal syndrome in China. BMC Infect Dis. 2006;6:77. doi: 10.1186/1471-2334-6-77. [DOI] [PMC free article] [PubMed] [Google Scholar]
- 20.Kulldorff M, Feuer EJ, Miller BA, Freedman LS. Breast cancer clusters in the northeast United States: a geographic analysis. Am J Epidemiol. 1997;146:161–170. doi: 10.1093/oxfordjournals.aje.a009247. [DOI] [PubMed] [Google Scholar]
- 21.Daubechies I. Ten Lectures on Wavelets. Philadelphia, PA: Society for Industrial and Applied Mathematics; 1992. pp. 1–16. Series in Applied Mathematics Monographs. [Google Scholar]
- 22.Kulldorff M. A spatial scan statistic. Comm Statist Theory Methods. 1997;26:1481–1496. [Google Scholar]
- 23.Kulldorff M. SatScan User Guide for Version 7.0. 2006. http://www.satscan.org/ Available at. Accessed March 9, 2010.
- 24.Chaput EK, Meek JI, Heimer R. Spatial analysis of human granulocytic ehrlichiosis near Lyme, Connecticut. Emerg Infect Dis. 2002;8:943–948. doi: 10.3201/eid0809.020103. [DOI] [PMC free article] [PubMed] [Google Scholar]
- 25.Pitzer VE, Viboud C, Simonsen L, Steiner C, Panozzo CA, Alonso WJ, Miller MA, Glass RI, Glasser JW, Parashar UD, Grenfell BT. Demographic variability, vaccination, and the spatiotemporal dynamics of rotavirus epidemics. Science. 2009;325:290–294. doi: 10.1126/science.1172330. [DOI] [PMC free article] [PubMed] [Google Scholar]
- 26.Wang S. Evaluation of feasibility in elimination of Plasmodium falciparum malaria in Hainan Province. Zhong Guo Re Dai Yi Xue. 2005;5:1779–1781. [Google Scholar]


