Abstract
Background
Existing methods for estimation of mortality attributable to influenza are limited by methodological and data uncertainty. We have used proxies for disease incidence of the three influenza co-circulating subtypes (A/H3N2, A/H1N1 and B) that combine data on influenza-like illness consultations and respiratory specimen testing to estimate influenza-associated mortality in the US between 1997 and 2007.
Methods
Weekly mortality rate for several mortality causes potentially affected by influenza was regressed linearly against subtype-specific influenza incidence proxies, adjusting for temporal trend and seasonal baseline, modeled by periodic cubic splines.
Results
Average annual influenza-associated mortality rates per 100,000 individuals were estimated for the following underlying causes of death: for pneumonia and influenza, 1.73 (95% confidence interval= 1.53 to 1.93); for chronic lower respiratory disease, 1.70 (1.48 to 1.93); for all respiratory causes, 3.58 (3.04 to 4.14); for myocardial infarctions, 1.02 (0.85 to 1.2); for ischemic heart disease, 2.7 (2.23 to 3.16); for heart disease, 3.82 (3.21 to 4.4); for cerebrovascular deaths, 0.65 (0.51 to 0.78); for all circulatory causes, 4.6 (3.79 to 5.39); for cancer, 0.87 (0.68 to 1.05); for diabetes, 0.33 (0.26 to 0.39); for renal disease, 0.19 (0.14 to 0.24); for Alzheimer disease, 0.41 (0.3 to 0.52); and for all causes, 11.92 (10.17 to 13.67). For several underlying causes of death, baseline mortality rates changed after the introduction of the pneumococcal conjugate vaccine.
Conclusions
The proposed methodology establishes a linear relation between influenza incidence proxies and excess mortality, rendering temporally consistent model fits, and allowing for the assessment of related epidemiologic phenomena such as changes in mortality baselines.
Estimation of the mortality burden associated with influenza relies on statistical association rather than on direct measurement of laboratory-confirmed deaths, both because it is expensive and clinically unnecessary to test all patients with respiratory symptoms, and because many sequelae of influenza that may lead to mortality (e.g. bacterial pneumonia) may be diagnosed only after influenza virus has become undetectable in the host.1 This paper describes a new statistical method for estimating influenza-related mortality.
This inference method relies on incidence proxies (introduced by Goldstein and colleagues2) for the three major influenza strains (A/H3N2, A/H1N1 and B). These influenza incidence proxies are different from those used in several previous studies1,3,4 estimating influenza-associated mortality. The weekly incidence proxies are defined in this study as the proportion of physician visits for influenza-like-illness multiplied by the proportion of respiratory specimen testing positive for particular influenza subtypes, weighted by regional populations in the US. Under certain assumptions, this proxy should be approximately linearly related to the weekly incidence of subtype-specific influenza cases in the population. 2 The influenza-like-illness measure accounts for the changing numbers of sick individuals from whom tests are sampled, while the viral positivity indicator accounts for variation in the proportion of influenza-like-illness that is, in fact, influenza-related.
Those incidence proxies can be used to define a linear relation between influenza incidence and excess mortality. More precisely, weekly all-cause or cause-specific mortality data are regressed linearly against the weekly influenza incidence proxies, temporal trends and a periodic annual baseline. We do not assume a trigonometric model to account for seasonality in mortality baselines,1,3,5,6 but instead model them using periodic cubic splines to accommodate their (a-priori unknown) shape. 7 Moreover we allow the baseline seasonal pattern of mortality to change following the introduction of pneumococcal conjugate vaccine in the US in 2000, which led to a reduction in invasive pneumococcal disease.8–11 In particular, the holiday season spikes for pneumococcal disease in older adults are reduced in the post-vaccination era,12 which may affect the estimates of the contribution of influenza to various underlying causes of death. In addition, given the prominent role played by influenza A/H3N2 in influenza-associated mortality,13 we allow the impact of the A/H3N2 incidence proxy to vary over time, and to take into account the emergence of the A/H3N2 Fujian new antigenic variant strain in the US in 2003–2004.
Besides studying influenza’s contribution to all-cause mortality and mortality underlying respiratory and circulatory causes, we examine the potential contribution of influenza to mortality for several underlying causes: diabetes, cancer, Alzheimer disease, renal disease, and chronic liver disease. The latter underlying causes were not included in the recent revision of the US Centers for Disease Control (CDC) estimation procedures for flu-associated mortality.14
METHODS
Mortality data
Weekly mortality data were extracted from the National Center for Health Statistics database between 1997 and 2007 – the most recent year for which US vital statistics were available at the time of this writing. The mortality data are stratified by underlying causes, with each mortality record having a unique underlying cause.15 The mortality coding system changed in 1999 due to the transition to a new revision of the International Classification of Diseases in the US (ICD-9 to ICD-10). Conversion factors for mortality counts adjusting for the above change were adopted from the report by Anderson and colleagues.16
In addition to all-cause mortality, we investigated the potential contribution of influenza to several specific underlying causes (see eTable 1 [http://links.lww.com/EDE/A611] for a list of causes and specific codes). Those causes were chosen because of their prominence in mortality data and the relatively high prevalence of the associated conditions among adults hospitalized for influenza.17 In addition, the same analysis was performed for deaths due to septicemia and unintentional injuries, which we used as controls that are independent of influenza infection.
For a specific underlying cause (e.g. myocardial infarction) or a collection of underlying causes (e.g. all circulatory deaths or all cause mortality), c, we denote by Mc (t) the reported mortality for cause(s) c in week t.
Incidence proxies and their estimation from data
Each influenza season is defined as the time between week 40 of one calendar year and week 20 of the next calendar year, with 10 seasons from 1997–1998 to 2006–2007.18 We adopt the definition of the weekly incidence proxy for each of the three influenza subtypes from the paper by Goldstein and colleagues. 2 Specifically, for the influenza season, the weekly incidence proxy is defined as the proportion of influenza-like-illness among all outpatient visits to sentinel physicians, multiplied by the proportion of respiratory viral isolates tested that were positive for a particular strain, weighted by the regional populations for the ten regions defined by the US Department of Health and Human Services.18 For the non-influenza season, the weekly incidence proxy for each strain is set to zero. We denote by H 3(t), H 1(t), B (t) the incidence proxies of influenza A/H3N2, A/H1N1 and B on week t in the data as defined above.
Statistical approach
As an initial step, we inspected the feasibility of relating mortality to the influenza incidence proxies by comparing excess pneumonia and influenza mortality above a Serfling seasonal baseline (thought to be a specific indicator of influenza-related mortality) to influenza incidence proxies shifted forward by two weeks.19 These analyses, detailed in the eAppendix (http://links.lww.com/EDE/A611), revealed good correlation between excess pneumonia and influenza mortality and the A/H3N2 incidence proxy (eFigure 1 http://links.lww.com/EDE/A611), in line with the prominent contribution of influenza A/H3N2 to mortality.13 In addition, a “bump” in excess mortality was observed around the first week of January in the first 4 years of our study period and disappeared in more recent years, coincidental with the introduction of the pneumococcal conjugate vaccination in 2000. Further, the ratio of excess mortality to A/H3N2 incidence was bigger before than after the 2003–2004 season, when the Fujian variant of A/H3N2 appeared.
Based on these preliminary analyses, the A/H3N2 incidence proxy was split as
| (1) |
Here H 31(t) is the incidence proxy of A/H3N2 prior to appearance of the Fujian strain in the 2003–2004 season (defined to be zero afterwards), and H 32(t) is the incidence proxy of A/H3N2 starting with the ’03–’04 season. Second, we split
| (2) |
Here Base1(t) is periodic (period 52 weeks) before the 2000–2001 season and zero after that (starting week 23 of 2001), representing the baseline prior to the introduction of pneumococcal conjugate vaccine in the US. Base2 (t) is zero prior to week 23 of 2001 and periodic thereafter, representing the baseline in the presence of the pneumococcal vaccine.8–12 Given that two years in the CDC data (1997 and 2003)18 have 53 epidemiologic weeks in order to make the baselines periodic, we discarded mortality data for the week in mid-July for the subsequent years (1998 and 2004), and specified the 1997–1998 and 2003–2004 influenza seasons to end on calendar week 19 rather than 20 of both 1998 and 2004.
Our basic model for relating mortality for a collection of causes c to influenza circulation is
| (3) |
Here the temporal trend is modeled by a polynomial in the calendar year. Both Base 1(t) and Base 2 (t) are assumed to be elements of the space SB4 - periodic cubic splines on the interval [0,52] (with a period of 52 weeks), with a knot every four weeks. The noise in our primary inference process is assumed to be white noise (ordinary-least-squares) inference. Finally, the operator S (applied to each incidence proxy) is the forward-shifting operator by the time from incidence to mortality. The distribution of the time from incidence to death is unknown and may be specific to a particular cause of death; the specific lag between incidence and mortality will also depend on details of the reporting system for influenza-like-illness and viral activity. Analysis of the mean-square accuracy of the ordinary-least-squares fits (R2) showed that the best fits for all causes occur when incidence is shifted forward by between 1 and 2 weeks. Correspondingly, if Si is the forward shift operator by i weeks, we use
| (4) |
and the parameter 0 ≤ f ≤ 1 is determined for each cause by maximizing the R2 of the fit. The components of the model described by equations (3) and (4) are summarized in Table 1.
Table 1.
Components of the main inference model (described by equations (3) and (4))
| Component | Role | |
|---|---|---|
| Mc (t) | Weekly mortality underlying a specific cause, or a collection of causes | |
| H 31 (t) | Weekly incidence proxy for influenza A/H3N2 during the 1997–1998 through 2002–2003 seasons (before the appearance of the Fujian A/H3N2 strain) | |
| H 32 (t) | Weekly incidence proxy for influenza A/H3N2 during the 2003–2004 through 2006–2007 seasons (the Fujian A/H3N2 strain) | |
| H 1(t) | Weekly incidence proxy for influenza A/H1N1 | |
| B (t) | Weekly incidence proxy for influenza B | |
| S | Forward shift operator (between one and two weeks) relating influenza incidence proxies and mortality | |
| f | Fraction of influenza incidence proxy shifted forward by 1 week in S (with a fraction(1 − f) shifted forward by 2 weeks) | |
|
|
Regression coefficient for S (H31) | |
|
|
Regression coefficient for S (H32) | |
| βH1 | Regression coefficient for S (H1) (omitted in the main inference model) | |
| βB | Regression coefficient for S (B) | |
| Base1 (t) | Weekly periodic annual baseline for mortality (with a period of 52 weeks) before week 23 of 2001 (zero thereafter) | |
| Base2 (t) | Weekly periodic annual baseline for mortality (with a period of 52 weeks) starting week 23 of 2001 (zero before that) | |
| Trend | A (low degree) polynomial in the calendar year | |
| Noise | Difference between the expected and observed mortality |
In the full model given by equation (3), the regression coefficient for influenza A/H1N1 was close to zero for all categories of death, and negative for most categories studied (including all cause mortality). We report the results of the model with influenza A/H1N1 excluded, and present the results with A/H1N1 incidence included in the inference process in the eAppendix (http://links.lww.com/EDE/A611).
Auto-correlated noise and the bootstrapped confidence bounds
Examination of the residuals in the model given by equation (3) reveals auto-correlation for each of the studied underlying causes of death. However, even in the presence of auto-correlation –which might have a complicated, non-stationary (e.g. seasonal) structure – the ordinary-least-squares estimates are generally unbiased.20 The confidence bounds for these estimates are bootstrapped by fitting the residuals to an autoregressive-moving-average model – in fact, examination of the autocorrelation, as well as the partial autocorrelation structure of the residuals, suggests that modeling the residuals as an auto-regressive AR(1) process is adequate. The bootstrap works as follows in two steps: Let Mc (t) be the mortality data, M̂c(t) be the ordinary-least-squares estimates, e (t) = Mc(t) − M̂c(t) be the residuals.
-
Step 1
(Bootstrap estimate of the autoregressive parameter). Let ρ̂ = cor(e(t−1), e(t)) be the initial estimate of the autoregressive parameter for the AR(1) noise. This estimate is generally biased downward. 21 The bias is estimated through the following bootstrap procedure:
Define V (t) =e (t)− ρ̂·e(t −1), e*(1) = e(1), e*(t) = ρ̂·e*(t −1) + V*(t)
where V* is drawn (with replacement) from {V (j)}. Define . is then regressed against the covariates, and an estimate ρ* of the autoregressive parameter is generated as the correlation between the residuals in the above linear regression. The bias is estimated as , 21, where is the mean of the bootstrapped sample (ρ*). The bootstrapped estimate of the autoregressive parameter is ρboot = ρ̂ − Bias
-
Step 2
(Bootstrap estimate of the regression parameters). Repeat Step 1 with ρ̂ replaced by ρboot to obtain a sample of the regression parameters (β*). 22 The latter sample is used to obtain confidence bounds on those parameters (Table 1) as well as on the contribution of influenza to mortality during different time periods.
Testing the presence of harvesting: association between influenza-associated mortality and mortality in the following summer
It has been suggested that excess influenza-related mortality is associated with a decrease in mortality in the following summer. 23,24 To investigate this further, we examined the correlation between our annual estimates of influenza-associated all-cause mortality (between week 41 of calendar year X and week 22 of year X + 1) and:
Summertime excess mortality (defined as observed mortality minus (Baseline +trend)). Summer was defined as weeks 23–40 of year X + 1;
Overall annual excess mortality (between week 41 of year X and week 40 of year X + 1);
Wintertime annual excess mortality (2.−1.).
RESULTS
All-cause mortality
In this section we estimate the contribution of influenza to all-cause mortality. The forward-shifting parameter f in equation (4) is estimated to be 0.445, suggesting a balanced contribution of influenza proxies in week t−1 and t−2 to mortality in week t. (R2 = 0.9613). The estimated regression coefficients (multiplied by 1,000) related to influenza subtype-specific incidence proxies are , βB =14.07 (6.72 to 21.45). The coefficient for A/H3N2 before 2003–2004 is almost 40% higher than that starting in 2003–2004.
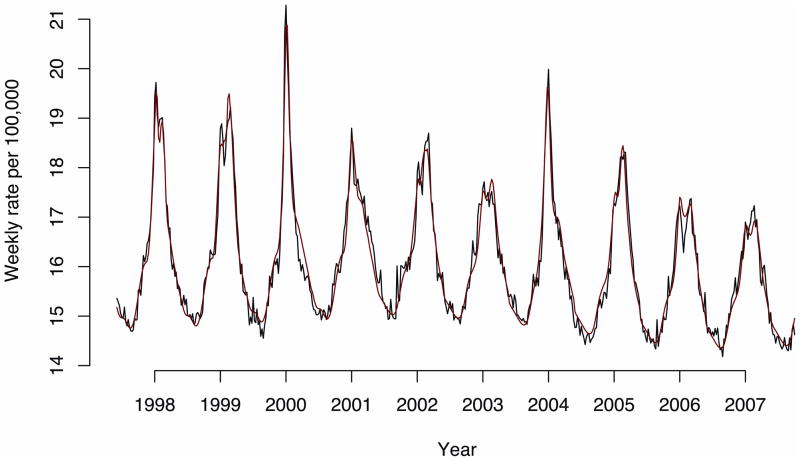
The fit of the all-cause mortality model was excellent and the model predictions were temporally consistent with the observed values, as illustrated by Figure 1.
Figure 1.
All-cause mortality (black) and the model fit (red).
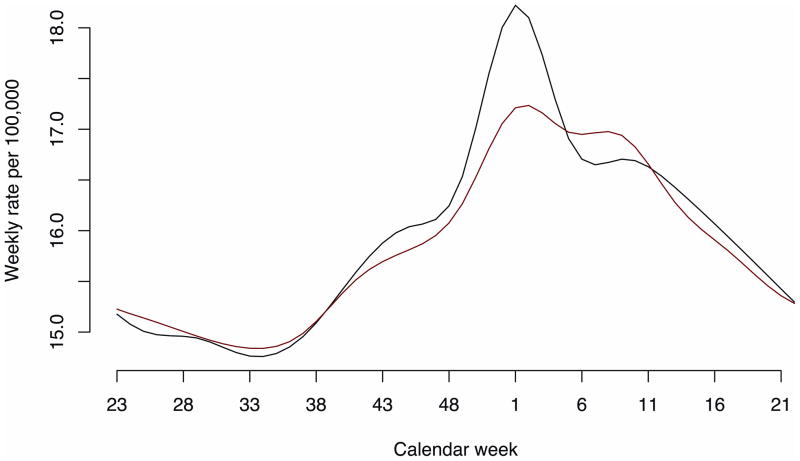
Figure 2 plots the weekly mortality baselines Base 1(t) and Base 2 (t) before and after 2001. As expected from preliminary analysis (eAppendix, http://links.lww.com/EDE/A611), the main change is the reduction of the January “bump” in baseline for the years after the introduction of the pneumococcal conjugate (PCV7) vaccine as well as a slight shift of estimated baseline mortality from fall and winter toward early spring.
Figure 2.
Annual all-cause mortality baselines (black indicates Base1; red, Base2).
Base1: seasons 1997–1998 through 2000–2001; Base2: seasons 2001–2002 through 2006–2007.
Annual estimates of the incidence proxies for the three influenza strains are given in the paper by Goldstein and colleagues. 2 One can combine these incidence estimates with the estimated influenza regression coefficients to generate annual estimates (and confidence intervals) for each strain’s contribution to all-cause mortality. The latter estimates are summarized in Table 2 and highlight important variability in influenza mortality burden across years, ranging from 4.96 (winter 2000–2001) to 20.49 (winter 1998–1999) per 100,000.
Table 2.
Annual all-cause mortality rates per 100,000 associated with each influenza subtype, and with influenza overall
| Season | Influenza A/H3N2 Rate (95% CI) | Influenza B Rate (95% CI) | All influenza Rate (95% CI) |
|---|---|---|---|
| 1997–1998 | 16.38 (13.9 to 18.7) | 0.07 (0.03 to 0.1) | 16.45 (14 to 18.7) |
| 1998–1999 | 15.91(13.5 to 18.1) | 4.58 (2.1 to 6.9) | 20.49 (17 to 23.9) |
| 1999–2000 | 15.0 (12.7 to 17.1) | 0.08 (0.04 to 0.12) | 15.1 (12.8 to 17.2) |
| 2000–2001 | 0.28 (0.24 to 0.32) | 4.68 (2.2 to 7.1) | 4.96 (2.4 to 7.4) |
| 2001–2002 | 10.81 (9.2 to 12.3) | 1.96 (0.9 to 3) | 12.78 (10.8 to 14.6) |
| 2002–2003 | 1.41 (1.2 to 1.6) | 3.82 (1.8 to 5.8) | 5.22 (3.1 to 7.2) |
| 2003–2004 | 15.98 (13.1 to 18.9) | 0.19 (0.09 to 0.29) | 16.17 (13.3 to 19.1) |
| 2004–2005 | 8.85 (7.3 to 10.5) | 4.39 (2 to 6.6) | 13.24 (10.5 to 15.9) |
| 2005–2006 | 7.19 (5.9 to 8.5) | 2.45 (1.1 to 3.7) | 9.64 (7.9 to 11.4) |
| 2006–2007 | 2.29 (1.8 to 2.7) | 2.84 (1.3 to 4.3) | 5.13 (3.6 to 6.6) |
| Overall average | 9.41 (8.3 to 10.5) | 2.51 (1.2 to 3.8) | 11.92 (10.1 to 13.6) |
The estimates in Table 2 refer to a model without influenza A/H1N1; for comparison, a model including A/H1N1 is presented in eAppendix (http://links.lww.com/EDE/A611) Section S3.
Specific mortality causes
In this section we repeat the same analysis for several specific underlying mortality causes. Table 3 gives estimates of the influenza-specific model parameters and average influenza-associated annual mortality rate during the study period.
Table 3.
Results of influenza regression model (with parameters described in Table 1) for various underlying mortality causes between 1997 and 2007. Regression coefficients (95% confidence intervals) are multiplied by 1,000.
|
|
|
βB | OLS R2 | f (eq. 4) | Average annual mortality rate per 100,000 | |||
|---|---|---|---|---|---|---|---|---|
| UNDERLYING CAUSES OF INFLUENZA-RELATED DEATHS | ||||||||
| All-Cause | 15.06 (12.89 to 17.24) | 10.84 (8.94 to 12.88) | 14.07 (6.72 to 21.45) | 11.92 (10.1 to 13.6) | ||||
| All circulatory | 6.07 (5.04 to 7.06) | 3.79 (2.87 to 4.71) | 5.56 (2.07 to 9.07) | .98 | .546 | 4.6 (3.79 to 5.39) | ||
| Heart disease | 4.93 (4.16 to 5.72) | 3.12 (2.43 to 3.82) | 4.90 (2.29 to 7.5) | .97 | .643 | 3.82 (3.2 to 4.4) | ||
| Ischemic heart Disease | 3.54 (2.96 to 4.15) | 2.16 (1.64 to 2.71) | 3.46 (1.5 to 5.48) | .98 | .661 | 2.7 (2.23 to 3.16) | ||
| Myocardial infarctions | 1.39 (1.16 to 1.62) | 0.76 (0.56 to 0.97) | 1.30 (0.55 to 2.04) | .98 | .791 | 1.02 (0.85 to 1.2) | ||
| Cerebrovascular disease | 0.93 (0.76 to 1.1) | 0.46 (0.32 to 0.62) | 0.76 (0.19 to 1.33) | .97 | .149 | 0.65 (0.51 to 0.78) | ||
| All respiratory | 5.22 (4.52 to 5.9) | 3.85 (3.18 to 4.49) | 1.64 (−0.81 to 4.09) | .96 | .278 | 3.58 (3.04 to 4.14) | ||
| Pneumonia & Influenza | 2.51 (2.25 to 2.77) | 1.99 (1.76 to 2.22) | 0.56 (−0.31 to 1.45) | .96 | .138 | 1.73 (1.53 to 1.93) | ||
| Chronic lower Respiratory | 2.21 (1.91 to 2.5) | 1.53 (1.27 to 1.81) | 1.93 (0.95 to 2.91) | .96 | .453 | 1.7 (1.48 to 1.93) | ||
| Cancer | 1.15 (0.91 to 1.4) | 0.62 (0.41 to 0.83) | 1.22 (0.44 to 1.98) | .83 | 1 | 0.87 (0.68 to 1.05) | ||
| Diabetes | 0.36 (0.27 to 0.44) | 0.24 (0.17 to 0.32) | 0.60 (0.34 to 0.88) | .89 | .555 | 0.33 (0.26 to 0.39) | ||
| Renal disease | 0.20 (0.14 to 0.26) | 0.18 (0.13 to 0.24) | 0.28 (0.08 to 0.49) | .89 | 0 | 0.19 (0.14 to 0.24) | ||
| Central nervous system disease | 0.28 (0.14 to 0.41) | 0.36 (0.23 to 0.49) | 1.08 (0.61 to 1.55) | .96 | .238 | 0.42 (0.31 to 0.53) | ||
| Alzheimer disease | 0.28 (0.13 to 0.42) | 0.34 (0.2 to 0.47) | 1.09 (0.61 to 1.57) | .96 | .215 | 0.41 (0.3 to 0.52) | ||
| Chronic liver disease | 0.05 (0.008 to 0.08) | 0.07 (0.04 to 0.1) | 0.04 (−0.08 to 0.16) | .51 | .40 | 0.048 (0.02 to 0.08) | ||
| CONTROL CAUSES OF DEATH | ||||||||
| Septicemia | −0.28 (−0.86 to 0.30) | 0.18 (−0.5 to 0.83) | −0.98 (−3.75 to 1.79) | .8192 | 1 | −0.23 (−0.74 to 0.27) | ||
| Unintentional injuries | 0.08 (−0.05 to 0.23) | 0.16 (0.04 to 0.29) | 0.15 (−0.32 to 0.63) | .7801 | 1 | 0.11 (−0.002 to 0.22) | ||
All causes of death that were potentially associated with influenza based on their prominence in mortality statistics or influenza-related hospitalization records (including respiratory, cardiac, cancer, diabetes, renal, chronic liver, and central nervous system diseases) have substantial positive influenza estimates (Table 3). For control causes of death, coefficients were generally small and sometimes negative.
A few disjoint causes within each of the broader categories explained nearly the whole estimate for those categories. Specifically, circulatory disease, respiratory disease, cancer, diabetes, Alzheimer disease, renal disease, and chronic liver disease added up to about 84% of the all-cause estimate for influenza-associated mortality; heart disease and cerebrovascular disease estimates added up to about 97% of all circulatory flu-associated deaths; and pneumonia and influenza and lower respiratory disease estimates added up to about 96% of all respiratory flu-associated deaths.
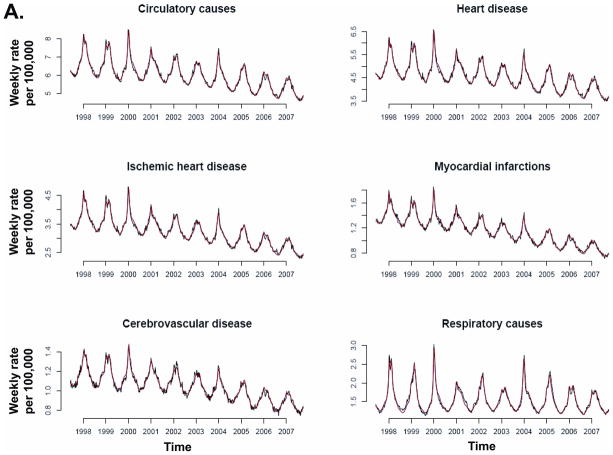
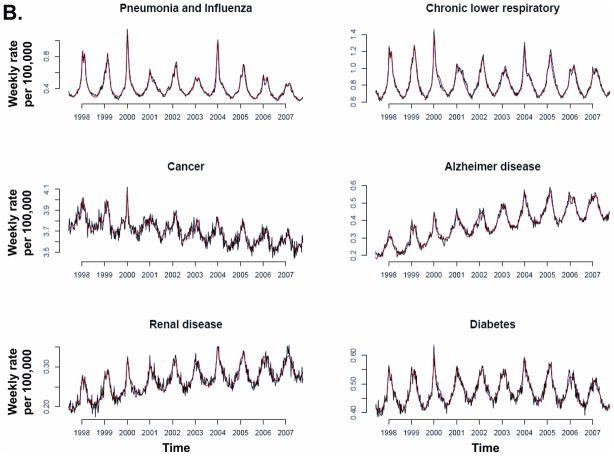
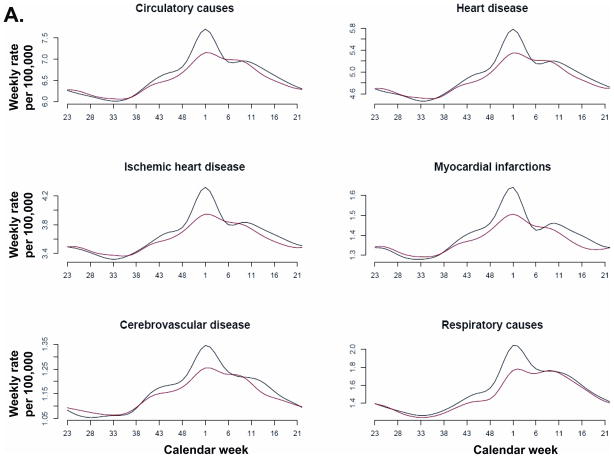
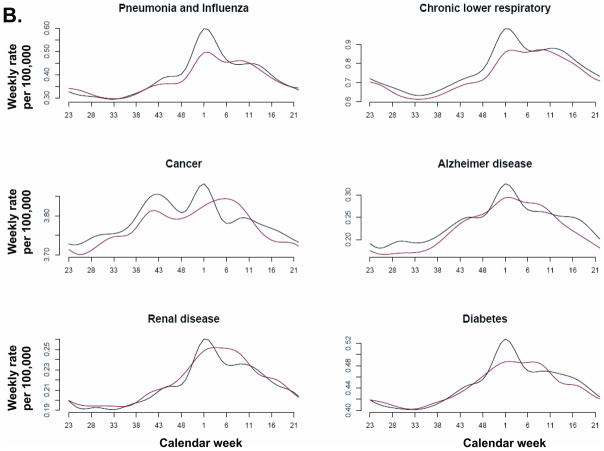
Model fit to weekly data was temporally consistent for individual causes of death (Figure 3) and R2 was above 83% for 13 of the 14 causes of death associated with influenza (Table 3). Chronic liver disease had the lowest model R2 (51%) and the smallest influenza contribution of all studied death categories.
Figure 3.
Recorded (black) and fitted (red) mortality for various underlying causes.
Similar to the patterns seen in estimated baselines for all-cause mortality, the holiday-season bump was observed for a number of underlying causes before 2000, especially among respiratory and circulatory causes, and nearly disappeared in recent years (Figure 4).
Figure 4.
Mortality baselines Base1 (black) and Base2 (red) for various underlying causes.
Harvesting: Influenza-associated mortality vs. mortality in the following summer
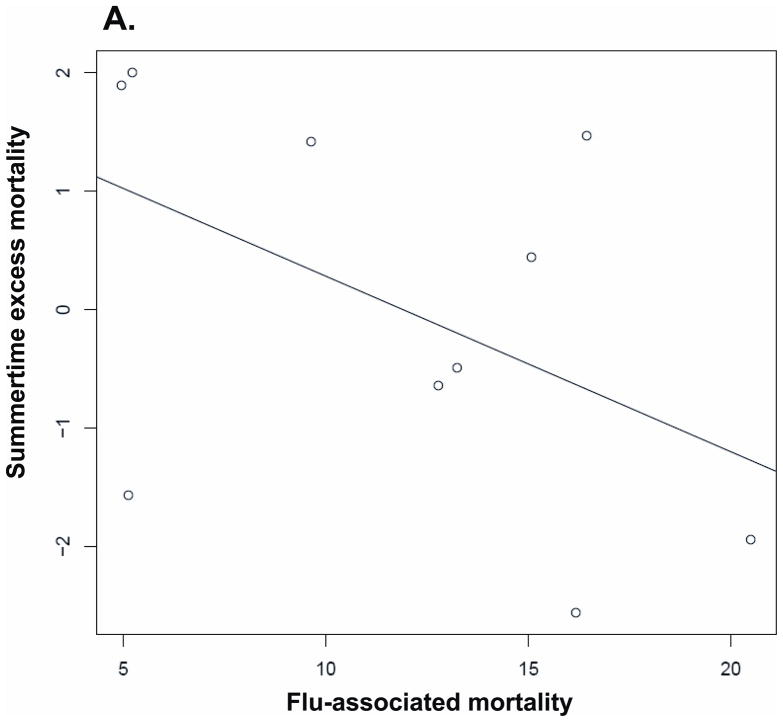
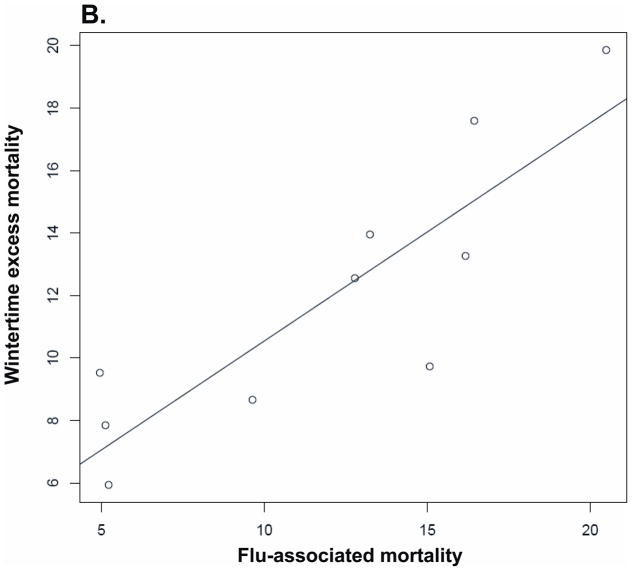
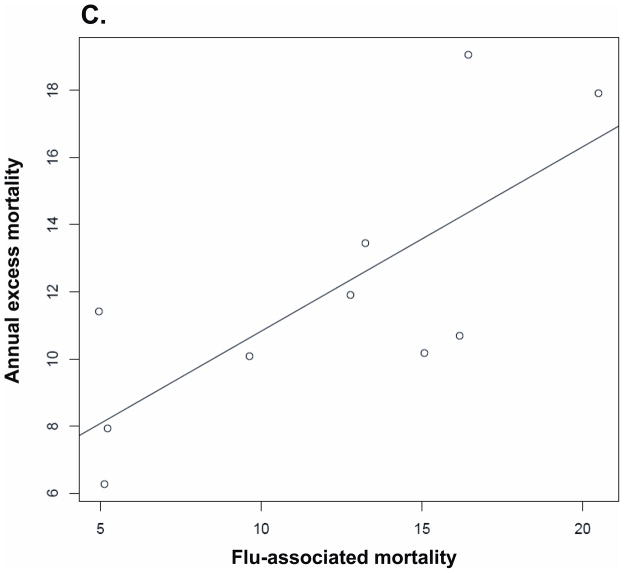
We studied the correlation between annual influenza-associated mortality and excess mortality during different time periods, based on all-cause mortality estimates. The results for the correlation above are presented in Table 4. That relation is also plotted in Figure 5.
Table 4.
Correlation between flu-associated mortality and excess mortality during various time periods
| Correlation with excess mortality above baseline + trend | Pearson Correlation coefficient (95% CI) | P | Spearman Correlation coefficient | P |
|---|---|---|---|---|
| Following summer | −0.482 (−0.85 to 0.21) | P= 0.158 | −0.455 | P= 0.191 |
| Same year | 0.748 (0.22 to 0.94) | P= 0.013 | 0.66 | P= 0.042 |
| Same winter | 0.864 (0.51 to 0.97) | P= 0.001 | 0.85 | P= 0.003 |
Figure 5.
Correlation between annual influenza-associated mortality and excess mortality during various time periods (with a linear regression line): (A) Summer, (B) Winter, (C) Annual.
Wintertime influenza mortality was positively correlated with annual excess mortality and wintertime excess mortality: overall mortality was higher in years and in winters with higher influenza-associated mortality. Mortality in the summer following high influenza-associated winter mortality tended to be lower. However, the relationship was weak, and the wintertime flu-associated mortality was an order of magnitude larger than the estimated reduction in mortality the following summer. Overall, these findings give little evidence of substantial “harvesting” by influenza-associated mortality of persons who would have died within the year anyway.
DISCUSSION
While evaluation of mortality attributable to influenza is of great interest, several aspects of the existing estimation methodologies merit reconsideration. Some of those aspects are the usage of the percent-positive proxy for the incidence of influenza, an exponential (rather than linear) relation assumed between influenza incidence and mortality,1,3,7,25; and the use of a trigonometric baseline for the annual non-flu-associated mortality.1,3,6 Moreover, we hypothesized that it might be important to consider two epidemiologic phenomena that occurred during the study period: the introduction of pneumococcal conjugate vaccination8,9,11,12 and the appearance of the antigenically novel Fujian A/H3N2 strain during the 2003–2004 season in the US.
Our estimation procedure for the contribution of influenza to several underlying causes of death (including all-cause mortality) addresses the above aspects. We use weekly incidence proxies for the major influenza subtypes A/H3N2, A/H1N1 and B that combine information on the incidence of influenza-like-illness and laboratory testing, 2 and relate those incidence proxies linearly to influenza-associated mortality. In addition to respiratory and circulatory causes, we examine the potential contribution of influenza to mortality for several underlying causes frequently present in adults hospitalized for influenza17 : diabetes, 26 cancer, Alzheimer disease, renal disease, and chronic liver disease. We note that some of the mortality for other underlying causes not considered here may also be influenza-associated.
We estimate that 69% of flu-associated mortality in the U.S. is due to respiratory and circulatory causes. The model also shows a substantial contribution of influenza to mortality from cancer, diabetes, renal disease, central nervous system diseases, and chronic liver disease; the latter underlying causes account for an additional 16% of influenza-associated mortality. This stratification of influenza’s contribution to mortality is different from the recent CDC estimation,27 which limits influenza mortality to underlying respiratory and circulatory deaths. Moreover, we estimate the average annual influenza-associated mortality rate to be 8.2 per 100,000 between 1997 and 2007 in the US for respiratory and circulatory causes, while the CDC estimate 27 is 11.4 – closer to our estimate of 11.9 for the influenza contribution to all-cause mortality. The difference might stem largely from the fact that the CDC estimates 27 use data for the whole period from 1976 to 2007 in one inference framework. If one restricts the Poisson regression estimation procedure3 to 1997–2007, the average annual rate of all-cause influenza-associated deaths is 13.5 per 100,000, and the average rate of annual respiratory and circulatory deaths is 8.7 per 100,000 (Section S6 of the eAppendix, http://links.lww.com/EDE/A611), fairly close to our estimates.
The model indicates a change in the annual mortality baselines following the introduction of the pediatric pneumococcal vaccine (PCV7) in 2000. The timing of the change, and the fact that most of the underlying causes here are documented risk factors for pneumococcal disease, suggest that the introduction of PCV7 is a plausible explanation for this change. Between-country comparisons could take advantage of variations in the introduction of PCV7 worldwide to assess the consistency of this effect.
The model also suggests a substantial decline in the number of fatalities per 100,000 population associated with each unit increase in our incidence proxy for influenza A/H3N2 viruses circulating after the emergence of the Fujian antigenic variant in 2003. The latter difference may be due in part to a potentially lower impact of flu on mortality following the introduction of PCV7 (which also covers the period of the Fujian strain circulation), and to the fact that an antigenically novel strain affects children disproportionately compared with a strain that has previously circulated, lowering the overall case-fatality ratio. Given those considerations, one should be cautious in attributing a biologic significance to the observed difference in the case-fatality ratios for the pre- vs. post-Fujian A/H3N2 strains.
The contribution of the influenza A/H1N1 subtype to each mortality cause was consistently small or negative for all causes of death. For this reason, we excluded A/H1N1 from the main analysis. As shown in the eAppendix (http://links.lww.com/EDE/A611), inclusion of A/H1N1 has a very minor impact on other model parameters and resulting influenza-burden estimates. Our results are in line with previous US mortality studies that have shown A/H1N1 consistently causes the lowest mortality burden of all 3 influenza subtypes.1,6 In addition, our study period was relatively short, and did not include any A/H1N1-dominant season. Further, our study ended before the emergence of the A/H1N1 pandemic virus in 2009, which may have contributed more mortality than the seasonal influenza A/H1N1 viruses. The mortality from this pandemic cannot yet be compared with that of previous influenza seasons due to lack of recent US vital statistics data.28
The confidence intervals for the regression coefficients for influenza A/H3N2 are narrower than those for influenza B. For all respiratory causes, pneumonia and influenza, and chronic liver disease, the contribution of influenza B is uncertain. Moreover influenza B’s contribution to chronic lower respiratory diseases is estimated to be higher than its contribution to all respiratory causes, further emphasizing the lack of reliability in the latter estimate. Our results suggest that mortality attributable to influenza A/H3N2 is 3.8-fold higher than that attributable to influenza B during the study period. This is consistent with several earlier studies showing that A/H3N2-dominant seasons have 2–4-fold higher mortality than seasons dominated by other subtypes, including influenza B.1,2,6,27
The basic measure for goodness of fit in our model was the R2 for the linear regression. This measure dictated some of the choices made in the model, such as the distribution of time from incidence to mortality for the various causes of death and the selection of polynomial coefficients for the temporal trend. Additionally, R2 was the principal measure of the model’s accuracy in the sensitivity analysis described in the eAppendix (http://links.lww.com/EDE/A611). That analysis revealed, in particular, that use of proxies for influenza incidence based only on data from tests of respiratory specimens results in lower R2 values in the linear model and higher estimates of influenza-associated mortality.
The residuals in the ordinary-least-squares model used for inference were found to be auto-correlated. Maximum-likelihood inference using autoregressive-moving-average models for the noise produced somewhat smaller estimates for the regression coefficients for each subtype and each underlying cause compared with the ordinary-least-squares estimates. This suggests that some bias is possible if the autoregressive-moving-average structure for the noise is assumed in the model inference for our sample (538 observations and 33 regression coefficients). 29 Correspondingly, (the unbiased) ordinary-least-squares inference was used for our estimates of the contribution of influenza to mortality, and bootstrapping based on the autoregressive AR(1) model for the noise 21,22 was used to estimate the confidence bounds.
While the relationship between influenza and excess wintertime mortality is well-established, it has also been suggested that excess wintertime mortality reduces the heat effect on mortality in the following summer. 23,24 We have found that flu-associated mortality is substantially larger than summertime excess mortality in the following summers, suggesting that if there is a harvesting effect, it is relatively small. While influenza-associated mortality and summertime mortality were moderately negatively correlated, the correlation was not significant, whereas the correlation between annual flu-associated mortality and overall excess mortality was positive and significant.
Overall, our methodology renders temporally consistent estimates of flu-attributable mortality for a number of underlying causes, some of which have received little attention previously. Those estimates are “almost” additive in the sense that separate estimates for disjoint causes that make up most fatalities in a certain collection of causes nearly add up to the contribution of influenza for that whole collection. The linear relation between influenza incidence and mortality improves the mechanistic plausibility of the traditional regression models using a Poisson link between influenza incidence and deaths. Our model allows for the assessment of the role of related epidemiologic phenomena, such as changes in mortality baselines after the introduction of PCV and changes in case-fatality ratios associated with the appearance of the novel Fujian A/H3N2 strain. It suggests that, while some influenza deaths may occur in persons who would have died anyway within the coming year, this “harvesting” effect is a modest proportion of total influenza-attributable mortality. Our estimation method of the baseline for non-influenza associated mortality may be helpful in assessing the influenza-associated mortality during pandemic periods, such as the 2009 H1N1 pandemic. Finally, the linear relation between influenza incidence and excess mortality can be used in a prediction framework2 to explore the potential ramifications of an evolving influenza season, particularly one dominated by influenza A/H3N2.
Supplementary Material
Acknowledgments
Source of Funding: This work was supported in part by the US National Institutes of Health Models of Infectious Disease Agent Study program through cooperative agreement 1 U54 GM088558 (ML, EG), and by the influenza research program of the Fogarty International Center, US NIH (CV, VC).
We thank Dan Weinberger and Lone Simonsen for helpful discussions.
Footnotes
Conflicts of Interest
The content is solely the responsibility of the authors and does not necessarily represent the official views of the National Institute of General Medical Sciences or the National Institutes of Health.
Marc Lipsitch has received consulting fees or honoraria from Pfizer, Novartis, AIR Worldwide, and the Avian/Pandemic Flu Registry (Outcome Sciences and Roche). Other authors declare no conflicts on interest.
References
- 1.Thompson WW, Shay DK, Weintraub E, et al. Mortality associated with influenza and respiratory syncytial virus in the United States. JAMA. 2003;289:179–186. doi: 10.1001/jama.289.2.179. [DOI] [PubMed] [Google Scholar]
- 2.Goldstein E, Cobey S, Takahashi S, Miller J, Lipsitch M. Predicting the epidemic sizes of influenza A/H1N1, A/H3N2 and B: a statistical method. PLoS Med. 2011;8:e1001051. doi: 10.1371/journal.pmed.1001051. [DOI] [PMC free article] [PubMed] [Google Scholar]
- 3.Thompson WW, Weintraub E, Dhankhar P, et al. Estimates of US influenza-associated deaths made using four different methods. Influenza Other Respi Viruses. 2009;3:37–49. doi: 10.1111/j.1750-2659.2009.00073.x. [DOI] [PMC free article] [PubMed] [Google Scholar]
- 4.Dushoff J, Plotkin JB, Viboud C, Earn DJ, Simonsen L. Mortality due to influenza in the United States--an annualized regression approach using multiple-cause mortality data. Am J Epidemiol. 2006;163:181–187. doi: 10.1093/aje/kwj024. [DOI] [PubMed] [Google Scholar]
- 5.Serfling RE. Methods for current statistical analysis of excess pneumonia-influenza deaths. Public Health Rep. 1963;78:494–506. [PMC free article] [PubMed] [Google Scholar]
- 6.Simonsen L, Clarke MJ, Williamson GD, Stroup DF, Arden NH, Schonberger LB. The impact of influenza epidemics on mortality: introducing a severity index. Am J Public Health. 1997;87:1944–1950. doi: 10.2105/ajph.87.12.1944. [DOI] [PMC free article] [PubMed] [Google Scholar]
- 7.Warren-Gash C, Bhaskaran K, Hayward A, et al. Circulating influenza virus, climatic factors, and acute myocardial infarction: a time series study in England and Wales and Hong Kong. J Infect Dis. 2011;203:1710–1718. doi: 10.1093/infdis/jir171. [DOI] [PMC free article] [PubMed] [Google Scholar]
- 8.Lexau CA, Lynfield R, Danila R, et al. Changing epidemiology of invasive pneumococcal disease among older adults in the era of pediatric pneumococcal conjugate vaccine. JAMA. 2005;294:2043–2051. doi: 10.1001/jama.294.16.2043. [DOI] [PubMed] [Google Scholar]
- 9.Whitney CG, Farley MM, Hadler J, et al. Decline in invasive pneumococcal disease after the introduction of protein-polysaccharide conjugate vaccine. N Engl J Med. 2003;348:1737–1746. doi: 10.1056/NEJMoa022823. [DOI] [PubMed] [Google Scholar]
- 10.US CDC. Direct and indirect effects of routine vaccination of children with 7-valent pneumococcal conjugate vaccine on incidence of invasive pneumococcal disease--United States, 1998–2003. MMWR Morb Mortal Wkly Rep. 2005;54:893–897. [PubMed] [Google Scholar]
- 11.Simonsen L, Taylor RJ, Young-Xu Y, Haber M, May L, Klugman KP. Impact of pneumococcal conjugate vaccination of infants on pneumonia and influenza hospitalization and mortality in all age groups in the United States. MBio. 2011;2:e00309–00310. doi: 10.1128/mBio.00309-10. [DOI] [PMC free article] [PubMed] [Google Scholar]
- 12.Walter ND, Taylor TH, Jr, Dowell SF, Mathis S, Moore MR. Holiday spikes in pneumococcal disease among older adults. N Engl J Med. 2009;361:2584–2585. doi: 10.1056/NEJMc0904844. [DOI] [PubMed] [Google Scholar]
- 13.Thompson WW, Moore MR, Weintraub E, et al. Estimating influenza-associated deaths in the United States. Am J Public Health. 2009;99 (Suppl 2):S225–230. doi: 10.2105/AJPH.2008.151944. [DOI] [PMC free article] [PubMed] [Google Scholar]
- 14.US CDC. Interim results: state-specific influenza A (H1N1) 2009 monovalent vaccination coverage - United States, October 2009–January 2010. MMWR Morb Mortal Wkly Rep. 2010;59:363–368. [PubMed] [Google Scholar]
- 15.NAPHSIS. [Accessed October 1, 2011];Underlying cause of death. http://www.naphsis.org/NAPHSIS/files/ccLibraryFiles/Filename/000000001006/underlying%20cause%20-.pdf.
- 16.Anderson RN, Minino AM, Hoyert DL, Rosenberg HM. Comparability of cause of death between ICD-9 and ICD-10: preliminary estimates. Natl Vital Stat Rep. 2001;49:1–32. [PubMed] [Google Scholar]
- 17.US CDC. [Accessed October 1, 2011];FluView, Week. 2011 20 http://www.cdc.gov/flu/weekly/weeklyarchives2010-2011/weekly20.htm. [Google Scholar]
- 18.US CDC. [Accessed October 1, 2011];United States Surveillance Data. http://www.cdc.gov/flu/weekly/ussurvdata.htm.
- 19.Glezen WP, Payne AA, Snyder DN, Downs TD. Mortality and influenza. J Infect Dis. 1982;146:313–321. doi: 10.1093/infdis/146.3.313. [DOI] [PubMed] [Google Scholar]
- 20.Brockwell PJ, Davis RA. Introduction to time series and forecasting. New York: Springer; 2002. p. xiv.p. 434. [Google Scholar]
- 21.Kim JH, Yeasmin M. The Size and Power of the Bias-Corrected Bootstrap Test for Regression Models with Autocorrelated Errors. Computational Economics. 2005;25:255–267. [Google Scholar]
- 22.Fox J. Applied regression analysis and generalized linear models. 2. Los Angeles: Sage Publications; 2008. [Google Scholar]
- 23.Rocklov J, Forsberg B, Meister K. Winter mortality modifies the heat-mortality association the following summer. Eur Respir J. 2009;33:245–251. doi: 10.1183/09031936.00037808. [DOI] [PubMed] [Google Scholar]
- 24.Stafoggia M, Forastiere F, Michelozzi P, Perucci CA. Summer temperature-related mortality: effect modification by previous winter mortality. Epidemiology. 2009;20:575–583. doi: 10.1097/EDE.0b013e31819ecdf0. [DOI] [PubMed] [Google Scholar]
- 25.Gay NJ, Andrews NJ, Trotter CL, Edmunds WJ. Estimating deaths due to influenza and respiratory syncytial virus. JAMA. 2003;289:2499. doi: 10.1001/jama.289.19.2499-a. author reply 2500–2492. [DOI] [PubMed] [Google Scholar]
- 26.Reichert TA, Simonsen L, Sharma A, Pardo SA, Fedson DS, Miller MA. Influenza and the winter increase in mortality in the United States, 1959–1999. Am J Epidemiol. 2004;160:492–502. doi: 10.1093/aje/kwh227. [DOI] [PubMed] [Google Scholar]
- 27.US CDC. Estimates of deaths associated with seasonal influenza --- United States, 1976–2007. MMWR Morb Mortal Wkly Rep. 2010;59:1057–1062. [PubMed] [Google Scholar]
- 28.Shrestha SS, Swerdlow DL, Borse RH, et al. Estimating the burden of 2009 pandemic influenza A (H1N1) in the United States (April 2009–April 2010) Clin Infect Dis. 2001;52 (Suppl 1):S75–82. doi: 10.1093/cid/ciq012. [DOI] [PubMed] [Google Scholar]
- 29.Beach CM, MacKinnon JG. A Maximum Likelihood Procedure for Regression with Autocorrelated Errors. Econometrica. 1978;46:51–58. [Google Scholar]
Associated Data
This section collects any data citations, data availability statements, or supplementary materials included in this article.


