

Abstract
The sterile alpha motif (SAM) for protein-protein interactions is encountered in over 200 proteins, but the structural bases for its interactions is just becoming clear. Here we solved the structure of the EphA2-SHIP2 SAM:SAM heterodimeric complex by use of NMR restraints from chemical shift perturbations, NOE and RDC experiments. Specific contacts between the protein surfaces differ significantly from a previous model and from other SAM:SAM complexes. Molecular dynamics and docking simulations indicate fluctuations in the complex towards alternate, higher energy conformations. The interface suggests that EphA family members bind to SHIP2 SAM whereas EphB members may not; correspondingly we demonstrate binding of EphA1 but not of EphB2 to SHIP2 SAM. A variant of EphB2 SAM was designed that binds SHIP2. Functional characterization of a mutant EphA2 compromised in SHIP2 binding reveals two previously unrecognized functions of SHIP2 in suppressing ligand-induced activation of EphA2 and in promoting chemotactic cell migration in coordination with the receptor.
Keywords: NMR structure determination of a protein complex, molecular dynamics and docking calculations, binding thermodynamics and specificity, receptor tyrosine kinase, SHIP2, cell migration, endocytosis
INTRODUCTION
A goal for the characterization of protein complexes by structural biology techniques is to obtain structures of high resolution and accuracy. If this is possible, the structures can be used to explain the biophysical features of the protein-protein interaction and point to the critical residues that determine binding affinity, if not specificity. In the case of the NMR derived protein complex structure reported here, we used a wide range of additional restraints, site directed mutagenesis and computational techniques in order to refine the structural ensemble. We demonstrate that a considerable understanding of the protein-protein interaction is possible even in the case where binding affinity is modest and alternative structures are likely to be populated.
There are 206 SAM (sterile alpha motif) domains in humans (Qiao and Bowie, 2005). These small (~70 residue) domains are found in different regions of a diverse set of proteins and have a wide repertoire of neighboring domains. Several studies suggest that the principal role of SAM domains is to mediate protein-protein and protein-nucleic acid interactions (Kim et al., 2002; Lackmann et al., 1998; Ramachander and Bowie, 2004; Schultz et al., 1997). The structures of a number of isolated SAM domains and of SAM domains in complexes have been solved (Smalla et al., 1999; Stapleton et al., 1999; Thanos et al., 1999a; Thanos et al., 1999b), revealing a relatively well conserved fold consisting of 5 alpha-helices, although some deviations in helix angles, if not limits -and in one case also in the number of helices- have been noted (Kwan and Donaldson, 2007). Several, but far from all SAM domains are known to homodimerize and/or heterodimerize (Ramachander and Bowie, 2004), but the rules for the different behaviors are just emerging (Meruelo and Bowie, 2009). Although the sequences are poorly conserved between families, the complexes at first sight appear to have several common topologies. These are the back-to-back (BB) (Thanos et al., 1999b), helix-to-helix (HH) (Bhattacharjya et al., 2004), and the end helix (EH)/mid-loop (ML) interfaces (Kim et al., 2002; Rajakulendran et al., 2008; Tran et al., 2002). For example, the structure of the CNK and HYP SAM domain heterodimer (Rajakulendran et al., 2008) reveal that SAM domains use EH/ML surfaces to participate in both homotypic and heterotypic interactions. The ML surface is near the middle of the domain and encompasses the loop between the second and third helices as well as the third helix itself (Fig. 1). The EH surface encompasses the fifth helix. Importantly, however, the physico-chemical characteristics of the residues involved can differ very substantially. For instance Fig. 2 displays a comparison between two SAM domain complexes that use the EH/ML interaction topology, demonstrating that the electrostatic nature of the interfaces is completely different. This raises the general question as to which residues are important for complex formation and to what extent the topology of a complex can be regarded as similar.
Figure 1.

SAM:SAM heterodimer topology via the end-helix/mid-loop interface motif. (A) hCNK2:dHYP SAM:SAM complex (B) Secondary structure elements of EphA2 SAM domain; Mid-Loop (ML) and End-Helix (EH) surfaces are indicated. (C) Structure for EphA2:SHIP2 SAM:SAM complex (lowest HADDOCK score structure of cluster 1). See also Figures S1, S2 and S5.
Figure 2.

Comparison of interface character. Electrostatic features of the hCNH2:dHYP interface compared to the EphA2:SHIP2 SAM interacting surface (shown as open book presentation), shaded blue = positive charge and red = negative charge. Circled region indicates the binding surfaces.
The 14 members of Eph family of transmembrane receptor tyrosine kinases provide repulsive cues for guidance events which are fundamental to the formation of neuronal and vascular networks. SAM domains are found at the intracellular C terminus of all the known Eph proteins (Pawson and Nash, 2003). It remains uncertain whether SAM domain homo- or heterodimerization plays a role in the Eph signaling mechanism in general. However, the formation of heterodimers of the EphA2 SAM domain with the SAM of SHIP2 (SH2-linked inositol phosphatase 2) has been associated with the localization of the latter enzyme to the membrane. This in turn appears to inhibit receptor endocytosis and thus down-regulation, (Zhuang et al., 2007), although functional significance of the interaction in cellular processes, including cell migration, remains to be elucidated.
Recently, Leone et al. used solution NMR to propose a model for the SAM:SAM complex between the EphA2 receptor and the SHIP2 protein domains. The calculations in HADDOCK1.3 employed purely ambiguous restraint data derived from chemical shift perturbation (CSP) at pH 7.7 (Leone et al., 2008). The proposed model is consistent with several site directed mutagenesis data also presented, but was not of sufficient resolution to be deposited in the protein databank. We have studied the same complex independently under different solution conditions at a pH of 6.8. This pH is can be regarded as more physiological, as it is found in the cytoplasm of typical cells. Here we present the NMR derived structure, refined to a higher resolution by use of unambiguous distance (NOE) and orientational (RDC) restraints. Our structure (pdb id 2KSO) is in limited agreement with the previous model, showing several differences in the detailed interactions between residue side-chains. Importantly, the higher resolution structure has allowed us to examine the nature of the interaction interface in some detail. The structure of the complex is stable over at least 15 ns of unrestrained molecular dynamics simulations and has enabled us to rationalize the pH dependence of binding affinity and the interaction of several key residues.
Interestingly, while the EphA1 SAM domain also interacts with SHIP2 SAM, the homologous SAM domain of EphB2 does not show any interaction, suggesting that SAM heterodimer formation with SHIP2 is specific to members of the A-family of Eph receptors. However, structural modeling based upon the refined EphA2:SHIP2 SAM:SAM complex has allowed us to engineer the EphB2 protein to bind to SHIP2 with a similar binding affinity to the EphA1 and -A2 SAM complex with SHIP2. Furthermore, in the context of full length EphA2 expression in cells, mutagenesis that increased or decreased the binding affinity between EphA2 and SHIP2 SAM domains in biophysical assays also caused concordant changes in the association between the two proteins in vivo. Functionally the perturbation of the EphA2-SHIP SAM-SAM interactions interfered with induction of chemotactic cell migration by EphA2. The structural insight and functional characterization of SAM domain-mediated EphA2-SHIP2 interactions reported here could lead to new directions in targeting EphA2 in disease processes including cancer.
RESULTS
Assignments and chemical shift mapping of EphA2 and SHIP2 upon complex formation
NMR resonance assignments of the unbound SHIP2 SAM and EphA2 SAM domains were carried out using the standard backbone driven assignment strategy (see Materials and Methods, and Fig. S1). Neither the EphA2 nor the SHIP2 spectra indicate any homo-oligomerization based on sharp resonances for each residue in the protein (up to a protein concentration of 1.5 mM – data not shown). The patterns of chemical shift perturbation, observed upon complex formation in titration experiments, show that the association of the proteins predominantly involves the mid-loop region of the SHIP2 SAM domain as the helices and loops between helices α2, α3 and α4 (Fig. S1 and S2). On the side of the EphA2 SAM domains, residues in α1-α2 and the end-helix region, that is the turn following α4 and the N-terminal region of α5, are involved (Fig. 1B). A binding curve based on the titration with unlabeled binding partner was used to estimate a dissociation constant, KD, of approximately 10 μM for the EphA2 – SHIP2 SAM:SAM interaction (consistent with ITC data, see below).
Intermolecular NOEs between EphA2 SAM and SHIP2 SAM were obtained from 3D NOESY-HSQC experiments (see Materials and Methods). In the complex comprised of uniformly 2H-, 13C-, and 15N-labeled EphA2 SAM and an unlabeled SHIP2 SAM, only 15N bound protons can be observed from EphA2 SAM and thus NOEs to sidechain protons must be to those of the unlabeled binding partner, SHIP2 SAM. A total of 5 intermolecular NOEs were found: EphA2 G953 NH – SHIP2 N1220 Hβ, EphA2 H954 NH – SHIP2 H1219 Hβ, EphA2 H954 NH – SHIP2 N1220 Hβ, EphA2 Q955 NH – SHIP2 H1219 Hβ and EphA2 Q955 NH – SHIP2 N1220 Hβ (Fig. S5). These NOEs were used as unambiguous restraints in the HADDOCK calculations with a distance range depending on NOE intensity (3 to 7 Å). Longer range NOEs could be detected due to favorable relaxation behavior in the perdeuterated protein.
pH titration by NMR and ITC
The charge-state of histidine residues can be important for complex formation. Thus, a series of 1H-15N HSQC spectra were recorded on the EphA2-SHIP2 SAM:SAM complexes as well as on the free proteins as a function of pH. Histidines H954 of EphA2 and H1219 of SHIP2 SAM participate in the protein-protein interaction. Based on these results (Fig. S3, S4), we set all histidines in the SAM:SAM complex calculations and simulations to be uncharged, matching our experimental condition of pH 6.8. The dissociation constant (Kd), measured by ITC, shows a tendency to decrease as pH is increased, indicating that wild-type EphA2 and SHIP2 SAM domains bind more strongly at higher pH (Table S1). Binding affinities were also measured using ITC at various salt concentrations (Table S2), showing that the binding affinities are significantly decreased when the Na salt concentration is larger than 50 mM. This implies that electrostatic interactions play an important role for complex formation between EphA2 and SHIP2.
Structure determination of the SAM:SAM complex
The initial structural ensemble of the EphA2-SHIP2 SAM:SAM complex was obtained through HADDOCK2.0 restrained docking calculations (Dominguez et al., 2003) which were performed using chemical shift perturbation (CSP), NOE, and RDC (Table S3) from NMR experiments and the solution structures of EphA2 (PDB ID: 2E8N) and SHIP2 SAM (PDB ID: 2K4P) as input data. The procedure followed the standard protocol with slight modifications as outlined in the Materials and Methods section. 21 ambiguous interaction restraints (AIR) were obtained from CSP data, and 5 unambiguous distance restraints were derived from intermolecular NOE data. 11 residues were active for each EphA2 and SHIP2 SAM, and 13 and 4 were considered passive for EphA2 and SHIP2 SAM, respectively (Table S4). An additional calculation was carried out showing that the unambiguous restraints are important for the structure determination only in a limited way, such as allowing better convergence, also to alternative structures (see Fig. S6, Tables S6, S7 and discussion).
The best 200 solvent refined structures from the HADDOCK2.0 calculations were grouped into three clusters based on pairwise rmsd (Fig. 3A). Structures in the first cluster (cluster 1) represent > 2/3rds of the ensemble with an rmsd of 1.5 Å rmsd its center. The second group (cluster 2 and 3) has an rmsd of 4.0 Å from the first cluster center. A structural comparison between minimum energy structures of the three clusters is shown in Fig. 3B,C. Although it is hard to distinguish clusters by the way that the experimental restraints are satisfied (i.e. by rms deviations, see Table S5), we note that the 15 lowest energy structures as evaluated by the HADDOCK2.0 scoring function all belong to cluster 1 (structural statistics are given in Table 1).
Figure 3.

Ensemble of 200 HADDOCK structures obtained from NMR restraints. (A) Plot of HADDOCK score versus rmsd. Three clusters are obtained. One of them is centered at about 1.5 Å and the other two clusters are overlapped at an rmsd of 4 Å, respectively. (B) A comparison of structures between HADDOCK clusters; green: cluster 1, blue: cluster 2, and magenta: cluster 3. Molecules of cluster 2 and 3 are aligned to EphA2 SAM of the cluster 1. (C) A schematic diagram of conformational differences between the clusters. Only H5 helices of EphA2 and SHIP2 are shown, and arrows show the C-terminal direction. See also Figures S3, S4, S6, S8, and Tables S1, S2, S5, S6 and S7.
Table 1.
Structural statistics and ensemble quality of EphA2:SHIP2 SAM:SAM complex.
| HADDOCKa | HADDOCKb | MDa | MDb | |
|---|---|---|---|---|
| RMSDs from the mean structure (Å) | ||||
| RMSD of backbone atoms | 1.0 ± 0.4 | 1.2 ± 0.4 | 2.7 ± 0.3 | 2.5 ± 0.4 |
| RMSD of heavy atoms | 1.2 ± 0.4 | 1.5 ± 0.4 | 2.8 ± 0.3 | 2.6 ± 0.4 |
| MOLPROBITY packing Z-score | 0.72 | 1.53 | 0.68 | −0.89 |
|
| ||||
| RMS deviations | ||||
| NOE distances (Å) | 0.31 ± 0.03 | 0.22 ± 0.07 | 0.78 ± 0.18 | 0.23 ± 0.07 |
| Bonds (Å) | 1.30×10⁻²± 2.1×10⁻⁴ | 1.61×10⁻²± 7.7×10⁻⁵ | 1.43×10⁻²± 1.1×10⁻⁴ | 1.65×10⁻²± 8.6×10⁻⁵ |
| Angles (°) | 0.71 ± 0.09 | 0.48 ± 0.01 | 1.09 ± 0.20 | 0.48 ± 0.01 |
| Impropers (°) | 1.15 ± 0.13 | 0.67 ± 0.02 | 1.53 ± 0.21 | 0.65 ± 0.03 |
| Q-factor of RDC (%) | ||||
| sani1 | 26.8 ± 1.7 | 28.4 ± 1.0 | 29.1 ± 2.4 | 29.1 ± 1.0 |
| sani2 | 28.8 ± 1.2 | 29.9 ± 1.3 | 31.2 ± 4.1 | 31.1 ± 1.6 |
|
| ||||
| Ramachandran analysisc | ||||
| Most favored regions | 87.2% | 88.7% | 92.5% | 90.9% |
| Allowed regions | 12.5% | 11.0% | 7.3% | 8.8% |
| Generously allowed regions | 0.3% | 0.2% | 0.2% | 0.3% |
| Disallowed regions | 0.0% | 0.0 | 0.0% | 0.0% |
: statistics were calculated in XPLOR-NIH (only the orientation of RDC axes were refined) for 15 cluster1 structures from HADDOCK and from the MD trajectory (1 – 15 ns)
: obtained from the refinement using XPLOR-NIH of the structures in a).
: PROCHECK (Laskowski et al., 1996).
See also Tables S3, S4 and S5.
However, to further study experimentally which ensemble is the most representative, we examined individual sidechain interactions at the protein-protein interface in each cluster. For this, NMR and ITC measurements were performed on several swap mutant pairs of EphA2 and SHIP2 such as K917D-D1224K, and K917E-E1226K for cluster 1, K956E-E1238K and K917D-D1230K for cluster 2 and 3 (Fig. 4A–C). The concept of this mutagenesis will be described elsewhere in detail. Briefly, salt bridges that are characteristic of structures in cluster 1, 2, or 3 can be tested by a residue swap. If the selective pair is incorrect, this swap mutation should destabilize the complex, leading to a disruption or to a significant decrease of the binding affinity. If the pairing is correct, however, then near native-like binding affinity should be observed upon the swap. As listed in Table 2, swap mutant pairs for the cluster 1, K917D-D1224K, and K917E-E1226K showed a near native binding affinity. By contrast swap mutant pairs for the cluster 2 and 3, K956E-E1238K and K917D-D1230K, lead to a substantial disruption of binding. The swap mutant pair for the cluster 1 & 2, K956D-D1235K showed a near native binding affinity, but K956E-E1238K for cluster 2 and 3 showed no binding. The structures in HADDOCK cluster 2 showed a concurrent binding of K956 of EphA2 with D1235 and E1238 of SHIP2 SAM (Fig. 4B), but swap mutagenesis did not provide evidence for an interaction between K956 and E1238. In addition, K917 of EphA2 does not interact with either D1223 or D1224 of SHIP2 in the cluster 2, while experimentally the K917D-D1224K mutant complex implies an appreciable salt-bridge interaction between these residues. The above observations, thus confirm that the EphA2-SHIP2 SAM:SAM complex has predominantly the conformation of the cluster 1 structures.
Figure 4.

Details of the binding interface of the EphA2 and SHIP2 complex for the three HADDOCK clusters. Summary of charge pair interactions (A–D) and hydrophobic interactions involving aromatic residues (E–H) between EphA2 and SHIP2 interface in different configurations. Hydrogen bonds and salt-bridges are shown as dashed lines and hydrophobic surfaces are shown as combs. (A, E) cluster 1; (B, F) cluster 2; (C,G) cluster 3 and (D,H) model reported by the Pellecchia group (Leone et al., 2008). See also Figures S7, S9, S10 and S11.
Table 2.
Thermodynamic parameters of wild-type and swap mutant EphA2:SHIP2 SAM:SAM complexes measured by ITC.
| EphA2 | SHIP2 | Kd (μM) | ΔH (kcal/mol) | TΔS (kcal/mol) | ΔG (kcal/mol) | HADDOCK cluster |
|---|---|---|---|---|---|---|
| WT | WT | 5.2 ± 1.2 | −2.5 | 4.7 | −7.2 | |
| K917D | WT | 9.1 ± 5.7 | −0.85 | 5.9 | −6.8 | |
| K956D | WT | > 50 | −0.3 | 5.4 | −5.7 | |
| K956E | WT | > 50 | −0.3 | 5.5 | −5.8 | |
|
| ||||||
| K917D | D1224K | 10.0 ± 2.0 | −2.5 | 4.3 | −6.8 | 1 |
| K917E | E1226K | 15.4 ± 1.9 | −2.0 | 4.6 | −7.6 | 1 |
| K956D | D1235K | 7.0 ± 3.0 | −0.8 | 6.2 | −7.0 | 1 and 2 |
| K956E | E1238K | Non-binding | - | - | - | 2 and 3 |
| K917D | D1230K | Non-binding | - | - | - | 3 |
Kd: dissociation constant, ΔH: enthalpy of binding, ΔS: entropy of binding, ΔG: Gibbs free energy of binding
The program RosettaDock (Lyskov and Gray, 2008) can be used to check the energy landscape around a structure of a complex. The 10 lowest HADDOCK score complex structures were used from each cluster as input docking calculation as described in the Materials and Methods. The results (Fig. S7) confirm that the structures are in an energy minimum, but that the energy landscape around cluster 1 is consistent with a deep minimum, whereas structures originating from cluster 2 are able to sample an alternative docked state that looks similar to the structures in cluster 1. This potential for interconversion between clusters requires considerable relative domain motion in the SAM:SAM complex.
Dynamic nature of the complex
The interaction between the EphA2 SAM domain and SHIP2 SAM domain uses the EH-ML binding topology and is primarily driven by polar and electrostatic contacts. The EH surface of EphA2 is composed by positively charged residues such as K917, K956, and R957 whereas the ML surface of SHIP2 SAM is composed of a relatively larger number of negatively charged residues spread almost evenly on the whole ML surface. This distribution is likely to lead to many degenerate contacts, and, as we saw, is consistent with several solutions to the structure of the complex (clusters1–3) which at first sight satisfy the restraints similarly well. As studies of several enzymes and cell signaling proteins have shown, this access to possible alternative protein states may already be manifest in the fluctuations around each structure. The structural ensembles obtained from HADDOCK calculation show a variation in the orientation of the two domains, most easily shown by a tilt of the two helices, α5, with the respect to one another. The average angle between α5 helices of EphA2 and SHIP2 is measured as 67.6° ± 11.3°, 15.8° ± 5.5°, 105.0° ± 6.2° in 15-structure ensembles of the cluster 1, 2, and 3, respectively (Fig 3B,C).
In order to examine the presence of fluctuations further we carried out a molecular dynamics simulation in the absence of the experimental restraints using NAMD (Phillips et al., 2005), followed by perturbative docking in RosettaDock (see Materials and Methods). As shown in Fig. 5B and Table 1, the unrestrained calculations sample a slightly wider space, but still satisfy the great majority of the experimental restraints. The unrestrained MD simulations also maintain the solvent accessible surface that is buried upon complex formation between the two proteins (Fig. 5C). The fluctuations of the complex and of the two proteins within it are substantial, as measured by rmsd from the starting structure (Fig. 5D). Plots of the perturbative docking calculations are shown in Fig. 6, confirming that the lowest energy structure remains near a minimum of the docking energy landscape for much, but not all of the MD simulation (complexes at 0 and 15 ns have a docking funnel as the energy landscape, structures at 5 and 10 ns do not, or have alternate energy minima). The structure at 10 ns which has a large rmsd of 4.0 Å also does not satisfy the restraints well (Q factors 37% and 46% for the RDCs, NOE rms of 0.69 Å) compared to the average (Table 1). We discuss below how such departures from the minimum in the landscape of the complex may arise.
Figure 5.
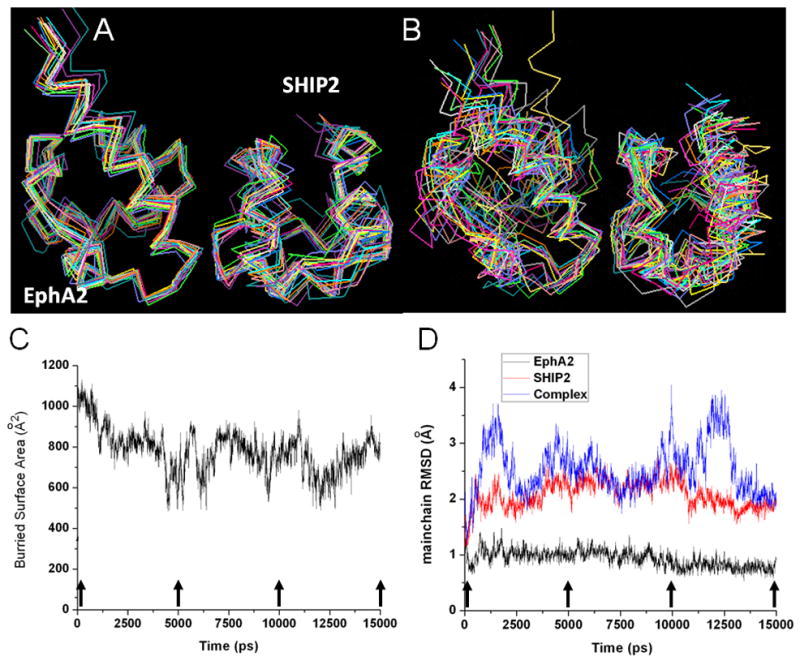
EphA2:SHIP2 SAM:SAM complex ensembles and its behavior during unrestrained MD simulation. (A) An ensemble of 15 lowest scored HADDOCK structures of cluster 1 after xplor-nih refinement. (B) 15 structures from unrestrained MD calculation shown at 1 ns simulation interval. (C) Buried surface area of the complex and (D) Changes in mainchain structure of EphA2, SHIP2, and the complex (rmsd of Calpha from starting complex structure) during MD simulation. See also Figure S7.
Figure 6.

RosettaDock score for perturbative docking of selected simulation coordinate sets with reference to lowest energy structure found. The results imply that the complex undergoes considerable fluctuations. See also Figure S7.
Perturbation to the unbound SAM structures upon complex formation
Protein interactions can induce conformational changes in the binding partners (Goh et al., 2004). Comparison of the free and bound mainchain structures show that the conformational changes are slightly different in each cluster (Fig. S8). However, perturbations that occur in the cluster 1 structures are localized to regions which are in contact and are consistent with the experimentally observed chemical shift perturbations that are localized to these regions. Thus, again cluster 1 is more consistent than the others with the experimental data.
Measurements of binding characteristics of wild-type and mutant complexes
The sidechain interaction between EphA2 R950 and SHIP2 H1219 stands out, in that it rationalizes the pH dependence of the binding affinity (see above, Fig. S3, S4, Table S1). At low pH the two sidechains are both positively charged and would repel each other, whereas at neutral pH, including the situation seen in our structure calculations (and preserved in the MD run) the two residues appear to form a hydrogen bond (Fig. S9). In order to test the contribution of these sidechains to the binding affinities, we measured the interactions of a number of mutant proteins by ITC (Fig. S10, Table 3). The mutation of R950 in EphA2 and of H1219 in SHIP2 enhanced the binding. In particular, R950T and separately H1219S enhanced the interaction almost 4-fold. In the wild type proteins this could be due to a lack of repulsion of positive charges between R950 and H1219 that is still partially positively charged at a pH 6.8. Titration of H1219 from a positive to a neutral sidechain would explain the higher binding affinity at higher pH. The hydrogen bond between R950 and H1219 formed in our calculations likely stabilizes the heterodimeric structure of cluster 1 over those of other clusters, where this interaction cannot form. The binding affinity of an EphA2 R950E mutant with SHIP2 H1219E – now both sidechains are negatively charged – is reduced.
Table 3.
Thermodynamic parameters of wild-type and mutant EphA2:SHIP2 SAM:SAM complex measured by ITC.
| Eph SAM domain | SHIP2 | Kd (μM) | ΔH (kcal/mol) | TΔS (kcal/mol) | ΔG (kcal/mol) |
|---|---|---|---|---|---|
| I. Characterizing SAM:SAM interaction | |||||
| EphA2 WT | WT | 5.2 ± 1.2 | −2.5 | 4.7 | −7.2 |
| EphA2 WT | D1223A/D1224A | Non-binding | - | - | - |
| EphA1 | WT | 3.8 ± 0.4 | −3.6 | 3.8 | −7.4 |
|
| |||||
| II. Interactions between ion pairs EphA2:SHIP2 mutants | |||||
| P952A/K956E | WT | Non-binding | - | - | - |
| K917E/P952A/K956E | WT | Non-binding | - | - | - |
| R950E | WT | 1.7 ± 0.3 | −2.4 | 5.5 | −7.9 |
| R950E | H1219R | 1.3 ± 0.1 | −5.0 | 3.0 | −8.0 |
| R950E | H1219E | 11.2 ± 2.7 | −7.5 | −0.8 | −6.7 |
| WT | H1219E | 4.0 ± 0.4 | −5.5 | 1.8 | −7.3 |
|
| |||||
| III. Interaction manipulation | |||||
| EphB2 | WT | Non-binding | - | - | - |
| EphB2 mutanta | WT | 7.6 ± 2.5 | −0.9 | 6.1 | −7.0 |
| EphA2 Y960N | WT | 3.1 ± 0.4 | −3.0 | 4.5 | −7.5 |
| EphA2 K945L | WT | 1.3 ± 0.2 | −2.1 | 5.9 | −8.0 |
| EphA2 K945L/Y960N | WT | 1.6 ± 0.6 | −2.0 | 5.9 | −7.9 |
: EphB2 penta-mutant, L954K/T959R/A961P/K966R/N969Y. The mutated residues correspond to EphA2 K945, R950, P952, R957 and Y960.
See also Figures S3, S4, S9, S10 and S11.
We also made other mutations that are expected to disrupt the interaction between the two SAM domains. For instance, the binding affinities of EphA2 mutants, P952A/K956E and K917E/P952A/K956E (mimicking key residues that are different in EphA2 SAM) to wild-type SHIP2 are so poor that they become non-detectable by ITC. Similarly wild-type EphA2 no longer binds the SHIP2 double mutant, D1223A/D1224A (Table 3). Also 1H-15N HSQC spectra confirm that this mutant is not bound by the WT EphA2 SAM domain with appreciable affinity (suggesting a Kd > mM, data not shown). Furthermore, two residues, K945 and Y960, that were thought to be contact residues for the complex calculation with ambiguous restraints alone (Leone et al., 2008), were mutated to Leu and Asn, respectively. The binding affinities of three mutants, K945L, Y960N, and K945L/Y960N with wild-type SHIP2 were measured using ITC. We find that all mutants still interacted well with wild-type SHIP2 SAM (Table 3), indicating these two sidechains do not contribute to complex formation in a critical manner. This result is consistent with our complex structure, since K945 and Y960 are located > 5 Å away from the EH region of EphA2, though Y960 may form a weak hydrogen bond via its hydroxyl. Finally, we have used the knowledge obtained from the structure of the EphA2-SHIP2 SAM:SAM complex to successfully engineer binding affinity for SHIP2 SAM into the non-binding SAM domain of EphB2 (Fig. S11, Table 3).
Loss of SHIP2 association leads to hypersensitivity to ligand-induced EphA2 catalytic activation and degradation
The in vitro mutagenesis studies above using the purified proteins identified key residues that contribute to SHIP2-EphA2 SAM:SAM interaction. Next we investigated whether mutations in the same residues that alter the affinities of the interaction between the purified proteins also impact EphA2-SHIP2 association in the context of intact cells, and if so, what the possible biological effects might be. For this purpose, we picked two mutants, R950T and K917E/P952A/K956E that enhanced and disrupted the SAM-SAM interactions, respectively (Table 3). U87 glioma cells were infected with WT, or R950T and K917E/P952A/K956E mutant EphA2. U87 cell express low level of endogenous EphA2. Infection with retrovirus expressing WT or mutant EphA2 did not change the total SHIP2 level in these cells (data not shown). Cells starved overnight were lysed, and ephrin-A1-Fc was used to precipitate EphA2 (Fc was used control). As shown in Fig. 7A, SHIP2 was detected in ephrin-A1-Fc immunoprecipitates from WT EphA2-expressing cells. Consistent with ITC results, the triple mutant showed significantly reduced binding with SHIP2, whereas the R950T mutant displayed about two-fold enhanced binding compared to the wild type EphA2. These results in cells are in concordance with the biophysical analyses with purified proteins (Table 3).
Figure 7.

Cellular characterization of loss and gain of function EphA2 SAM mutants. A, EphA2 R950T promotes SHIP2 association, while the K917/P952A/K956E triple mutant (TM) attenuates the association. Serum-starved U87 cells infected with WT, or R950T and the triple mutant were lysed. EphA2 was precipitated with ephrin-A1-Fc and blotted sequentially for SHIP2 and EphA2. Equal amount of wild type EphA2 lysate from same experiment was immunoprecipitated with Fc as negative control. B, The band densities of SHIP2 from A were normalized to the corresponding total EphA2. C, EphA2 kinase activation of the triple mutant by ephrin-A1 shows hypersensitivity to ligand stimulation and accelerated degradation. HEK 293 cells expressing WT or mutant EphA2 were stimulated with ephrin-A1-Fc for indicated times. Cell lysates were blotted with the indicated antibodies. Quantitative analyses of EphA2 for D, degradation and E, activation following ligand stimulation. F, Ectopic overexpression of WT, but of not the mutant EphA2, enhances serum-induced chemotaxis, plotted as the number of migratory cells. HEK 293 cells were subjected to Boyden chamber cell migration assay. Cell numbers from 6 random fields were counted. Numbers were normalizes by vector. Numbers represent mean ± S.D from 3 independent experiments. *p<0.05. See also Figure S10.
Next we examined the effects of EphA2 SAM domain mutations on the ligand-induced activation of EphA2 tyrosine kinase catalytic activity and the ensuing ligand-induced degradation in HEK 293 cells. WT EphA2 in HEK 293 cells showed a low level of basal activation and became rapidly phosphorylated after ligand stimulation. Significant degradation of WT EphA2 took place around 1 hour after stimulation (Fig. 7C). In contrast, the EphA2 triple mutant which had a highly compromised level of interaction with SHIP2 showed dramatically accelerated degradation. Significant degradation was observed as early as 10 minutes after ligand stimulation; by 60 minutes most of the EphA2 had been degraded. R950T mutant, which binds to SHIP2 with higher affinity, displayed moderately increased retention, consistent with reduced degradation due to increased stability of the complex. The results were quantified in Fig. 7D and provide direct evidence that the EphA2 interaction with SHIP2 through SAM domains plays an essential role in regulating EphA2 degradation/endocytosis. Interestingly, quantitative analyses revealed that the tyrosine kinase catalytic activities of the triple mutant were activated to a much higher degree than the wild type EphA2 following ligand stimulation (Fig. 7E). These data suggest that the increased degradation of the triple mutant may result from its hypersensitivity to ligand-induced activation.
In a recent report, EphA2 overexpression is shown to promote chemotactic cell migration in a ligand-independent manner (Miao et al., 2009). To further evaluate the functional significance of the EphA2/SHIP interaction, we determined whether the triple and R950T mutants affect cell migration. Consistent with earlier studies, overexpression of WT EphA2 alone significantly enhanced serum-induced chemotactic migration of HEK293E cells. In contrast, the triple mutant compromised in SHIP2 binding failed to promote cell migration, suggesting a positive role of SHIP2 in facilitating the pro-migratory function of EphA2 (Fig. 7F). Unexpectedly, the R950T mutant that enhances SHIP2 binding also displayed diminished ability to promote cell migration, to the same extent as the loss of function triple mutant. The data indicate that a precise affinity of the SHIP2-EphA2 interaction is required in order to regulate cell migration; either too much or too little association is incompatible with an optimal control of cell motility.
DISCUSSION
Features of the EphA2:SHIP2 SAM:SAM interface
Interactions between Eph-like SAM domains need to encode both the wanted topology of the interaction (polymer vs. heterodimer, End-Helix with Mid-Helix interactions compared to others). Furthermore, the interactions need to generate specificity that only allows certain Eph SAM domains to interact with each other or with other SAM domains, such as that from SHIP2. Thus, the characterization of the features that contribute to these two aspects of protein interactions, affinity and specificity, is of critical importance. A detailed understanding of the complex formation, for example, can advance the design of effective therapeutic agents and analysis of the signal transduction networks (e.g. Moreira et al., 2007). Various techniques are available for the elucidation of the structural and thermodynamic determinants of protein-protein assocation. Amongst of them, solution NMR is a powerful tool for mapping interactions under a variety of easily manipulated conditions. Several NMR parameters are directly related to the complex structures and their dynamics, including chemical shift perturbation, orientational and spatial couplings between residues (Zuiderweg, 2002). In the present study, we observe chemical shift perturbations, rather than substantial resonance line-broadening or the emergence of a new set of resonances. This indicates a fast exchange dynamics between monomers and heterodimers. Fast association/dissociation events have been found for several binding interfaces that are largely electrostatic by nature (Gabdoulline and Wade, 2001; Schreiber and Fersht, 1996; Zhou, 2003). Slower processes are associated with the release or solvation of hydrophobic side chains and these appear to be minimized in the structure of this complex.
Polar contacts predominate at the EphA2:SHIP2 SAM interface and it, therefore, only partially conforms to a “hydrophobic plug” picture that has been emerging as a general theme for many protein-protein interactions (Chen et al., 1993; Kuang and Rubenstein, 1997). In the “hydrophobic plug”, a non-polar patch is surrounded by polar/or charged interacting residues at the protein surface. In the case of this SAM heterodimer, the hydrophobic contacts are slightly off-set (with Y960 forming a rather exposed side). F1227 and W1222 are candidates in SHIP2 SAM for a hydrophobic interaction. These residues are partially buried in the SHIP2 SAM structure and may contribute by offset-parallel or edge-on face (T-) stacking to the complex formation for cluster 1 and 2, respectively (See Fig. 4D,E). In cluster 3 (Fig. 4F), only an Arg957 cation- Trp1222 π interaction is seen. Together with the reduced number polar interactions, this is consistent with the view that cluster3 is the least stable and less likely complex configuration.
The binding affinity of the SAM domains studied here is rather modest (Kd of 5.2 μM) compared to cases of strong binding involving antigens and antibodies, with binding affinities in the nM or sub nM range. In the present study, the nature of the interface and also the molecular dynamics simulation provides an indication how this modest affinity may arise. Unrestrained MD simulation show a considerable fluctuation in the buried surface area and rmsd values of the complex during 15 ns simulation (Figs. 5, 6). The buried surface area of the complex has a value of ca. 800 Å2 for most of simulation time except for narrow time periods at around 5 ns, 10 ns, and 12 ns of the simulation with fluctuations between 500 – 800 Å2, indicating the increase of the intermolecular distance and also decrease of the binding strength (Fig. 5C). Also rmsd from the average complex structure fluctuates beyond 3 Å at 2, 4, 10, and 12 ns into the simulation. Similar phenomena are observed when the structures sampled in the MD simulation are redocked using RosettaDock. For the starting structure at 0 ns, there are two minima in the energy landscape. The first one is located in the region of < 5 Å rmsd, and the second is at 10 Å. At a time of 10 ns, the structure has moved from the first to the second energy minimum, and then returns back to the first minimum after 10 ns. The significant structural difference between these two minima is a rotation of SHIP2 relative to the EphA2 in direction of the cluster 2 structures, refined by HADDOCK (Fig. 3). The ensemble of structures in cluster 1 from the HADDOCK calculations appears to capture all the information we have from NMR and also from site directed mutagenesis. The use of a different forcefield and different program, xplor-nih, to further refine the ensemble from HADDOCK, did not result in structures that are any different (see Table 1), showing that the structural ensemble is rather robust with respect to the experimental restraints. It should also be noted that the 5 unambiguous directly observed NOE restraints are not strictly necessary for the complex calculations as an essentially identical cluster 1 ensemble is calculated without them (Fig. S6, Tables S6, S7). Only a limited set of NOEs were collected with the intention of breaking the remaining degeneracy of orientations that are possible by the RDC restraints. Notably the NOEs are concentrated in one region of the structures as the region of closest contact between EphA2 mainchain amides (the non-hydrogen bonded amides of the first helical turn of helix 5) and sidechains in SHIP2 (at the beginning of helix 2). This region may be seen as a pivoting point which helps to orientate and stabilize structures in cluster 2 and 3. The range of RDCs is not wide (reflected in Q-factors of around 30%) and RDCs are likely to be partially averaged by the presence of lower level populations of structures in the other, alternative configurations (Sun et al. 2011). Typically such clusters would be ignored, but as we discuss below, cluster 2 bears resemblance to a model previously proposed for the complex and there is evidence from molecular dynamics and docking simulations that this cluster may be populated.
The EphA2 – SHIP2 SAM:SAM interface can be described as follows: The domains interact with each other using EH/ML interface, a topological feature that is broadly similar to previously observed heterotypic SAM-SAM complexes (Kim et al., 2002; Leone et al., 2008; Rajakulendran et al., 2008; Tran et al., 2002). Most of the residues that comprise the EH surface of EphA2 are positively charged while the ML surface of SHIP2 are highly negatively charged. Positively charged EH surface residues K917, K956, and R957 engage with the negatively charged residues of SHIP2 such as D1223, D1224, and D1235 located on ML surface in salt-bridge interactions (Fig. 2). Specifically, in the complex, K917 of EphA2 engages with D1223 and D1224 of SHIP2 in multiple salt-bridge interactions. In some of the structures, the sidechain of K917 is flipped to make contacts with D1226. K956 of EphA2 interacts with D1235 of SHIP2, and R957 of EphA2 makes a salt-bridge with D1224 of SHIP2 in the HADDOCK cluster 1 (Fig. 4A). Apart from these salt-bridge and hydrogen bond interactions amongst polar groups, the structure of the complex shows that there are contacts also between other, non-charged sidechains. G953 which is the N-terminal residue of helix α5 of EphA2 is close to N1220 of SHIP2 located at the C-terminus of helix α2 of SHIP2 SAM. In addition, the sidechain of S961 of EphA2 is close to the phenyl ring of F1227 of SHIP2.
A preliminary structure of EphA2-SHIP2 heterodimer complex was earlier reported by another laboratory (Leone et al., 2008). The structure was calculated using HADDOCK1.3 and only used ambiguous restraints derived from NMR chemical shift perturbation. The derived model (the lowest energy structure of 4 different clusters) was not deposited in the Protein Data Bank. The residue pairs involved in contacts between EphA2 and SHIP2 are shown in Fig. 4D. Multiple salt-bridge interactions also can be found such as K917-E1226, K956-D1230, K956-D1235, and R957-D1223. These salt-bridges are a mixture of those of our cluster 1 and 2. However, the contact between EphA2 K956 and SHIP2 D1230 seen in this low resolution structure is not seen in any of our structures. Since D1230 is located in the middle of the ML motif of SHIP2 and K956 of EphA2 forms one of the ends of the EH surface, α5 helices of EphA2 and SHIP2 should be almost parallel to contact the above two residues with each other (Fig. 3C). This conformation is similar with that of our cluster 2, except that in this cluster K917 cannot interact with any residue of SHIP2 because it is too far from SHIP2 SAM. We tested whether the sidechains of residue 917 of EphA2 and of residue 1230 of SHIP2 can be swapped across the interface. However, the two mutant proteins do not bind to one another as detected by ITC. Moreover, an NMR HSQC experiment carried out at ~ 10-fold higher protein concentrations on the mixture of EphA2 K956D and SHIP2 D1230K in the present study report only a very weak interaction between the mutants (data not shown), suggesting that K956 of EphA2 rarely interacts with D1230 of SHIP2 in the wild-type complex.
Similarly to ours, the structure of the Pellecchia laboratory was supported by a number of sidechain mutations, such as K917A, R957A, and Y960S. It should be noted that all of these mutations are also consistent with our cluster 1 structures. The discrepancies between the two studies are likely to arise from nature of the restraints as well as the different restraints that go into the structure calculations. The different pH of the studies is likely to be a contributing factor and it is possible that a structure, similar to the Leone et al., model, could be populated to a greater extent under the different, albeit less physiological pH for the cellular cytoplasm.
Comparison with other SAM-SAM heterodimers
Compared to the EphA2:SHIP2 SAM:SAM complex, the interface of the hCNK2:dHYP x-ray crystal structure is essentially reversed in terms of the charged residues involved (Figs. 1 and 2). The end-helix providing hCNK2 domain is largely negatively charged, whereas the mid-helix region of dHYP SAM has a net positive charge or Hydrogen-bond donor characteristics. As in the EphA2:SHIP2 complex the involvement of hydrophobic contacts is slight, with only two non-polar residues significantly contributing from each side (no aromatic residues are close to the interface). Again, similar to the EphA2:SHIP2 SAM heterodimer, histidine residues are located at the interface. The SAM family conserved histidine residue 954 (EphA2 numbering) near the start of helix 5 in CNK2 is also involved in an equivalent interaction with a residue on HYP. Beyond this, a histidine-arginine contact is observed at the periphery of the interaction surface, similar to that seen for the EphA2:SHIP2 complex (just the pair is swapped between the domains). Given these similarities, it is likely that the hCNK2:dHYP interaction experiences a similar pH dependent behavior as the EphA2:SHIP2 interaction. As a contrasting, the interface of the SAM:SAM heterotypic complex between two other proteins, Byr2 and Ste4, (also with an EH/ML topology) consists largely of hydrophobic residues such as leucine, valine, and isoleucine, with only a minor contribution suggested by a few charged/polar residues at the side of the interface (Ramachander and Bowie, 2004).
Towards an engineering of SAM:SAM heterodimer interactions
The structural insights into the interaction between SHIP2 and EphA2 SAM domains are critical for our detailed understanding of their affinity and specificity. Mutations that can be introduced into cells, or that occur in disease, should modulate the interaction and consequently would affect EphA2 signaling. For example, the knowledge can be used to manipulate the tendency of SAM domains to form homo- and heterotypic interactions. We demonstrated the latter by adding SHIP2 binding affinity to EphB2. EphB2 SAM domain has been known to form a homodimer (Thanos et al., 1999b), but we did not find any appreciable EphB2 SAM binding affinity to SHIP2 SAM up to a concentration of 1 mM by solution NMR (data not shown). Using the multiple sequence alignment between EphA2, -B2 and other Eph-like SAM domains, five residues: L954, T959, A961, K966, and N969 (EphB2 numbering) were mutated to Lys, Arg, Pro, Arg, and Tyr, (the sidechains found in EphA2) respectively and this successfully added SHIP2-binding affinity to EphB2 SAM, as confirmed by NMR and ITC (Fig. S10). The designed binding affinity, with a KD at 7.6 μM, is similar to that of the complex between EphA2 and SHIP2 wild-type SAM domains (Table 3). EphB2 and SHIP2 specific assays are under development to test this new interaction in cells.
pH Dependence of SAM:SAM heterodimer formation, fluctuations and functional implications
The binding affinity of the EphA2-SHIP2 SAM:SAM interaction is rather modest in solution; however, as seen in other systems, such an affinity is highly significant when the proteins are localized at a cellular membrane (e.g. Giesen et al., 1991). SHIP2, is a member of the inositol 5-phosphatase family which converts PIP3(3,4,5) to PIP2(3,4). As these lipids are typically confined to bilayer membranes, binding of SHIP2 to the transmembrane receptor EphA2 would serve to localize the enzyme to its substrate. The effective concentration of both EphA2 and SHIP2 SAM domains may, in fact, be high enough for a constitutive association. On the other hand, the SAM domains are attached to other protein domains which are likely to determine their orientation to the membrane and their relative orientation towards each other. Thus, there could be interactions that oppose the straightforward association of the two SAM domains. Both extreme scenarios are unlikely, however, given our observed correspondence of binding affinity in vitro and cellular activity.
The variation of binding affinity with pH is also intriguing in this context, as cells are known to alter their intracellular pH, leading to a modest acidification of the cytoplasm upon metabolic stress or stimulation. For example, the stimulation of cells of the rat leukemia line RBL-2H3 by antigen, or by a calcium ionophore, have been known to cause a small decrease in the cell’s cytosolic pH (Gertler and Pecht, 1988). In addition, it has been reported that the internalization of certain peptides (Lee et al., 2009) and that human platelet metabolism (Baker et al., 2001) are also pH-dependent. A regulatory role for pH is becoming established for cell migration, including in cancer (Frantz et al., 2007; Martin et al., 2011). Similarly, the pH sensitivity of the binding affinity observed in the present work is likely to play a regulatory role in Eph and/or SHIP2 mediated signal transduction in the cell.
EphA2-SHIP2 interaction regulates chemoatactic cell migration and responsiveness to ligand stimulation
While the SHIP2 interaction with EphA2 through SAM domains is shown to regulate endocytosis of EphA2 (Zhuang et al., 2007), the underlying molecular mechanisms remains to be completely understood. We found here that a mutant EphA2 that is compromised in recruiting SHIP2 displayed dramatically enhanced responsiveness to ephrin-A1-induced activation of EphA2 catalytic functions. How the kinase function of EphA2 is suppressed in the SHIP2-EphA2 complex is unclear at present. One possibility is the steric hindrance of EphA2 multimerization upon ligand stimulation. An inhibitory role of SAM domain in regulating catalytic function has been noticed for EphA4, as the deletion of the EphA4 SAM domain leads to constitutive activation of EphA4 tyrosine kinase catalytic function (Park et al., 2004). It will be interesting to see if SHIP2 recruitment also contributes to the negative regulation of EphA4 or EphA2 receptor activation.
We found recently that EphA2 has diametrically opposing roles in regulating tumor cell migration and invasion (Miao et al., 2009). In the presence of the ligand, the activation of EphA2 suppresses cell migration. In contrast, when EphA2 is not occupied by its cognate ligands, it stimulates cell migration. The latter effect requires Akt-mediated phosphorylation on serine 897 in the kinase-SAM linker region. We found here that SHIP2 association with EphA2 is required for EphA2 ligand-independent stimulation of cell migration. Akt is activated by PI-3 kinase that phosphorylates PI(4,5)P2 to generate PI(3,4,5)P3, which is rapidly dephosphorylated by phosphoinositide 5-phosphatase, including SHIP2, producing PI(3,4)P2 (Ooms et al., 2009). The PI3K-SHIP2-AKT-EphA2 cross regulation at the leading edge of migrating cells is likely to be complex and remains to be further examined. It is possible that recruitment of SHIP2 to EphA2 can facilitate controlled turnover of phospholipids and enable directional cell motility in response chemoattractants. In keeping with this notion, we found that either too tight association or loss of interaction was detrimental to ligand-independent regulation of cell migration by EphA2. Pathologically, because SHIP2 stimulates the ligand-independent pro-migratory role of EphA2 and attenuates its ligand-dependent tumor suppressor functions, the SHIP2 interaction with EphA2 is likely to have primarily pro-oncogenic effects in tumor cells. As such, the SAM:SAM interface between EphA2 and SHIP2 represent a potential target sites anticancer drug discovery. Similarly, Eph SAM domains designed for particular ranges of binding affinity and specificity, can now be tested in cells and this provides a new avenue for the discovery of an expanded functional role of the interactions and in the future for manipulating specific cell signaling events.
EXPERIMENTAL PROCEDURES
Protein Cloning, Expression and Purification
The SAM domains of human EphA1 (residues 906–976), EphA2 (res. 897–976), EphB2 (res. 906–987) and SHIP2 (res. 1192–1258) were subcloned into pET28 (EMD Biosciences). Mutants were made using QuickChange (Stratagene, Inc.). The pET plasmids were used to transform E. coli BL21(DE3) which was then grown at 37°C in either Luria-Bertani (LB) media or in M9 minimal media supplemented with 15NH4Cl and 12C,2H- or 13C,1H- D-glucose in D2O or H2O, respectively. Cultures were grown to an O.D. of 0.8–1.0 for LB or 0.6–0.8 for M9 and induced with 1 mM IPTG, the bacteria were harvested after further incubation at 25°C for 16 hours. The cells were resuspended in lysis/binding buffer (50 mM sodium phosphate pH 7.4, 150 mM NaCl, 10 mM imidazole, 1 mM DTT) supplemented with Complete™ protease inhibitor (Roche), lysed using sonication and centrifuged. The lysate was loaded onto Ni-NTA resin (Qiagen), washed with the lysis buffer but containing 30 mM imidazole. The protein was eluted with 250 mM imidazole in same buffer, was concentrated and exchanged into NMR buffer (50 mM sodium phosphate pH 6.8, 50 mM NaCl, 4 mM DTT).
NMR Assignment and chemical shift perturbation measurement
All NMR experiments were performed at 25 °C on Bruker Avance 600 MHz or 800 MHz spectrometers equipped with TXI-cryoprobes. Chemical shift assignments were carried out using HNCO, HNCACB, HN(CO)CACB, HN-CC-TOCSY and NH-HH-TOCSY experiments. Protein concentrations of 0.5–1.0 mM were typically used in these exepriments. The assignments of the bound state of SHIP2 SAM were obtained by titration of 0.6 mM 15N, 13C labeled SHIP2 SAM with unlabeled EphA2 SAM. For a titration of 15N, 13C labeled EphA2 SAM with unlabeled SHIP2 SAM, various volumes of a 2 mM SHIP2 SAM stock were added to a sample of 0.8 mM EphA2 SAM. The assignments of the bound state of EphA2 SAM required an additional series of 3D NMR experiments. The perturbation in chemical shift (CSP) was normalized as
Intermolecular NOE measurements
3D NOESY-HSQC (Sattler et al., 1995) experiments, with mixing time of 250ms and 140×80×1024 complex data points, were recorded on two kinds of protein complex samples. A complex of uniformly 2H-, 13C-, and 15N-labeled EphA2 SAM and unlabeled SHIP2 SAM was used in order to detect NOEs between 15NH of EphA2 SAM and 1Hα or sidechain 1H of SHIP2. An EphA2 SAM:SHIP2 SAM complex with 0.6 mM of 2H-labeled EphA2 and 0.7 mM 13C- and 15N-labeled SHIP2 SAM, served as a control for SHIP2 SAM assignments in the complex, as all observed sidechain protons in the complex must arise from SHIP2 SAM.
RDC measurements
In-phase and anti-phase (IPAP) 1H-15N TROSY-HSQC experiments (Ishii et al., 2001) were carried out for the measurements of backbone 1H-15N dipolar couplings, 1DNH of the complex, utilizing 2 samples. One was the complex between 0.8 mM 15N-labeled EphA2 and 1.0 mM unlabeled SHIP2 SAM, and the other was the complex between 0.6 mM 15N-labeled SHIP2 and 0.8 mM unlabeled EphA2 SAM. One alignment medium contained a 5% acrylamide gel (prepared according to Chou et al., 2001) and the other contained 9 mg ml−1 of the filamentous phage pf1 (Profos AG) by mixing the protein solution with 50 mg ml−1 phage. The RDC values were calculated as Δδrdc = Δδmedia − Δδisotropic where Δδmedia is the chemical shift difference of a residue between anti-phase and in-phase TROSY-HSQC spectra of the protein complex in the alignment media. Δδisotropic is the chemical shift difference in absence of the alignment media. Two kinds of RDC restraints were derived from the data; a direct restraint (sani) and an intermolecular intervector projection angle restraint (vean) (Meiler et al., 2000) (Dominguez et al., 2003). Only data for residues located in rigid secondary structure elements were selected and the program PALES (Zweckstetter, 2008) was used with the unbound SAM domains to obtain the initial alignment in each SAM domain. Statistics for RDCs and their fitting are given in the supplementary materials (Table S3). The axial dipolar interaction constant (Da_HN) and the rhombicity (R) of the alignment tensor were then used for the alignment of the domains in the structure calculation. Chemical shift assignments, CSP, NOE and RDC restraints are deposited (BMRB ID xxxx).
Structure determination of the SAM-SAM complex, refinement and validation
The initial structure of the EphA2:SHIP2 heterodimeric SAM complex was determined by restrained docking using HADDOCK2.0 platform (Dominguez et al., 2003; van Dijk and Bonvin, 2006) running CNS1.2. Residues were considered active if their NH chemical shift, Δδnorm changed more than 0.1 ppm upon binding and if their mainchain or sidechain relative accessibilities were over 40% and 50%, respectively, as calculated by NACCESS (Hubbard and Thornton, 1993). Additional neighbors to these residues were included as passive residues if they are solvent accessible (Table S4). Structures of EphA2 SAM (PDB ID 2E8N) and SHIP2 SAM (PDB ID 2K4P) were used as starting coordinates for the docking calculation. CSP data were used as ambiguous restraints and the intermolecular NOEs were used as the unambiguous restraints. RDCs were incorporated as direct restraints (sani), initially using the average of the PALES parameters determined from the unbound SAM structures in one alignment medium, and as intermolecular intervector projection angle restraints (vean) for the second medium (Meiler et al., 2000). The force constant for direct RDC restraints was set to 0.05 kcal mol−1 Hz−1 for the rigid body docking and first cooling step, and 0.5 kcal mol−1Hz −1 for the second and third cooling step of HADDOCK. These values are half of those used in a previous HADDOCK protocol (van Dijk et al., 2005) in order to avoid overfitting RDC restraints relative to the fewer NOE and CSP restraints. In the first stage of the calculation 1000 rigid-body complexes were calculated, followed by semi-flexible simulated annealing for the best 200 structures. These 200 structures were then further refined in a shell of explicitly represented water. The resulting structures were clustered with a 3.0 Å cut-off, yielding three clusters.
We also examined whether the structures and clusters depend on the 5 unambiguous NOEs by carrying out additional calculations that omitted them. The calculations with ambiguous (chemical shift perturbation derived) and RDC restraints only showed two clusters (Fig. S6), the predominant cluster is within 2.5Å of cluster 1. Cluster 2 has the SHIP2 SAM domain 180 flipped relative to cluster 1 showing that degeneracy in RDC determined orientations can still exist with two alignment media (e.g. Matsuda et al., 2004). Importantly, the direct NOEs provide a contact point between the structures that can resolve such ambiguitites. Remarkably, 3 of the 5 NOEs are still satisfied in many of the cluster1 structures that were calculated in their absence (Table S5, S6). Together with the observation that key contacts are identical between the proteins in the two calculations (Fig. S6), the unambiguous NOEs are, therefore, not critically important for the structure calculation.
Two methods were used to test further refinement of the 15 lowest score HADDOCK structures of cluster 1 (calculated with all restraints). Firstly, the structures were input into xplor-nih 2.26, resolvated and gradually heated to 450 K. After 50 ps, they were cooled to 0 K and briefly minimized. This procedure uses an all-atom forcefield and can apply both RDC datasets as SANI restraints with individual axes. Q-factors were estimated as described previously (Ottiger and Bax, 1999). Secondly, the lowest energy structure of cluster1 was solvated in a rectangular box of explicitly represented water (TIP3) and used as starting coordinates for a 15 ns unrestrained molecular dynamics simulation at constant temperature and pressure (300 K and 1 atm). The NAMD molecular dynamics program, ver. 2.6 (Phillips et al., 2005) was used for a brief minimization, the equilibration and the production run following previously established protocols. The standard Particle-Mesh Ewald method was used with periodic boundary conditions to calculate the long-range electrostatic interactions of the system that had been neutralized by addition of counterions. The CHARMM27 all-atom potential function (MacKerell et al., 1998) was used with CMAP correction (Buck et al., 2006). For non-bonded calculations, a cut-off of 12 Å was. All bonds involving hydrogen were kept rigid using SHAKE, allowing 2 fs timesteps. 15 structures at 1 ns intervals were fed back into xplor-nih to test how well they satisfy the restraints even when these were not applied during the MD simulation. To evaluate changes in the energy landscape for complex formation we also examined output structures from the trajectory after 0, 5, 10 and 15 ns simulation with perturbative docking in RosettaDock3.1 (Lyskov and Gray, 2008). The initial perturbation was up to 3° and 8 Å, with a brief energy minimization of the final structures. The ensembles of structures were further analyzed with PROCHECK (Laskowski et al., 1996) and Molprobity (Table 1) RosettaDock was also used in order to evaluate the energy landscape around each of the three clusters. For this 5000 structures were generated for the complex from the 10 lowest HADDOCK score structures. Each final Rosetta score profile was smoothed with a 100 point window size and the 10 smoothed curves of each cluster were averaged (Fig. S7). The correspondence between structural changes observed on binding and chemical shift perturbations is a further point of validation. We averaged 10 structures with the lowest HADDOCK scores from each cluster, and then calculated the Ca rms distance change in the complex when aligned and compared to the unbound SAM structures (Fig. S8).
Isothermal Titration Calorimetry measurements
To study of the effect of pH ITC (isothermal titration calorimetry) measurements were performed at a pH of 5.5, 6.0, 6.5, 6.8, 7.0, 7.5, and 8.0 in phosphate NMR buffer. 300 μL of 40 μM EphA2 SAM in the chamber was titrated with 100 μL of 400 μM SHIP2 SAM in the syringe at each pH value. ITC measurements were carried out using a Microcal iTC200 microcalorimeter. Similar experiments were carried out for the EphA1 and -B2 SAM domains and mutant proteins.
Cell culture, transfection, virus production and infection
Phoenix cells were grown in DMEM containing 2.5 mM l-glutamine, 100 units/ml penicillin, 100 μg/ml streptomycin, and 10% FBS (Hyclone). Cells were maintained at 37°C in a humidified atmosphere of 5% CO2, fed with fresh medium every third day, and split when subconfluent. Phoenix cells were transfected with LZRS-MS-Puro using Lipofectamine Plus reagent (Invitrogen) and selected in 2 μg/ml puromycin (Sigma). Transfected Phoenix cells were grown at 37 °C in selective medium until 50–80% confluent, at which time the medium was replaced with fresh medium without puromycin. Virus-containing medium was collected and filtered through a 0.45-μm filter. Target cells were plated at low density one day prior to infection to ensure single cells and then incubated in virus-containing media in the presence of 8μg/μl polybrene at 33 °C. Target cells were cultured until about 80% confluent and then selected in 0.5–2ug/ml puromycin.
Cell stimulation, immunoprecipitation and immunoblotting
293E cells in logarithmic growth phase were stimulated with 1 μg ml−1 Fc or ephrin-A1–Fc for the indicated times. Cells were lysed in modified RIPA buffer (20 mM Tris, pH 7.4, 120 mM NaCl, 1% Triton X-100, 0.5% sodium deoxycholate, 0.1% SDS, 10% glycerol, 5 mM EDTA, 50 mM NaF, 0.5 mM Na3VO4, and protease inhibitors, including 1 mM phenylmethylsulphonyl fluoride, and 2 microg ml−1 each of aprotinin and leupeptin). Lysates were clarified at 13,000g for 5 min and stored in −80°C. Subconfluent U87 cells were serum-deprived overnight. Cells were lysed for 30 min at 4 °C in modified lysisi buffer (25 mM Tris, pH 7.4, 1% TX-100, 10% glycerol, 25 mM NaF, 25 mM NaF, 50mM NaCl and the protease inhibitors). Lysates were clarified at 13,000g for 5 min. Immunoprecipitations were carried out using EphrinA1-Fc or Fc at 2 μg mg−1 lysate proteins. After 2 hours at 4 °C, 20 μl gamma-Bind beads (Pharmacia) were added for 1 h to capture the EphA2-EphrinA1-Fc complex. The beads were washed three times with immunoprecipitation washing (IPW) buffer (20 mM Tris, pH 7.4, 10% glycerol, 50 mM NaCl, 0.2% Triton X-100, 0.5 mM Na3VO4) and boiled in 30 μl SDS–PAGE sample buffer. For immunoblotting, samples were separated on 4–20% gradient gels (Novex), and transferred to Immobilon-P PVDF membrane (Millipore). Membranes were blotted according to the manufacturer’s suggestions. Antibodies: anti-EphA2 antibody, anti-p-Erk and Erk (Santa Cruz Biotechnology, Santa Cruz, CA). anti-SHIP2 and anti p-EphA/B (Cell signaling, Danvers, MA). Band densities were quantified using ScionImage software to analyse the images.
Cell migration assay
Modified Boyden chambers (8-μm pore size, Transwell, Costar Corporation) were used in cell-migration assays. Both sides of the filter inserts were coated with 10 μg/ml rat tail collagen type I at 4°C overnight. About 1 ×10⁵ cells were plated in the top chamber, and allowed to migrate toward the undersides of the filters at 37 °C for 4 hours in DMEM medium containing 5% FBS. The inserts were fixed with 4% paraformaldehyde and stained with 0.5% crystal violet. Cells on the top side of the inserts were gently wiped off with Q-tips. Numbers of cells migrating to the undersides of the filters from six randomly selected high-power fields were counted under an inverted microscope.
Supplementary Material
Acknowledgments
PKH was a postdoctoral fellow of the American Heart Association, Ohio Great Rivers Affiliate and PC was supported by an institutional training grant T32HL007653. This work was primarily funded by National Institutes of Health grant R01GM73071. HM and BW are supported by NIH grant R01CA152371. BW is also supported by NIH grants R01DK077876 and R01CACA155676, and by awards from FAMRI and Prayer from Maria foundation.
Footnotes
Publisher's Disclaimer: This is a PDF file of an unedited manuscript that has been accepted for publication. As a service to our customers we are providing this early version of the manuscript. The manuscript will undergo copyediting, typesetting, and review of the resulting proof before it is published in its final citable form. Please note that during the production process errors may be discovered which could affect the content, and all legal disclaimers that apply to the journal pertain.
References
- Baker JM, Candy DJ, Hawker RJ. Influences of pH on human platelet metabolism. Platelets. 2001;12:333–342. doi: 10.1080/09537100120078412. [DOI] [PubMed] [Google Scholar]
- Bhattacharjya S, Xu P, Chakrapani M, Johnston L, Ni F. Polymerization of the SAM domain of MAPKKK Ste11 from the budding yeast: implications for efficient signaling through the MAPK cascades. Protein Sci. 2005;14:828–835. doi: 10.1110/ps.041122105. [DOI] [PMC free article] [PubMed] [Google Scholar]
- Bhattacharjya S, Xu P, Gingras R, Shaykhutdinov R, Wu C, Whiteway M, Ni F. Solution structure of the dimeric SAM domain of MAPKKK Ste11 and its interactions with the adaptor protein Ste50 from the budding yeast: implications for Ste11 activation and signal transmission through the Ste50-Ste11 complex. J Mol Biol. 2004;344:1071–1087. doi: 10.1016/j.jmb.2004.09.018. [DOI] [PubMed] [Google Scholar]
- Bober M, Morgelin M, Olin AI, von Pawel-Rammingen U, Collin M. The membrane bound LRR lipoprotein Slr, and the cell wall-anchored M1 protein from Streptococcus pyogenes both interact with type I collagen. PLoS One. 2011;6:e20345. doi: 10.1371/journal.pone.0020345. [DOI] [PMC free article] [PubMed] [Google Scholar]
- Chen X, Cook RK, Rubenstein PA. Yeast actin with a mutation in the “hydrophobic plug” between subdomains 3 and 4 (L266D) displays a cold-sensitive polymerization defect. J Cell Bio. 1993;123:1185–1195. doi: 10.1083/jcb.123.5.1185. [DOI] [PMC free article] [PubMed] [Google Scholar]
- Chik JK, Schriemer DC. Hydrogen/deuterium exchange mass spectrometry of actin in various biochemical contexts. J Mol Biol. 2003;334:373–385. doi: 10.1016/j.jmb.2003.09.044. [DOI] [PubMed] [Google Scholar]
- Clore GM, Schwieters CD. Docking of protein-protein complexes on the basis of highly ambiguous intermolecular distance restraints derived from 1HN/15N chemical shift mapping and backbone 15N-1H residual dipolar couplings using conjoined rigid body/torsion angle dynamics. J Am Chem Soc. 2003;125:2902–2912. doi: 10.1021/ja028893d. [DOI] [PubMed] [Google Scholar]
- Dominguez C, Boelens R, Bonvin AM. HADDOCK: a protein-protein docking approach based on biochemical or biophysical information. J Am Chem Soc. 2003;125:1731–1737. doi: 10.1021/ja026939x. [DOI] [PubMed] [Google Scholar]
- Gabdoulline RR, Wade RC. Protein-protein association: investigation of factors influencing association rates by brownian dynamics simulations. J Mol Biol. 2001;306:1139–1155. doi: 10.1006/jmbi.2000.4404. [DOI] [PubMed] [Google Scholar]
- Gertler R, Pecht I. Ionic signalling in mast cells; antigen and ionophore induced changes in cytosolic pH. Mol Immunol. 1988;25:1087–1092. doi: 10.1016/0161-5890(88)90142-3. [DOI] [PubMed] [Google Scholar]
- Giesen PL, Willems GM, Hemker HC, Hermens WT. Membrane-mediated assembly of the prothrombinase complex. J Biol Chem. 1991 Oct 5;266(28):18720–5. [PubMed] [Google Scholar]
- Goh CS, Milburn D, Gerstein M. Conformational changes associated with protein-protein interactions. Curr Opin Struct Biol. 2004;14:104–109. doi: 10.1016/j.sbi.2004.01.005. [DOI] [PubMed] [Google Scholar]
- Guo H, Miao H, Gerber L, Singh J, Denning MF, Gilliam AC, Wang B. Disruption of EphA2 receptor tyrosine kinase leads to increased susceptibility to carcinogenesis in mouse skin. Cancer Res. 2006;66:7050–7058. doi: 10.1158/0008-5472.CAN-06-0004. [DOI] [PubMed] [Google Scholar]
- Hubbard SJ, Thornton JM. NACESS. Department of Biochemistry and Molecular Biology, University College; London: 1993. [Google Scholar]
- Ishii Y, Markus MA, Tycko R. Controlling residual dipolar couplings in high-resolution NMR of proteins by strain induced alignment in a gel. J Biomol NMR. 2001;21:141–151. doi: 10.1023/a:1012417721455. [DOI] [PubMed] [Google Scholar]
- Ithychanda SS, Hsu D, Li H, Yan L, Liu DD, Das M, Plow EF, Qin J. Identification and characterization of multiple similar ligand-binding repeats in filamin: implication on filamin-mediated receptor clustering and cross-talk. J Biol Chem. 2009;284:35113–35121. doi: 10.1074/jbc.M109.060954. [DOI] [PMC free article] [PubMed] [Google Scholar]
- Kim CA, Gingery M, Pilpa RM, Bowie JU. The SAM domain of polyhomeotic forms a helical polymer. Nat Struct Biol. 2002;9:453–457. doi: 10.1038/nsb802. [DOI] [PubMed] [Google Scholar]
- Kuang B, Rubenstein PA. Beryllium fluoride and phalloidin restore polymerizability of a mutant yeast actin (V266G, L267G) with severely decreased hydrophobicity in a subdomain 3/4 loop. J Biol Chem. 1997;272:1237–1247. doi: 10.1074/jbc.272.2.1237. [DOI] [PubMed] [Google Scholar]
- Kwan JJ, Donaldson LW. The NMR structure of the murine DLC2 SAM domain reveals a variant fold that is similar to a four-helix bundle. BMC Struct Biol. 2007;7:34. doi: 10.1186/1472-6807-7-34. [DOI] [PMC free article] [PubMed] [Google Scholar]
- Lackmann M, Oates AC, Dottori M, Smith FM, Do C, Power M, Kravets L, Boyd AW. Distinct subdomains of the EphA3 receptor mediate ligand binding and receptor dimerization. J Biol Chem. 1998;273:20228–20237. doi: 10.1074/jbc.273.32.20228. [DOI] [PubMed] [Google Scholar]
- Laskowski RA, Rullmannn JA, MacArthur MW, Kaptein R, Thornton JM. AQUA and PROCHECK-NMR: programs for checking the quality of protein structures solved by NMR. J Biomol NMR. 1996;8:477–486. doi: 10.1007/BF00228148. [DOI] [PubMed] [Google Scholar]
- Lee J, Tattoli I, Wojtal KA, Vavricka SR, Philpott DJ, Girardin SE. pH-dependent internalization of muramyl peptides from early endosomes enables Nod1 and Nod2 signaling. J Biol Chem. 2009;284:23818–23829. doi: 10.1074/jbc.M109.033670. [DOI] [PMC free article] [PubMed] [Google Scholar]
- Leone M, Cellitti J, Pellecchia M. NMR studies of a heterotypic Sam-Sam domain association: the interaction between the lipid phosphatase Ship2 and the EphA2 receptor. Biochemistry. 2008;47:12721–12728. doi: 10.1021/bi801713f. [DOI] [PMC free article] [PubMed] [Google Scholar]
- Lyskov S, Gray JJ. The RosettaDock server for local protein-protein docking. Nucleic Acids Res. 2008;36:W233–238. doi: 10.1093/nar/gkn216. [DOI] [PMC free article] [PubMed] [Google Scholar]
- MacKerell AD, Bashford D, Bellott M, Dunbrack RL, Evanseck JD, Field MJ, Fischer S, Gao J, Guo H, Ha S, et al. All-atom empirical potential for molecular modeling and dynamics studies of proteins. J Phys Chem B. 1998;102:3586–3616. doi: 10.1021/jp973084f. [DOI] [PubMed] [Google Scholar]
- Matsuda T, Ikegami T, Nakajima N, Yamazaki T, Nakamura H. Model building of a protein-protein complexed structure using saturation transfer and residual dipolar coupling without paired intermolecular NOE. J Biomol NMR. 2004;29:325–338. doi: 10.1023/B:JNMR.0000032613.05864.87. [DOI] [PubMed] [Google Scholar]
- Meiler J, Blomberg N, Nilges M, Griesinger C. A new approach for applying residual dipolar couplings as restraints in structure elucidation. J Biomol NMR. 2000;16:245–252. doi: 10.1023/a:1008378624590. [DOI] [PubMed] [Google Scholar]
- Meruelo AD, Bowie JU. Identifying polymer-forming SAM domains. Proteins. 2009;74:1–5. doi: 10.1002/prot.22232. [DOI] [PMC free article] [PubMed] [Google Scholar]
- Miao H, Li DQ, Mukherjee A, Guo H, Petty A, Cutter J, Basilion JP, Sedor J, Wu J, Danielpour D, et al. EphA2 mediates ligand-dependent inhibition and ligand-independent promotion of cell migration and invasion via a reciprocal regulatory loop with Akt. Cancer Cell. 2009;16:9–20. doi: 10.1016/j.ccr.2009.04.009. [DOI] [PMC free article] [PubMed] [Google Scholar]
- Miao H, Nickel CH, Cantley LG, Bruggeman LA, Bennardo LN, Wang B. EphA kinase activation regulates HGF-induced epithelial branching morphogenesis. J Cell Biol. 2003;162:1281–1292. doi: 10.1083/jcb.200304018. [DOI] [PMC free article] [PubMed] [Google Scholar]
- Miao H, Wei BR, Peehl DM, Li Q, Alexandrou T, Schelling JR, Rhim JS, Sedor JR, Burnett E, Wang B. Activation of EphA receptor tyrosine kinase inhibits the Ras/MAPK pathway. Nat Cell Biol. 2001;3:527–530. doi: 10.1038/35074604. [DOI] [PubMed] [Google Scholar]
- Moreira IS, Fernandes PA, Ramos MJ. Hot spots--a review of the protein-protein interface determinant amino-acid residues. Proteins. 2007;68:803–812. doi: 10.1002/prot.21396. [DOI] [PubMed] [Google Scholar]
- Myers J, Grothaus G, Narayanan S, Onufriev A. A simple clustering algorithm can be accurate enough for use in calculations of pKs in macromolecules. Proteins. 2006;63:928–938. doi: 10.1002/prot.20922. [DOI] [PubMed] [Google Scholar]
- Ooms LM, Horan KA, Rahman P, Seaton G, Gurung R, Kethesparan DS, Mitchell CA. The role of the inositol polyphosphate 5-phosphatases in cellular function and human disease. Biochem J. 2009;419:29–49. doi: 10.1042/BJ20081673. [DOI] [PubMed] [Google Scholar]
- Ottiger M, Bax A. Bicelle-based liquid crystals for NMR-measurement of dipolar couplings at acidic and basic pH values. J Biomol NMR. 1999;13:187–191. doi: 10.1023/a:1008395916985. [DOI] [PubMed] [Google Scholar]
- Park EK, Warner N, Bong YS, Stapleton D, Maeda R, Pawson T, Daar IO. Ectopic EphA4 receptor induces posterior protrusions via FGF signaling in Xenopus embryos. Mol Biol Cell. 2004;15:1647–1655. doi: 10.1091/mbc.E03-09-0674. [DOI] [PMC free article] [PubMed] [Google Scholar]
- Pawson T, Nash P. Assembly of cell regulatory systems through protein interaction domains. Science. 2003;300:445–452. doi: 10.1126/science.1083653. [DOI] [PubMed] [Google Scholar]
- Phillips JC, Braun R, Wang W, Gumbart J, Tajkhorshid E, Villa E, Chipot C, Skeel RD, Kale L, Schulten K. Scalable molecular dynamics with NAMD. J Comput Chem. 2005;26:1781–1802. doi: 10.1002/jcc.20289. [DOI] [PMC free article] [PubMed] [Google Scholar]
- Qiao F, Bowie JU. The many faces of SAM. Sci STKE. 2005;2005:re7. doi: 10.1126/stke.2862005re7. [DOI] [PubMed] [Google Scholar]
- Rajakulendran T, Sahmi M, Kurinov I, Tyers M, Therrien M, Sicheri F. CNK and HYP form a discrete dimer by their SAM domains to mediate RAF kinase signaling. Proc Natl Acad Sci U S A. 2008;105:2836–2841. doi: 10.1073/pnas.0709705105. [DOI] [PMC free article] [PubMed] [Google Scholar]
- Ramachander R, Bowie JU. SAM domains can utilize similar surfaces for the formation of polymers and closed oligomers. J Mol Biol. 2004;342:1353–1358. doi: 10.1016/j.jmb.2004.08.011. [DOI] [PubMed] [Google Scholar]
- Sattler M, Maurer M, Schleucher J, Griesinger C. A simultaneous 15N,1H- and 13C,1H-HSQC with sensitivity enhancement and a heteronuclear gradient echo. J Biomol NMR. 1995;5:97–102. doi: 10.1007/BF00227475. [DOI] [PubMed] [Google Scholar]
- Schreiber G, Fersht AR. Rapid, electrostatically assisted association of proteins. Nat Struct Biol. 1996;3:427–431. doi: 10.1038/nsb0596-427. [DOI] [PubMed] [Google Scholar]
- Schultz J, Ponting CP, Hofmann K, Bork P. SAM as a protein interaction domain involved in developmental regulation. Protein Sci. 1997;6:249–253. doi: 10.1002/pro.5560060128. [DOI] [PMC free article] [PubMed] [Google Scholar]
- Smalla M, Schmieder P, Kelly M, Ter Laak A, Krause G, Ball L, Wahl M, Bork P, Oschkinat H. Solution structure of the receptor tyrosine kinase EphB2 SAM domain and identification of two distinct homotypic interaction sites. Protein Sci. 1999;8:1954–1961. doi: 10.1110/ps.8.10.1954. [DOI] [PMC free article] [PubMed] [Google Scholar]
- Stapleton D, Balan I, Pawson T, Sicheri F. The crystal structure of an Eph receptor SAM domain reveals a mechanism for modular dimerization. Nat Struct Biol. 1999;6:44–49. doi: 10.1038/4917. [DOI] [PubMed] [Google Scholar]
- Sun H, Reinscheid UM, Whitson EL, d’Auv-Griesinger C. Challenge of Large-Scale Motion for Residual Dipolar Coupling Based Analysis of Configuration. J Am Chem Soc. 2011;133:14629–14636. doi: 10.1021/ja205295q. [DOI] [PMC free article] [PubMed] [Google Scholar]
- Thanos CD, Faham S, Goodwill KE, Cascio D, Phillips M, Bowie JU. Monomeric structure of the human EphB2 sterile alpha motif domain. J Biol Chem. 1999a;274:37301–37306. doi: 10.1074/jbc.274.52.37301. [DOI] [PubMed] [Google Scholar]
- Thanos CD, Goodwill KE, Bowie JU. Oligomeric structure of the human EphB2 receptor SAM domain. Science. 1999b;283:833–836. doi: 10.1126/science.283.5403.833. [DOI] [PubMed] [Google Scholar]
- Tran HH, Kim CA, Faham S, Siddall MC, Bowie JU. Native interface of the SAM domain polymer of TEL. BMC Struct Biol. 2002;2:5. doi: 10.1186/1472-6807-2-5. [DOI] [PMC free article] [PubMed] [Google Scholar]
- van Dijk AD, Bonvin AM. Solvated docking: introducing water into the modelling of biomolecular complexes. Bioinformatics. 2006;22:2340–2347. doi: 10.1093/bioinformatics/btl395. [DOI] [PubMed] [Google Scholar]
- van Dijk AD, Fushman D, Bonvin AM. Various strategies of using residual dipolar couplings in NMR-driven protein docking: application to Lys48-linked di-ubiquitin and validation against 15N-relaxation data. Proteins. 2005;60:367–381. doi: 10.1002/prot.20476. [DOI] [PubMed] [Google Scholar]
- Zhou HX. Association and dissociation kinetics of colicin E3 and immunity protein 3: convergence of theory and experiment. Protein science. 2003;12:2379–2382. doi: 10.1110/ps.03216203. [DOI] [PMC free article] [PubMed] [Google Scholar]
- Zhuang G, Hunter S, Hwang Y, Chen J. Regulation of EphA2 receptor endocytosis by SHIP2 lipid phosphatase via phosphatidylinositol 3-Kinase-dependent Rac1 activation. J Biol Chem. 2007;282:2683–2694. doi: 10.1074/jbc.M608509200. [DOI] [PubMed] [Google Scholar]
- Zuiderweg ER. Mapping protein-protein interactions in solution by NMR spectroscopy. Biochemistry. 2002;41:1–7. doi: 10.1021/bi011870b. [DOI] [PubMed] [Google Scholar]
- Zweckstetter M. NMR: prediction of molecular alignment from structure using the PALES software. Nat Protoc. 2008;3:679–690. doi: 10.1038/nprot.2008.36. [DOI] [PubMed] [Google Scholar]
Associated Data
This section collects any data citations, data availability statements, or supplementary materials included in this article.