

Background: Little is known about how global signaling network properties influence cardiac myocyte hypertrophy.
Results: New 106 species computational model exhibited enriched cross-talk motifs and modular organization, predicting Ras as the most influential hub.
Conclusion: Multiple levels of network organization modulate hypertrophic outcomes.
Significance: Rather than acting through isolated pathways, cardiac hypertrophy signaling is a highly integrated network.
Keywords: Cardiac Hypertrophy, Cardiac Muscle, Computational Biology, Signal Transduction, Systems Biology, Cardiac Myocytes, Computational Model
Abstract
Cardiac hypertrophy is managed by a dense web of signaling pathways with many pathways influencing myocyte growth. A quantitative understanding of the contributions of individual pathways and their interactions is needed to better understand hypertrophy signaling and to develop more effective therapies for heart failure. We developed a computational model of the cardiac myocyte hypertrophy signaling network to determine how the components and network topology lead to differential regulation of transcription factors, gene expression, and myocyte size. Our computational model of the hypertrophy signaling network contains 106 species and 193 reactions, integrating 14 established pathways regulating cardiac myocyte growth. 109 of 114 model predictions were validated using published experimental data testing the effects of receptor activation on transcription factors and myocyte phenotypic outputs. Network motif analysis revealed an enrichment of bifan and biparallel cross-talk motifs. Sensitivity analysis was used to inform clustering of the network into modules and to identify species with the greatest effects on cell growth. Many species influenced hypertrophy, but only a few nodes had large positive or negative influences. Ras, a network hub, had the greatest effect on cell area and influenced more species than any other protein in the network. We validated this model prediction in cultured cardiac myocytes. With this integrative computational model, we identified the most influential species in the cardiac hypertrophy signaling network and demonstrate how different levels of network organization affect myocyte size, transcription factors, and gene expression.
Introduction
Cardiac hypertrophy develops in response to biochemical and mechanical stresses, increasing patient risk of heart failure and malignant arrhythmia (1). The cardiac hypertrophy response is managed by a dense web of signaling pathways with many species influencing cardiac myocyte growth (2). The complexity of this network has hindered the development of successful therapeutic strategies (3) and indicates the need for integrative systems approaches which can provide a global view of functional relationships in the network (4).
Computational models have been used to increase understanding of the role of signaling components and topology on cardiac physiology such as myocyte contractility (5), arrhythmia (6), and hypertrophy (7, 8). Although these models have been used successfully to address focused questions about individual pathways, more global network reconstructions are needed to understand differential regulation of hypertrophy and crosstalk between these pathways. Large-scale integrative models have been successful in other systems such as the prediction of optimal evolution (9) and drug targets (10) in metabolic networks and prediction of the global transcriptional response to genetic and environmental perturbations (11).
Here, we developed a computational model of the hypertrophy signaling network by integrating many established pathways implicated in cardiac myocyte growth. We used the recently described normalized Hill modeling framework (12) with default parameters, which allowed us to build a more complete network despite limited available quantitative biochemical data. We used this model to determine how the components and network topology of hypertrophy signaling lead to differential regulation of transcription factors, gene expression, and myocyte size. Model predictions were validated using published and new experimental data testing the effects of receptor activation on transcription factors and myocyte phenotypic outputs. Using this model, we analyzed network motifs, dynamics, and modules to increase understanding of network organization and performed sensitivity analysis to identify global functional relationships in the network. Key findings include identification of Ras as an influential network hub, enrichment of network motifs causing cross-talk, and many nodes that influence myocyte hypertrophy, but only a few nodes with large positive or negative effects on cell growth.
EXPERIMENTAL PROCEDURES
Modeling Approach
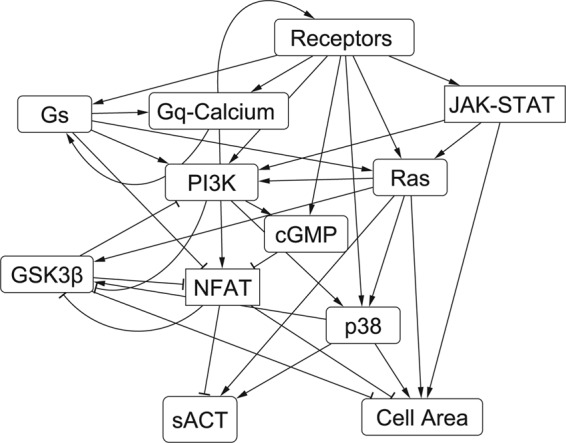
Network reconstruction of cardiac hypertrophy signaling focused on the most established pathways leading from receptor inputs to transcription factor activities, gene expression, and myocyte size. Each reaction was substantiated with at least two citations from the literature, with a preference for data from neonatal rat ventricular myocytes (see supplemental Table 1). The overall cardiac hypertrophy signaling network model contains 106 species and 193 reactions (Fig. 1). The model contains 17 receptor inputs (tumor necrosis factor α (TNFα), isoproterenol, norepinephrine; phenylephrine (PE);3 endothelin-1, insulin-like growth factor, epidermal growth factor (EGF); angiotensin II, neuregulin 1, transforming growth factor β (TGFβ); interleukin 6 (IL6); fibroblast growth factor, FGF; cardiotrophin 1; leukemia inhibitory factor (LIF); stretch, brain naturetic peptide; atrial naturetic peptide) and seven phenotypic outputs (cell area and expression of six genes: sarcoplasmic reticulum ATPase, α-myosin heavy chain, β-myosin heavy chain, atrial naturetic peptide, brain naturetic peptide, and skeletal α-actin). The size of the model allowed for investigation of differential regulation of hypertrophy and cross-talk between pathways.
FIGURE 1.

Schematic of the cardiac hypertrophy signaling network model. The model consists of 106 species and 193 reactions. Model inputs and outputs are shown in gray. This model was implemented using the normalized-Hill differential equation modeling approach (12) using 132 literature citations focused on neonatal rat ventricular myocytes (see supplemental Table 1). ISO, isoproterenol; NE, norepinephrine; ET1, endothelin-1; IGF1, insulin-like growth factor; AngII, angiotensin II; NRG1, neuregulin 1; IL6, interleukin 6; FGF, fibroblast growth factor; CT1, cardiotrophin 1; BNP, brain naturetic peptide; ANP, atrial naturetic peptide; SERCA, sarcoplasmic reticulum ATPase; α-MHC, α-myosin heavy chain; sACT, skeletal α-actin; CREB, cAMP-responsive element-binding protein; EGFR, EGF receptor; FGFR, FGF receptor; IP3, inositol 1,4,5-trisphosphate; βAR, β-adrenergic receptor. α-AR, alpha-adrenergic receptor; NOS, nitric oxide synthase; NIK, NFKB-inducing kinase; AC, adenylyl cyclase; DAG, diacylglycerol; PLC, phospholipase C; FAK, focal adhesion kinase; SRF, serum response factor; GCA, guanylyl cyclase subtype A.
Species dynamics were predicted by converting the network to mathematical equations using the recently described normalized-Hill differential equation approach (12). Briefly, this modeling approach uses logic-based differential equations, representing activation or inhibition reactions using normalized Hill functions together with logical AND and OR gates to compute crosstalk. Each species has a corresponding differential equation, which is computed in units of fractional activation so that protein abundance parameters are not required. For example, the joint activation of protein kinase C (PKC) by calcium (Ca) and diacylglycerol (DAG) is represented by the following equations.
 |
 |
 |
An example of an OR gate is seen in the activation of JNK by MEK4 or MEK7.
 |
Default parameters (specified in supplemental Table 1, weight = 1, n = 1.4, Tau = 1, and EC50 = 0.5) were used for all reactions based on a prior normalized Hill model of the cardiac β-adrenergic pathway (12). Matlab code for the 106 differential equations was generated automatically from Supplemental Table 1 using Netflux (freely available online). The Matlab code for the model is available in the supplemental material. Initial values for each species were 0 or 1 and are listed in supplemental Table 1. The normalized Hill framework allows predictions of network dynamics and is compatible with many analyses from the field of nonlinear dynamics while requiring minimal knowledge of biochemical parameters. Notably, the kinetics of this model can be refined as experimental data become available (12).
Analysis of Network Topology
The hypertrophy signaling network was exported from Netflux into Cytoscape (13) for topological analysis. The Network Analyzer (14) plug-in was used to calculate topological properties of the network such as the mean number of neighbors and the characteristic path length from input to output (Table 1). The NetMatch (15) plug-in was used to identify enriched network motifs. Motifs are biologically significant network structures that form the building blocks of a complex system, often facilitating regulation, stability, and cross-talk (16). To identify statistically enriched network motifs, the hypertrophy signaling network was compared with a set of ten randomized models with a scale-free degree distribution. These randomized models were created using the RandomNetworks plug-in. Comparisons were performed for five different motifs: three-node feed-forward loops, bi-parallels, four-node feed-forward loops, bi-fans, and three-node feedback loops. The z-score for each comparison was calculated using the equation: Z = (Nhyp − Nrand)/Srand. Nhyp is the number of a particular motif in the hypertrophy network, Nrand is the average number of that motif in the randomized scale free networks, and Srand is the S.D.
TABLE 1.
Topological properties of the cardiac hypertrophy signaling network
The number of neighbors is equivalent to the total number of reactions that go in or out of a given species. Characteristic path length is the average number of nodes between two species in the network. BNP, brain naturetic peptide; ANP, atrial naturetic peptide; SERCA, sarcoplasmic reticulum ATPase; α-MHC, α-myosin heavy chain; CREB, cAMP-responsive element-binding protein; ISO, isoproterenol; NE, norepinephrine.
| Number of species | 106 |
| Number of reactions | 193 |
| Avg. number of Neighbors | 3.508 |
| Characteristic path length | 4.936 |
| Hubs (8+ neighbors) | Ras, p38, cJun, NFAT, MEF2, ERK12, GATA4, PI3K |
| Inputs | Angiotensin II, ANP, BNP, CT1, EGF, ET1, FGF, IGF1, IL6, ISO, LIF, NE, NRG1, PE, stretch, TGFβ, TNFα |
| Transcription factors | ATF2, cFos, cJun, CREB, FOXO, GATA4, MEF2, NFAT, SRF |
| Outputs | α-MHC, ANP, β-MHC, BNP, cell area, skeletal actin, SERCA |
Sensitivity Analysis and Identification of Network Modules
A sensitivity analysis was performed by simulating individual knockdowns for each of the 106 species in the network and then measuring the activation of all species in the network at steady state. Knockdowns were generated by setting the maximal activity for a given species to zero (e.g. PKCmax = 0). All 17 input reactions were set to a weight of 0.072 such that cell area was close to 0.5, maximizing the information that could be obtained from sensitivity analysis. This is based on the experimental observation that unstimulated neonatal myocytes are roughly half the size of myocytes stimulated with a strong hypertrophic agonist (17). Results were combined as a 106 × 106 sensitivity matrix defined as: Si,j = ΔYj/ΔPj, where Si,j is the sensitivity of species i to knockdown of species j, ΔYi is the change in steady-state output of species i (control knockdown), and ΔPj = 1, when species j is being knocked down.
To determine which species in the network have similar functions, k means clustering was applied after thresholding the sensitivity matrix. This threshold was applied at a sensitivity level of 0.001, where sensitivities above the threshold were set to 1 and all values below the negative of the threshold were set to −1. All other values were set to zero. In Cytoscape, species could be collapsed into their modules using the plug-in Metanodes, providing a map of how the modules were interconnected with each other.
Cell Culture and Microscopy
Cardiac myocytes were harvested from 1–2-day-old Sprague-Dawley rats after decapitation and transfected with GFP driven under a cardiac myocyte specific troponin T promoter (18) (transfection efficiency: 10–15%) 2 days after isolation. All procedures were performed in accordance with the Guide for the Care and Use of Laboratory Animals published by the U. S. National Institutes of Health and approved by the University of Virginia Institutional Animal Care and Use Committee. Two days after transfection, myocytes were imaged and then rinsed and transferred to a solution of 100 μmol/liter Ras inhibitor (farnesyltransferase inhibitor, FPT inhibitor III), 100 μmol/liter JNK inhibitor (SP600125), 10 μmol/liter p38 inhibitor (SB203580), or 10 μmol/liter of MEK1/2 (U0126) inhibitor (Calbiochem, La Jolla, CA) in serum-free medium. U0126 has also been shown to inhibit MEK5 (19). For 48-h PE treatment experiments, a more specific MEK 1/2 inhibitor (100 nmol/liter PD325901) was used, and a lower concentration of JNK inhibitor (10 μmol/liter), because higher concentrations significantly affected cell size even without PE treatment. After 1 h, the myocytes were transferred to a solution of 10 μmol/liter PE, an α-adrenergic receptor agonist, with a given inhibitor. Follow-up images were recorded after 24 or 48 h. In each well of interest in the 96-well plate, a 5 × 5 grid of images was collected automatically using custom image acquisition scripts (20). Changes in myocyte area were evaluated using automated custom Matlab algorithms (20). More detailed methods are included in the supplemental material.
RESULTS
Topology of the Hypertrophy Signaling Network
The construction of a cardiac hypertrophy signaling network model creates an opportunity to examine how global network properties influence the development of hypertrophy. Previous studies have primarily examined effects of a single species or pathway using biochemically detailed mass action or Michaelis kinetics. Here, we used the recently described normalized Hill modeling framework (12) with default parameters, which allowed us to model a more integrative signaling network despite limited available quantitative biochemical characterization at this scale. Comprehensive sensitivity analysis comparing a previously built mass action model of β-adrenergic signaling with detailed parameters with a normalized Hill model with default parameters showed high agreement, with a Pearson correlation coefficient of 0.754 (12). Key reasons for the parameter robustness are the normalization of equations in terms of fractional activation and the separation of steady state (e.g. reaction weights) and kinetic (time constants) parameters.
Topological properties of the overall network are summarized in Table 1. Species with a small number of neighbors and species with many neighbors are overrepresented compared with a network with normally distributed linkages (supplemental Fig. 1). Eight nodes with an especially high number of neighbors (≥8), “hubs” (21), were identified (Table 1). Because hubs participate in a large number of reactions in the network, they may be influential across several parallel pathways in the hypertrophy network.
Network motif analysis revealed the presence of feed-forward loop, bi-fan, and bi-parallel motifs in the hypertrophy network. Although a high level of cross-talk was expected based on the network diagram, the specific types of interaction motifs present and their significance compared with other networks of the same size was not known. The structure of each identified motif, two examples from the hypertrophy network, and quantitative comparisons to the randomized networks with the same number of species and interactions are shown in Table 2. Feed-forward loops indicate cross-talk between species in parallel pathways and influence reaction speed. Feed-forward loops in the hypertrophy network were primarily longer path four-node loops instead of three-node loops. Three-node feed-forward loops were present but underrepresented in the hypertrophy network compared with randomized scale-free networks. Bi-parallel motifs were overrepresented in the network, whereas other types of four-node feed-forward loops were absent. Bi-fan motifs were highly overrepresented in the hypertrophy network compared with the randomized scale-free networks, indicating a high level of cross-talk between pathways in the hypertrophy signaling network.
TABLE 2.
Enriched network motifs in the hypertrophy signaling network
Motif analysis revealed feed-forward loop, bi-fan, and bi-parallel network motifs in the cardiac hypertrophy network. The structure of each motif is shown along with two specific examples present in the network. The prevalence of these motifs was compared to the average of ten randomized scale-free models. Nhyp is the number of motifs in the hypertrophy network, and Nrand is the average number of motifs in the randomized networks. The z-score comparing prevalence in the hypertrophy and the randomized models is also shown. Bi-fan motifs were largely prevalent in this network, whereas feed-forward loops were underrepresented compared to the randomized models.

Simulation and Experimental Validation of Network Dynamics
The normalized Hill differential equation framework of the hypertrophy signaling network model enables network-wide prediction of signaling dynamics. Fig. 2 shows an example simulation of the response to a transient exposure to phenylephrine (PE) followed by TNFα. Different patterns of activation between the two hypertrophic agonists can be clearly observed as well as groups of network species with similar patterns of activation. For example, members of the Ras/MAPK pathway are activated with PE and not TNFα, whereas PI3K is activated by both agonists. Moreover, similar patterns of activation can be seen in small GTPases Rac1, Raf1A, Ras, and RhoA as well as members of the MAPK pathway MEK12, MEK4, and MEK7. Visualization of activity dynamics for the entire network is shown in supplemental Video 1. This visualization highlights the ability to examine the influence of network topology on signaling dynamics. Although the current model uses default time constants for all reactions, these parameters can be readily revised as kinetic experimental data become available (12).
FIGURE 2.

Predicting global dynamics of the hypertrophy signaling network. Predicted activation time course for a subset of species (47/106) in the cardiac hypertrophy signaling network model comparing perturbations by PE and TNFα to show how different ligands induce different dynamic network responses. PE was removed to restore the original system steady state before adding TNFα. BNP, brain naturetic peptide; ANP, atrial naturetic peptide; SERCA, sarcoplasmic reticulum ATPase; α-MHC, α-myosin heavy chain; sACT, skeletal α-actin; CREB, cAMP-responsive element-binding protein; IP3, inositol 1,4,5-trisphosphate; αAR, α-adrenergic receptor. NIK, NFKB-inducing kinase; SRF, serum response factor; PKD, protein kinase D.
The model was validated using independent data from the experimental literature testing the effects of each model input on the phenotypic outputs (Fig. 3). Experimental sources are listed in supplemental Table 2. Model data were binned into the categories of positive, negative, and no effect at steady state due to limits in the resolution of the available experimental data. The hypertrophy model was able to correctly predict 109 of 114 (96%) qualitative input-output relationships observed experimentally in neonatal ventricular myocytes. A notable exception is the model prediction that insulin-like growth factor increased atrial naturetic peptide gene expression, which is the opposite of experimental observations (22). Experimental data were found for only 48% of these input-output relationships, indicating substantial gaps in the literature. Model discrepancies with experimental data such as this will help inform model revision and experimental design.
FIGURE 3.

Experimental validation of model predictions from receptor activation to transcription factors and phenotypic outputs. Red indicates increase, blue indicates decrease, white indicates no change, and gray indicates an absence of available data. The cardiac hypertrophy model accurately predicted the large majority of qualitative input-output relationships of the hypertrophy network (109 of 114 relationships, sources provided in supplemental Table 2). Discrepancies between the model and experimental results are boxed. BNP, brain naturetic peptide; ANP, atrial naturetic peptide; SERCA, sarcoplasmic reticulum ATPase; α-MHC, α-myosin heavy chain; sACT, skeletal α-actin; CREB, cAMP-responsive element-binding protein; αAR, α-adrenergic receptor.
Sensitivity Analysis of Myocyte Hypertrophy
Sensitivity analysis provides a global view of quantitative functional relationships between every species in the hypertrophy signaling network. Fig. 4 shows the sensitivity analysis for a subset of the network, whereas the full 106 × 106 species sensitivity matrix for the entire network is available in the supplemental data (supplemental Fig. 2). Each column of the matrix shows the change in activity of each species in the model when a given species is knocked down. Therefore, the diagonal of the matrix represents self-activation, which varies between species as a result of differences in base-line activity.
FIGURE 4.

Sensitivity analysis reveals global functional relationships of the hypertrophy signaling network. A subset of the full sensitivity matrix for the cardiac hypertrophy signaling network model is shown. Each column of the sensitivity matrix represents a computational experiment in which the labeled species was knocked down, and then the activity of each species in the model was measured at steady state. Sensitivity values indicate change in steady-state output (control, knockdown). Therefore, red signifies that the species in the column activates the species in the row, whereas blue signifies inhibition, and white signifies no change. BNP, brain naturetic peptide; ANP, atrial naturetic peptide; SERCA, sarcoplasmic reticulum ATPase; α-MHC, α-myosin heavy chain; sACT, skeletal α-actin; CREB, cAMP-responsive element-binding protein; αAR, α-adrenergic receptor.
Sensitivity analysis revealed quantitative relationships in the hypertrophy signaling network that would not be apparent from observation of the network topology alone. By examining a particular row of the sensitivity matrix, one can see what species most strongly influence a particular species. For example, atrial naturetic peptide gene expression (row 2) is more strongly influenced by Ras than JAK and more strongly influenced by JAK than JNK, even though each of these species is in the same pathway.
By examining the columns of the sensitivity matrix the global influences of every species in the network can be compared. For example, GSK3β (column 14) has a greater inhibitory role in the network compared with other species and may represent a potential therapeutic target for overexpression/activation. Fig. 4 also shows that Ras has a greater relative influence on species in the network compared with other species such as Gβγ. Moreover, species further upstream in the network such as Gαq11 and gp130LIFR tend to affect more species in the network than species further downstream such as ATF2 and ELK1. Interestingly, whereas Ras affects a large number of species in the network, Ras is not significantly affected by many species in the network. Because Ras has 14 direct connections to other species in the network, including eight activating species, Ras can retain a high level of activation despite reduced levels of a single upstream species. Although we hypothesized strong correlations between the number of connections with other species in the network and sensitivity and influence (21, 23), sensitivity analysis revealed only moderate correlations between local connectivity and global network influence and sensitivity in the hypertrophy network (supplemental Fig. 3). Notable exceptions to the expected connectivity/function correlation included a substantial influence of endothelin-1 despite direct links only to its receptor endothelin-1R, and a high sensitivity of NFκB despite being directly regulated only by IκB and ERK1/2.
The row of the sensitivity matrix corresponding to cell area (row 6) highlights species with major influences on cell growth. Ras, JAK, Gβγ, Gαq11, and gp130LIFR have the highest influences on cell area in the network. The single species with the greatest influence on cell area, Ras, is also a hub, with 14 connections to other species in the network. GSK3β negatively influences cell area. A network view of the relative influence on cell area of each species is shown in supplemental Fig. 4. This diagram shows highly influential species at various locations in the network, not just near the outputs. With these results, we rank ordered the species in the network based on their degree of influence on cell area from least to greatest (supplemental Fig. 5A). This information will be useful for prioritizing future experiments and potential drug targets. Compared with a normal distribution, species with low positive influences are overrepresented, species with negative influences are underrepresented, and Ras, JAK, and Gβγ have much higher influences on cell area than expected (supplemental Fig. 5B). To ensure that the model was not highly sensitive to our choice of default parameter values, we examined the correlation coefficients between the model with default parameter and models with choices of EC50, n, weight, and Tau based on a uniform probability distribution within a given range (supplemental Fig. 6).
Sensitivity Analysis Reveals Modular Regulation of Hypertrophy
We hypothesized that there may be an underlying structure to the sensitivity matrix that would help elucidate functional organization of the hypertrophy signaling network. Rather than forming modules based on network structure, correlations in the rows of the sensitivity matrix were automatically sorted by k-means clustering into twelve functional modules in the hypertrophy network (Fig. 5). A network schematic labeling the module for each species is shown in supplemental Fig. 7. Of these, the largest module (receptors) contained every input and corresponding receptor except for β-adrenergic receptor. This module also included connected species protein kinase C, TAK1, protein kinase D, and histone deacetylases (HDAC). This large module occurred because each of these species is located “upstream” in the hypertrophy network and therefore affected by a limited number of other species. The MAPK species were partitioned into two groups, one consisting of species closely neighboring Ras and one centering on p38. Species in the downstream module centering on p38 are affected by more species than the upstream module that included Ras. Species that are predominately inhibited by other species in the network (sarcoplasmic reticulum ATPase, α-myosin heavy chain, IκB, FOXO, GSK3β) were also grouped together. Unique mixture of inhibition and activation of NFAT by other species in the network resulted in it being grouped by itself.
FIGURE 5.
Modular organization of the hypertrophy signaling network revealed by sensitivity analysis. k-means cluster analysis of the sensitivity matrix of the cardiac hypertrophy model revealed 12 major functional signaling modules. Labeled connections between modules represent interactions between species in different modules. sACT, skeletal α-actin. NFAT, nuclear factor of activated T-cells.
The MAPK and PI3K modules contain major network hubs, suggesting a role of these modules as network integration points. For example, the PI3K module is centered on a species with high in-degree (PI3K) and one with high out-degree (AKT). Other modules represent discernible, linear pathways such as β-adrenergic receptor, Gq/calcium, and JAK/STAT modules. Network outputs were organized in three different modules suggesting differences in regulation and indicating the ability of the network to generate different hypertrophic phenotypic outputs in different signaling states.
The network was sorted into 12 modules because this group number resulted in moderate sized modules. Expanding the number of groups beyond twelve resulted in more small groups with ≤4 members. For example, with 15 modules, Gq-calcium signaling split into three modules and sarcoplasmic reticulum ATPase and α-myosin heavy chain split from the GSK3β module. Reducing the module number below 12 resulted in more modules joining the large receptors module. For example, reducing the number of groups to 10 modules resulted in Gs signaling grouping together with the large receptors module and skeletal α-actin joining the cell area module.
Connections between modules are labeled (Fig. 5) to characterize interactions between network components. Modules were on average connected to 5.17 other modules in the network. Motif analysis revealed 22 feed-forward loop, 29 bi-parallel, and 21 bi-fan motifs between network modules. These results indicate a high level of cross-talk between modules and suggest that studying the interactions between signaling pathways will be important in understanding cellular regulation of cardiac hypertrophy.
Experimental Validation of Distributed Processing by the Ras/MAPK Pathway
The hypertrophy signaling model includes eight hubs (Table 1), which are species with at least eight connections to other species in the network. The sensitivity analysis revealed that the network hub Ras has the greatest influence on cell area in the network (Fig. 4). No other network hubs make up the list of the five most influential network species (supplemental Fig. 5A). The second most influential species, JAK, only had six direct connections to other species (Fig. 1). Ras has 14 connections to other species in the network, six of which are downstream. Through distributed processing out of Ras, the network could continue to generate large increases in cell area if any single pathway out of Ras was blocked. The model therefore predicts that blocking Ras would have a larger effect on cardiac hypertrophy than inhibiting any other downstream species alone (Fig. 6, A and B).
FIGURE 6.

Model predictions and experimental validation of distributed processing by the Ras/MAPK pathway. A, schematic of signaling downstream of Ras labeled with predicted differences in cell area between control and the knockdown of each species in the pathway. Darker species labels indicate a larger influence on cell area. The model predicts that inhibiting Ras, which has the largest influence on cell area, would have a much larger effect on PE-induced cardiac hypertrophy than knocking down any individual downstream species. B, model predicted fold change in cell area for PE-induced hypertrophy with Ras, JNK, MEK1/2, or p38 inhibition. The PE input reaction was set to a weight of 0.25, and all other inputs were turned off. C, median (∼500 cells per condition) fold change in cell area of cultured neonatal rat ventricular myocytes stimulated for 24 h with PE with an inhibitor for either Ras (100 μm FPT inhibitor III), JNK (100 μm SP600125), MEK1/2 (10 μm U0126), or p38 (10 μm SB203580). Error bars are ± S.E. As predicted, inhibiting Ras almost entirely prevented PE-induced hypertrophy. Differences in fold change in cell area were tested for statistical significance using Kruskall-Wallis non-parametric one-way analysis of variance followed by a Dunn's multiple comparisons post-test. #, p < 0.05, comparison with negative control (PE versus negative (Neg.) control). *, p < .05, comparison with positive control (Ras, JNK, MEK1/2, and p38 inhibition versus PE). D, median (∼700 cells per condition) fold change in cell area of cultured neonatal rat ventricular myocytes stimulated for 48 h with PE with an inhibitor for JNK (10 μm SP600125), MEK1/2 (100 nm PD325901), or p38 (10 μm SB203580) for 48 h. Ras inhibition combined with PE resulted in cell death at 48 h, so we could not include data from this condition. E, representative images of segmented cardiac myocytes after 24 h of treatment with labeled fold change in cell area (scale bar, 10 μm). PE-induced hypertrophy is attenuated by Ras-inhibition more than MEK1/2 inhibition.
To test this model prediction, we stimulated cardiac myocytes with the α-adrenergic receptor agonist PE. The magnitude of PE-induced hypertrophy was compared with myocytes stimulated with both PE and an inhibitor for either Ras, JNK, MEK1/2, or p38. As predicted by the model, Ras inhibition almost entirely prevented PE-induced hypertrophy, giving further evidence for the role of Ras as a highly influential network hub in hypertrophy signaling (Fig. 6, C and E). MEK1/2 and p38 inhibition had smaller effects on cell area (Fig. 6, C–E). JNK inhibition, however, had a greater impact on cell growth than expected based on model predictions (Fig. 6C).This finding may suggest a larger role in cell growth than can be predicted by the current model or reflect limitations in specificity of the JNK inhibitor (24). Therefore, the relative contribution to hypertrophy between MEK1/2, p38, and JNK requires further study. Data from experiments taken out to 48 h reveal that p38 inhibition and MEK1/2 inhibition did have significant effects on hypertrophy, but less so than JNK inhibition (Fig. 6D). Ras inhibition combined with PE resulted in cell death at 48 h, so we could not include data from this condition. Because sustained Ras inhibition with PE led to cell death, Ras may be important in adaptation to stress for cardiac myocytes. Ras inhibition with FPT inhibitor III has been shown to increase apoptosis (25, 26). Inhibitor treatment without PE did not cause significant (p < .05, Kruskal Wallis test followed by Dunn's multiple comparison's post-test) differences in fold change in cell area compared with negative control at 24 or 48 h (supplemental Fig. 8).
DISCUSSION
Although previous experiments related to hypertrophy have focused primarily on small portions of the overall network, integrated computational models provide an opportunity to analyze how multiple pathways interact to affect cardiac hypertrophy. Here, we developed a computational model of the hypertrophy signaling network with 106 species and 193 reactions by integrating 14 established pathways regulating cardiac myocyte growth. Other models of hypertrophy have been constructed to increase understanding of individual pathways in the network. A previous model of the inositol 1,4,5-trisphosphate-calcineurin pathway used sensitivity analysis to show that differences in receptor kinetics and density explained the differences in inositol 1,4,5-trisphosphate transients induced by endothelin-1 and angiotensin II (8). A different model of the calcineurin pathway was used to elucidate the role of modulatory calcineurin-interacting protein (MCIP) in a negative feedback loop in calcineurin/NFAT signaling that requires a large threshold of NFAT to induce MCIP expression (7). These studies successfully used systems analysis tools to gain new insights about the composition of signaling pathways related to hypertrophy. We built a more comprehensive model of the larger network to study how network organization and interactions between network components affect the differential regulation of transcription factors, gene expression, and myocyte size.
Network motif analysis revealed an enrichment of bi-fan and bi-parallel motifs, network building blocks that could accelerate the development of hypertrophy and impede its reversal. Bi-fan motifs indicate a high level of cross-talk and further motivate the need for integrative systems techniques that examine the larger network to better understand hypertrophic signaling. Bi-parallel motifs are a type of four-node feed-forward loop. Feed-forward loops have been shown in mathematical models and Escherichia coli transcriptional regulation to accelerate signaling and increase robustness of the network by delaying output reversal when the upstream signal is removed (16). This facilitates output stability with the transient loss of an input (27). These properties can be further tuned by adjusting parameters in the network such as thresholds and reaction rates (28). As experimental data become available, reaction parameters of individual motifs can be refined in the hypertrophy signaling network model to study specific feed-forward loops regulating signaling speed and robustness.
Sensitivity analysis was used to inform clustering of the network into modules. Modularity enhances robustness of the function of a particular module and distinct connections between modules enable development of various cell functions (29). Modules in the hypertrophy network were found to be highly interconnected with an enrichment of feed-forward, bi-fan, and bi-parallel motifs. More experimental data are needed to fully characterize the unique role of each of these modules in hypertrophy.
Sensitivity analysis identified species with the greatest effects on cell growth. GSK3β was predicted to negatively regulate cell area, which is consistent with the finding that GSK3β overexpression attenuated the hypertrophy response due to calcineurin, β-adrenergic signaling, and pressure overload (30) and partially reversed hypertrophy due to pressure overload (31). Upstream nodes were in general more influential on the overall network than downstream nodes, which can also be seen in the sensitivity analysis for the β-adrenergic signaling network (12). Ras, a network hub, had the greatest effect on cell area and greater magnitude effects on more species than any other species in the network. The high influence of Ras is consistent with the correlation of network degree and lethality of single gene mutations (21) and the stability of scale-free networks to random node failures and not to attacks on hubs (23).
We tested our model prediction that attack of the hub Ras would have a greater effect on cell area than inhibition of less connected downstream nodes by comparing the level of PE-induced hypertrophy with Ras, JNK, MEK1/2, or p38 inhibitors. As predicted, the Ras inhibitor had the greatest effect on PE-induced hypertrophy. Our experimental results demonstrating reduction in PE induced hypertrophy with inhibition of Ras, JNK, p38, and MEK1/2 are consistent with data from cultured neonatal myocytes (32, 33). Increased cell size was seen in neonatal rat cardiac myocytes with microinjection of an activated Ras mutant (34), overactivated JNK by constitutively active MKK7 (35), overactivated p38 by constitutively active MKK6 (33), and expression of constitutively active MEK1 (36). Although in vitro experiments show pro-hypertrophic effects for JNK, MEK1/2, and p38, in vivo experiments have generated more conflicting results (37). Additional studies are needed to conclusively show the relative contributions of these ligands to various cardiac hypertrophy phenotypes in myocytes.
Reactions in this hypertrophy model were selected based on published data with a preference for experiments using cultured neonatal rat ventricular myocytes. Although neonatal cells are perhaps less physiologically relevant to cardiac hypertrophy compared with adult myocyte or in vivo systems, more complete experimental data on hypertrophy signaling is available from neonatal myocytes. This allowed us to build a more comprehensive signaling network model than would have otherwise been possible. The use of default parameters with equal weighting of all reactions was necessary for this initial model because many of these parameter values are unknown. Weighting and parameter values can be refined as experimental data become available. Similarly, this extensible platform allows newly identified reactions to be added as they are discovered. Experiment model discrepancies highlight areas where additional signaling proteins or reactions may be needed to mechanistically explain experimental observations. The model may therefore be a useful tool for experimental design.
In summary, we developed an integrative model of the hypertrophy signaling network in neonatal ventricular myocytes. Motif analysis revealed a high level of cross-talk and four-node feed-forward motifs in the network, and sensitivity analysis identified the most influential species in hypertrophy and modular organization of the network. We demonstrated the utility of this approach in studying the functional effects of multi-scale signaling network organization on cardiac myocyte hypertrophy.
Acknowledgments
We thank Lindsay McLellan, Alya Elsayed-Ali, and Renata Polanowska-Grabow for technical assistance.
This work was supported by National Institutes of Health Grant HL094476 (to J. S.) and a National Science Foundation graduate fellowship (to K. R.).

This article contains supplemental “Methods,” Tables 1 and 2, Figs. 1–7, Video 1, and data.
- PE
- phenylephrine
- FGF
- fibroblast growth factor
- LIF
- leukemia inhibitory factor.
REFERENCES
- 1. Hill J. A., Olson E. N. (2008) Cardiac plasticity. N. Engl. J. Med. 358, 1370–1380 [DOI] [PubMed] [Google Scholar]
- 2. Heineke J., Molkentin J. D. (2006) Regulation of cardiac hypertrophy by intracellular signaling pathways. Nat. Rev. Mol. Cell Biol. 7, 589–600 [DOI] [PubMed] [Google Scholar]
- 3. Mudd J. O., Kass D. A. (2008) Tackling heart failure in the twenty-first century. Nature 451, 919–928 [DOI] [PubMed] [Google Scholar]
- 4. Lusis A. J., Weiss J. N. (2010) Cardiovascular networks: systems-based approaches to cardiovascular disease. Circulation 121, 157–170 [DOI] [PMC free article] [PubMed] [Google Scholar]
- 5. Saucerman J. J., Brunton L. L., Michailova A. P., McCulloch A. D. (2003) Modeling β-adrenergic control of cardiac myocyte contractility in silico. J. Biol. Chem. 278, 47997–48003 [DOI] [PubMed] [Google Scholar]
- 6. Saucerman J. J., Healy S. N., Belik M. E., Puglisi J. L., McCulloch A. D. (2004) Computational models of whole cells and heterogeneous tissue. Circ. Res. 95, 1216–1224 [DOI] [PubMed] [Google Scholar]
- 7. Shin S. Y., Choo S. M., Kim D., Baek S. J., Wolkenhauer O., Cho K. H. (2006) Switching feedback mechanisms realize the dual role of MCIP in the regulation of calcineurin activity. FEBS Lett. 580, 5965–5973 [DOI] [PubMed] [Google Scholar]
- 8. Cooling M., Hunter P., Crampin E. J. (2007) Modeling hypertrophic IP3 transients in the cardiac myocyte. Biophys. J. 93, 3421–3433 [DOI] [PMC free article] [PubMed] [Google Scholar]
- 9. Ibarra R. U., Edwards J. S., Palsson B. O. (2002) Escherichia coli K-12 undergoes adaptive evolution to achieve in silico predicted optimal growth. Nature 420, 186–189 [DOI] [PubMed] [Google Scholar]
- 10. Chavali A. K., Whittemore J. D., Eddy J. A., Williams K. T., Papin J. A. (2008) Systems analysis of metabolism in the pathogenic trypanosomatid Leishmania major. Mol. Sys. Biol. 4, 177. [DOI] [PMC free article] [PubMed] [Google Scholar]
- 11. Bonneau R., Facciotti M. T., Reiss D. J., Schmid A. K., Pan M., Kaur A., Thorsson V., Shannon P., Johnson M. H., Bare J. C., Longabaugh W., Vuthoori M., Whitehead K., Madar A., Suzuki L., Mori T., Chang D. E., Diruggiero J., Johnson C. H., Hood L., Baliga N. S. (2007) A predictive model for transcriptional control of physiology in a free living cell. Cell 131, 1354–1365 [DOI] [PubMed] [Google Scholar]
- 12. Kraeutler M. J., Soltis A. R., Saucerman J. J. (2010) Modeling cardiac β-adrenergic signaling with normalized-Hill differential equations: comparison with a biochemical model. BMC Syst. Biol. 4, 157. [DOI] [PMC free article] [PubMed] [Google Scholar]
- 13. Shannon P., Markiel A., Ozier O., Baliga N. S., Wang J. T., Ramage D., Amin N., Schwikowski B., Ideker T. (2003) Cytoscape: a software environment for integrated models of biomolecular interaction networks. Genome Res. 13, 2498–2504 [DOI] [PMC free article] [PubMed] [Google Scholar]
- 14. Assenov Y., Ramírez F., Schelhorn S. E., Lengauer T., Albrecht M. (2008) Computing topological parameters of biological networks. Bioinformatics 24, 282–284 [DOI] [PubMed] [Google Scholar]
- 15. Ferro A., Giugno R., Pigola G., Pulvirenti A., Di Pietro C., Purrello M., Ragusa M. (2007) Sequence similarity is more relevant than species specificity in probabilistic backtranslation. BMC Bioinformatics 8, 58. [DOI] [PMC free article] [PubMed] [Google Scholar]
- 16. Alon U. (2007) Network motifs: theory and experimental approaches. Nat. Rev. Genet. 8, 450–461 [DOI] [PubMed] [Google Scholar]
- 17. Omura T., Yoshiyama M., Yoshida K., Nakamura Y., Kim S., Iwao H., Takeuchi K., Yoshikawa J. (2002) Dominant negative mutant of c-Jun inhibits cardiomyocyte hypertrophy induced by endothelin 1 and phenylephrine. Hypertension 39, 81–86 [DOI] [PubMed] [Google Scholar]
- 18. Prasad K. M., Xu Y., Yang Z., Acton S. T., French B. A. (2011) Robust cardiomyocyte-specific gene expression following systemic injection of AAV: in vivo gene delivery follows a Poisson distribution. Gene Ther. 18, 43–52 [DOI] [PMC free article] [PubMed] [Google Scholar]
- 19. Kamakura S., Moriguchi T., Nishida E. (1999) Activation of the protein kinase ERK5/BMK1 by receptor tyrosine kinases. J. Biol. Chem. 274, 26563–26571 [DOI] [PubMed] [Google Scholar]
- 20. Ryall K. A., Saucerman J. J. (2012) Automated imaging reveals a concentration dependent delay in reversibility of cardiac myocyte hypertrophy. J. Mol. Cell Cardiol. 53, 282–290 [DOI] [PMC free article] [PubMed] [Google Scholar]
- 21. Jeong H., Mason S. P., Barabási A. L., Oltvai Z. N. (2001) Lethality and centrality in protein networks. Nature 411, 41–42 [DOI] [PubMed] [Google Scholar]
- 22. Schaub M. C., Hefti M. A., Harder B. A., Eppenberger H. M. (1997) Various hypertrophic stimuli induce distinct phenotypes in cardiomyocytes. J. Mol. Med. 75, 901–920 [DOI] [PubMed] [Google Scholar]
- 23. Albert R., Jeong H., Barabasi A. L. (2000) Error and attack tolerance of complex networks. Nature 406, 378–382 [DOI] [PubMed] [Google Scholar]
- 24. Bain J., Plater L., Elliott M., Shpiro N., Hastie C. J., McLauchlan H., Klevernic I., Arthur J. S., Alessi D. R., Cohen P. (2007) The selectivity of protein kinase inhibitors: a further update. Biochem. J. 408, 297–315 [DOI] [PMC free article] [PubMed] [Google Scholar]
- 25. Hung W. C., Chaung L. Y. (1998) The farnesyltransferase inhibitor, FPT inhibitor III upregulates Bax and Bcl-xs expression and induces apoptosis in human ovarian cancer cells. Int. J. Oncol. 12, 137–140 [PubMed] [Google Scholar]
- 26. Morgan M. A., Dolp O., Reuter C. W. M. (2001) Cell cycle-dependent activation of mitogen-activated protein kinase kinase (Mek-1/2) in myeloid leukemia cell lines and induction of growth inhibition and apoptosis by inhibitors of RAS signaling. Blood 97, 1823–1834 [DOI] [PubMed] [Google Scholar]
- 27. Kalir S., Mangan S., Alon U. (2005) A coherent feed-forward loop with a SUM input function prolongs flagella expression in Escherichia coli. Mol. Syst. Biol. 1, 2005.0006 [DOI] [PMC free article] [PubMed] [Google Scholar]
- 28. Mangan S., Alon U. (2003) Structure and function of the feed-forward loop network motif. Proc. Natl. Acad. Sci. U.S.A. 100, 11980–11985 [DOI] [PMC free article] [PubMed] [Google Scholar]
- 29. Hartwell L. H., Hopfield J. J., Leibler S., Murray A. W. (1999) From molecular to modular cell biology. Nature 402, 47–52 [DOI] [PubMed] [Google Scholar]
- 30. Antos C. L., McKinsey T. A., Frey N., Kutschke W., McAnally J., Shelton J. M., Richardson J. A., Hill J. A., Olson E. N. (2002) Activated glycogen synthase-3 β suppresses cardiac hypertrophy in vivo. Proc. Natl. Acad. Sci. U.S.A. 99, 907–912 [DOI] [PMC free article] [PubMed] [Google Scholar]
- 31. Sanbe A., Gulick J., Hanks M. C., Liang Q., Osinska H., Robbins J. (2003) Reengineering inducible cardiac-specific transgenesis with an attenuated myosin heavy chain promoter. Circ. Res. 92, 609–616 [DOI] [PubMed] [Google Scholar]
- 32. Yue T. L., Gu J. L., Wang C., Reith A. D., Lee J. C., Mirabile R. C., Kreutz R., Wang Y., Maleeff B., Parsons A. A., Ohlstein E. H. (2000) Extracellular signal-regulated kinase plays an essential role in hypertrophic agonists, endothelin-1 and phenylephrine-induced cardiomyocyte hypertrophy. J. Biol. Chem. 275, 37895–37901 [DOI] [PubMed] [Google Scholar]
- 33. Zechner D., Thuerauf D. J., Hanford D. S., McDonough P. M., Glembotski C. C. (1997) A role for the p38 mitogen-activated protein kinase pathway in myocardial cell growth, sarcomeric organization, and cardiac-specific gene expression. J. Cell Biol. 139, 115–127 [DOI] [PMC free article] [PubMed] [Google Scholar]
- 34. Fuller S. J., Gillespie-Brown J., Sugden P. H. (1998) Oncogenic src, raf, and ras stimulate a hypertrophic pattern of gene expression and increase cell size in neonatal rat ventricular myocytes. J. Biol. Chem. 273, 18146–18152 [DOI] [PubMed] [Google Scholar]
- 35. Wang Y., Su B., Sah V. P., Brown J. H., Han J., Chien K. R. (1998) Cardiac hypertrophy induced by mitogen-activated protein kinase kinase 7, a specific activator for c-Jun NH2-terminal kinase in ventricular muscle cells. J. Biol. Chem. 273, 5423–5426 [DOI] [PubMed] [Google Scholar]
- 36. Ueyama T., Kawashima S., Sakoda T., Rikitake Y., Ishida T., Kawai M., Yamashita T., Ishido S., Hotta H., Yokoyama M. (2000) Requirement of activation of the extracellular signal-regulated kinase cascade in myocardial cell hypertrophy. J. Mol. Cell Cardiol. 32, 947–960 [DOI] [PubMed] [Google Scholar]
- 37. Rose B. A., Force T., Wang Y. (2010) Mitogen-activated protein kinase signaling in the heart: angels versus demons in a heart-breaking tale. Physiol. Rev. 90, 1507–1546 [DOI] [PMC free article] [PubMed] [Google Scholar]