

Abstract
One of the major problems facing distance determination by pulsed EPR, on spin-labelled proteins, has been the short relaxation time Tm. Solvent deuteration has previously been used to slow relaxation and so extend the range of distance measurement and sensitivity. We demonstrate here that deuteration of the underlying protein, as well as the solvent, extends the Tm to a considerable degree. Longer Tm gives greatly enhanced sensitivity, much extended distance measurement, more reliable distance distribution calculation and better baseline correction.
Keywords: PELDOR, DEER, Relaxation, EPR, Tm, deuteration
1. Introduction
The pulsed electron-electron double resonance (PELDOR or DEER) experiment [1] [2] can be used to measure, with great accuracy, the distance and distance distribution between unpaired electrons attached to specific locations on macromolecules. PELDOR experiments often use spin labels attached, site specifically, to cysteine residues occurring naturally at convenient positions on proteins or introduced by genetic manipulation. The typical PELDOR experiment is conducted in a frozen glassy deuterated solution at a temperature of 50K. The choice of 50K is a compromise designed to maximize T2 (or Tm) and minimize T1 thus allowing measurement of a long persistent spin echo with a high repetition rate. Because of the non-linear relationship between the frequency of the resultant signal derived from the spin-spin dipolar coupling and the spin-spin distance, it has often been stated that the limit to distance measurement is 80Å. This can be illustrated by consideration of the fact that at 80Å one needs to measure a dipolar oscillation at up to 10us in order to accumulate data describing a full oscillation [3], allowing accurate conversion to distance distribution. To measure a distance of 100Å one would need to extend that time (and by implication the persistence of the observed spin-echo) up to at least 20us, a time that has appeared to be unobtainable in biological systems. Echo dephasing in spin-labeled protein systems is largely caused by a hyperfine coupling to protons in the surrounding environment and consequent spin-diffusion within that environment. Deuteration of solvent is now standard practice and largely eliminates this effect as far as the solvent is concerned however the presence of methyl groups within the protein structure make relaxation via hyperfine coupling to the protein potentially more important (ref) Protein deuteration has been discussed by others [4] [3]. It has been firmly postulated that deuteration of the underlying protein would be expected to have significant effects upon the transverse relaxation (Tm) [5] so allowing PELDOR data to be collected over a much longer time period or alternatively bring significant gains in sensitivity due to the stronger spin-echo signal. It is important to note that deuteration of the nitroxide spin label has previously been used to eliminate strong hyperfine coupling between the electron and the spin-label methyl proteins, thus giving a sharper CW signal, however this does not contribute to a significant increase in Tm because the methyl protons of the spin label are decoupled from spin diffusion of the protein protons due to their large hyperfine coupling. It is predicted that it is protons between about 7 and 25Å that will play a significant role in echo dephasing [3]. The advantages of better sensitivity are obvious in terms of shorter data collection times or the ability to gather data on much lower concentration samples. The advantages of extending the data time over which the echo in the PELDOR experiment is measured brings the possibility of measuring much larger distances than has hitherto been possible or to make the data collected more accurate in its description of distance distributions and less plagued by background subtraction artifacts.
We have previously reported 70Å measurements on the nucleosome core histone octamer H3Q76R1 using PELDOR in deuterated buffer [6; 7]. We report here, relaxation and PELDOR data gathered on the same protein but in a protein deuterated environment.
2. Methods
2.1. Expression of deuterated histones
Total protein deuteration was accomplished using bacterial growth in Spectra9 deuterated growth media (Cambridge Isotope Laboratories Inc).
The four core histones, H2A, H2B, H3 and H4, were expressed in Rosetta 2 cells (Stratagene) from pET3d expression vectors. Histone H3 contained the mutations C110A and Q76C for site directed spin labelling. Freshly transformed cells were grown to stationary phase in 4 ml of 2YT media containing ampicilin and chloramphenicol for selection. The cells were then pelleted, washed once with deuterated media (Spectra9, Cambridge Isoptope Laboratories Inc), pelleted again and used to inoculate a 250ml culture. Cell growth was markedly slower in Spectra9 media, with a doubling time in the order of 60-90 minutes, compared to ~25 minutes. for cells growing in 2YT media. Protein expression was induced by the addition of 1 mM IPTG when the optical density at 600 nm reached 0.6. Induction was carried out at 37 °C for 14 hours.
2.2. Protein purification
Cultures were spun down and re-suspended in 2 ml of Wash Buffer (100mM NaCl, 20mM HEPES-KOH pH7.5, 1mM EDTA, 1% Triton X-100, 1mM DTT) and lysed by sonication. Histones were present in the insoluble fraction, which was further washed once in Wash Buffer and twice in Wash Buffer without Triton X-100. The insoluble histones were dissolved in 4ml of Unfolding Buffer (7M Guanidinium-HCL, 20mM HEPES-KOH pH 7.5, 1mM EDTA, 1mM DTT) and dialysed into SAU200 Buffer (20mM sodium acetate pH 5.2, 7 M urea, 200 mM NaCl, 1mM EDTA, 5 mM β-mercaptoethanol). 0.5ml of cation exchange resin (SP FF, GE Healthcare) was equilibrated with SAU200 buffer in 10mL disposable chromatography columns (Bio-Rad). Dialysed histones were bound to the resin, washed twice with 2mL of SAU200, once with 2mL of SAU400 (400mM NaCl), and eluted in 2mL of SAU800 (800mM NaCl). (figure S1) Fractions were analysed by SDS-PAGE to assess purity (supplementary figure 1). Eluted histones were dialysed into H2O + 5mM β-mercaptoethanol and stored as lyophilates.
2.3. Refolding and labelling
Lyophilised histones were dissolved in Unfolding Buffer, quantified by absorbance at 280 nm and mixed in equimolar amounts. The octamer complex was refolded by dialysis into Refolding Buffer (2M NaCl, 20 mM HEPES-KOH pH 7.5, 1mM EDTA, 5mM β-mercaptoethanol), and purified from mis-folded aggregates by gel filtration on a GL 10/300 column packed with Superdex S200(GE Healthcare). Before gel filtration, 20mM dithiothrietol was added to the sample and incubated at 25°C for 30 minutes to insure complete reduction of the histone H3 labelling site. Gel filtration was carried out in Refolding Buffer without β-mercaptoethanol, and thus additionally served as a desalting step to remove reducing agent before spin labelling. Immediately after gel filtration, fractions containing the correctly folded histone octamer were concentrated, using an Amicon Ultra-4 centrifugal concentrator (Millipore) with a molecular weight cut off of 10,000D, to ~25mM and spin labelled with a ten fold excess of S-(2,2,5,5-tetramethyl-2,5-dihydro-1H-pyrrol-3-yl)methyl methanesulfonothioate (MTSL) at 25°C for 3 hours. Excess MTSL was removed by dialysis verses 2 L of Refolding Buffer without reducing agents at 4 C for 16 hours. Labeled octamer was combined with a 1 fold excess of H2A-H2B dimers, refolded and purified separately, as our previous work had shown that an excess of dimer stabilises the octamer complex [7]. H20 in the refolding buffer was exchanged for D20 by four rounds of sequential concentration and dilution using Amicon® Ultra-4 centrifugal concentrators (Millipore), achieving 99.8% exchange with D2O. The octamer samples were finally concentrated to 100 μM and diluted 1:1 with D8-glycerol (Cambridge Isotope Laboratories Inc), giving a final spin pair concentration of 50 μM, and stored a 4°C until EPR measurements were made.
2.4. Calculating the extent of deuteration
The extent of deuteration was estimated by mass spectrometry. The presence of exchangeable protons in polypeptides complicates the quantification of deteuration by mass spectrometry. Steps were taken to ensure that all exchangeable positions would be in proton form when applied to mass spectrometry.
2.5. EPR experiments
All experiments were executed using a Bruker ELEXSYS E580 spectrometer operating at X-band with a dielectric ring resonator and a Bruker 400U second microwave source unit. All measurements were made at 50 K with the sample in a frozen glassy state. The resonator was overcoupled giving a Q factor of approximately 100. The video bandwidth was set to 20MHz.
Experiments to determine the phase memory time (Tm) were performed by measuring the intensity of a Hahn echo as it decayed with increasing interpulse delay. The pulse sequence used was π/2-t1-π, where the π pulse was 32ns and the initial time delay t1 was 400ns, in addition two-step phase cycling was employed. The inter-pulse delay was increased by 16ns, which meant that the Hahn echo was detected at an increment of 32ns, and the number of data points taken was 1800, thus providing a time window of approximately 58μs. The experiment repetition time was 4ms and 50 shots were taken at each time point. The number of scans used was either four for the non-deuterated H3Q76R1 sample or one for the fully deuterated form.
PELDOR experiments were carried out using the four pulse, dead-time free, sequence with the pump pulse frequency positioned at the center of the nitroxide spectrum; the frequency of the observer pulses was increased by 80MHz. The observer sequence used a 32ns π-pulse; the pump π-pulse was typically 16ns. The experiment repetition time was 4ms and 50 shots were taken at each time point. For the short PELDOR time window of 7.18ms an increment of 20 ns was used and consequently 359 time points were collected. For the long time PELDOR experiment (24.7ms) an increment of 50ns was used, thus leading to 494 time points being collected, which was deemed to provide sufficient resolution for such a long frequency oscillation. In order to be able to carry out this long time experiment it was necessary to increase the delay time between the second observer pulse and the pump pulse to 320ns, this is called the deadtime delay. All PELDOR experiments were run using an 8 step nuclear modulation averaging. For the short time PELDOR, a total of either 48 or 6 scans were accumulated for either the non-deuterated or fully deuterated octameric H3Q76R1 sample, respectively, in order to get a similar standard deviation between the data and the fit. For the long time PELDOR experiment 56 scans were obtained.
2.6. Echo decay analysis
Echo decay curves in a deuterated medium are dominated, initially, by ESEEM oscillations and so Tm was estimated by fitting of equation 1 to the tail end of the data that is largely free of ESEEM [4]
| Equation 1 |
2.7. PELDOR data analysis
In brief, the experimentally obtained time domain trace was processed so as to remove any unwanted intermolecular couplings arising from background decay. Tikhonov regularisation is then used to simulate time trace data that give rise to distance distributions, P(r), of different peak width depending on the regularisation factor, alpha. The alpha term used was judged by reference to a calculated L-curve. The L curve is a parametric plot that compares smoothness of the distance distribution to the mean square deviation. The most appropriate alpha term to be used is at the inflection of the L curve, since this provides the best compromise between smoothness (artifact suppression) and fit to the experimental data. PELDOR data was analysed using the DeerAnalysis2006 software package [8]. The dipolar coupling evolution data was corrected for background echo decay using a homogeneous three-dimensional spin distribution. The starting time for the background fit was optimised to give the best fit to the Pake pattern in the Fourier transformed data and the lowest root mean square deviation background fit.
3. Results
3.1. Deuterated protein yields and deuteration efficiency
The purified yields of histone proteins from Spectra9 medium varied from 3-10 mg/L culture, which is comparable to expression of histones in non-deuterated media. Deuteration levels approaching 100% were achieved in each case. (see table S2 and figure S3).
3.2. Tm Measurements
The values obtained for Tm, by fitting equation 1 to the echo decay curves, are somewhat approximate due to the difficulty of data fitting but are in the order of 6 and 28μs for non-deuterated and deuterated proteins respectively. (figure S4) It is interesting to note that the echo decay curve for the deuterated protein shows, as well as the normally seen deuterium ESEEM oscillations, an extra, low-frequency oscillation that is not apparent in the curve from the non-deuterated protein. Fourier transformation of the decay curve revealed both deuterium ESEEM frequencies and what we believe to be electron-electron dipolar coupling frequencies. (see figure S5). Electron dipole-dipole interactions have been observed in the Fourier transform of ESEEM data from small nitroxide biradicals before but, to our knowledge, has never previously been directly observed in an echo decay curve. The combination of large Tm and a long electron-electron distance seem make this observation possible.
It is quite obvious from figure 1 that protein deuteration yields very significant gains, both in terms of sensitivity enhancement and data collection time. The greatly increased values for Tm on systems recorded at 50K also hold out the possibility of being able to make PELDOR measurements at significantly higher temperatures where decreased Tm values have previously been limiting. Measurements show that the Tm for the deuterated protein at 100K is approximately the same as the non-deuterated protein at 50K (data not shown).
Fig 1.
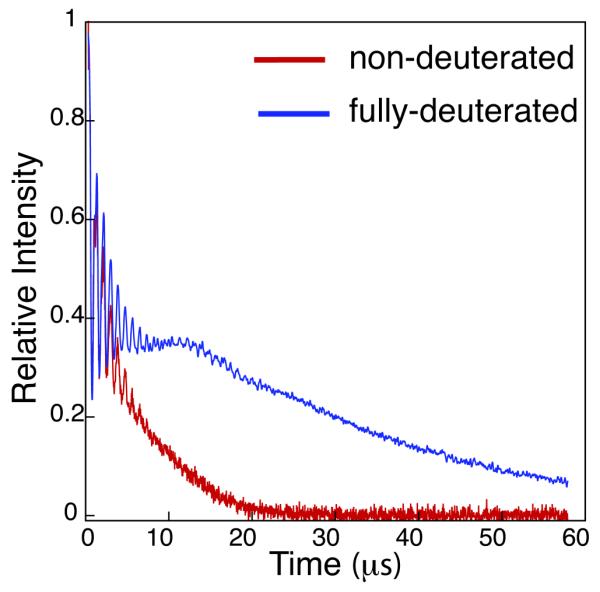
Comparison of the echo decay curves for non-deuterated and fully deuterated spin labelled histone octamer.
3.3. Sensitivity
The PELDOR experiment relies on the eventual detection of oscillations in a spin-echo. To examine the sensitivity advantage of using protein deuteration, we collected data on two protein samples, prepared at identical concentrations, one deuterated and one non-deuterated, taken at a time of 7us, close to the maximal time at which the non-deuterated sample could normally be measured. The non-deuterated sample was run for 15.5 hours (a typical experimental run time) and the deuterated sample (same sample size and concentration) was run under identical conditions until signal/noise were approximately the same. Comparison of the resultant background corrected echo oscillations (figure 2) clearly show that the non-deuterated sample required about 8 times as long to achieve a comparable signal to that obtained for the deuterated protein. The results shown here imply that a deuterated sample as low as 6μM concentration could give a very acceptable result over a 16 hour experiment. It should be noted that the dipolar oscillations are still strong at the echo detection time of 7μs, in both samples.
Figure 2.
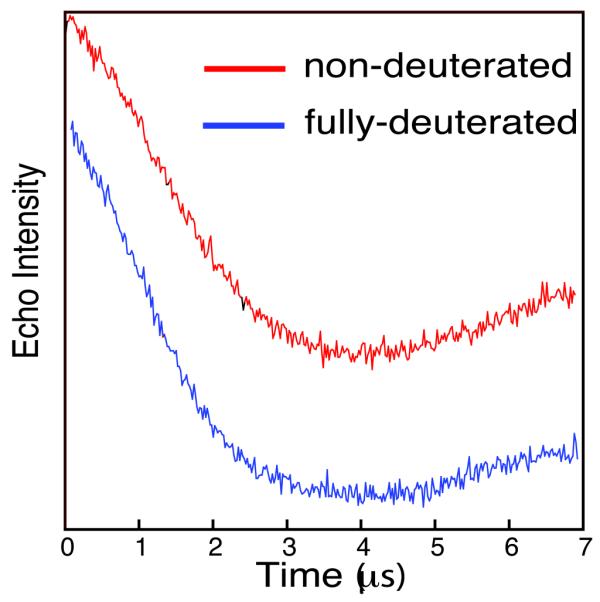
Background corrected PELDOR time traces for non-deuterated(red) and deuterated(blue) nucleosome histone core octamer H3Q76R1. Curves separated for clarity. Deuterated sample run in 2 hours, non-deuterated sample run in 15.5 hours.
3.4. Long distance measurement
To test how the greatly extended Tm could impact on long-distance measurement, we collected PELDOR data out to 25μs. The echo oscillation was clearly visible to 20μs. (figure 3) recording two complete oscillations and allowing good baseline identification at the extreme end. Fourier transformation of the PELDOR data at both 7 and 25μs showed the advantage of the longer time measurement in providing a very well defined Pake pattern at 25μs, in which the peaks at 90o and 0o are clearly visible. As a general rule PELDOR data can be measured at up to twice the Tm and that, to define a meaningful distance distribution, one needs to record between one and two complete echo oscillations. A Tm of 28μs should therefore allow the measurement of distances to well in excess of 100Å.
Figure 3.
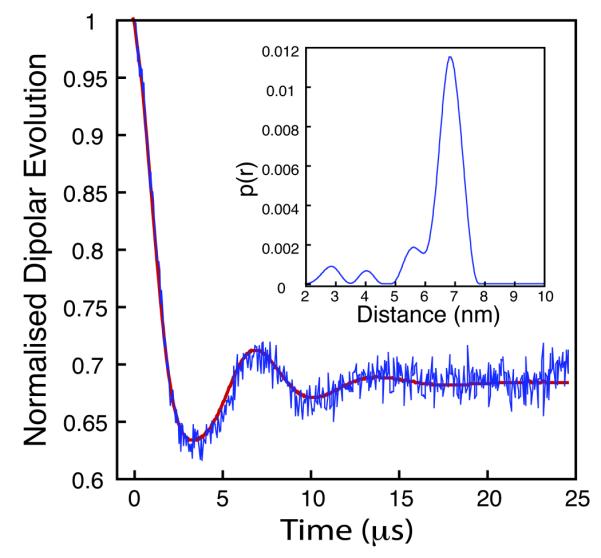
Background corrected PELDOR time trace and Tikhonov fit for deuterated histone core octamer H3Q76R1, 28μs collection time. Insert shows derived distance distribution
The advantage in sensitivity depends on the time period being measured but, as figures 1 and 2 illustrate, it can be very large. It should also be noted that the advantages of long echo persistence include the accuracy of background correction as, if the dipolar oscillations do not completely decay, then fitting a baseline is problematic and can lead to data distortion and over optimistic analysis. The spin labeled protein sample exhibited an oscillation that went well past the point of possible detection in the non-deuterated sample but had decayed to a consistent baseline by 25μs. The observation of several oscillations and the probable damping of all echo oscillation within the time-window available in fully deuterated systems will enable better baseline estimation and subtraction, and so more reliable distance and distance distribution estimation.
4. Discussion
The results described in this paper demonstrate a very significant enhancement of spin-label Tm on deuteration of the underlying protein. Increasing sensitivity has been the aim of a number of studies and include a move to higher frequency [9] and in the case of membrane proteins the use of lipid minidisks [9] or non-spin labeled protein dilution [10], both aimed at reducing relaxation due to molecular crowding. The large gains in echo persistence seen with protein deuteration provide significant gains in sensitivity and these should be additive to the other approaches mentioned. The extreme persistence of the refocused echo in protein deuterated spin labeled samples allows for more complete data acquisition and clearly allows for very long distance measurements far exceeding the normally quoted 80Å.
Supplementary Material
Acknowledgments
This research of was supported by grants from BBSRC (BB/E022286/1) and the EPSRC (EP/F030401/1). A.B. would like to acknowledge receipt of a Wellcome Trust studentship. We thank David Keeble and Graham Smith for discussion
References
- [1].Milov AD, Salikohov KM, Shirov MD. Application of Endor in Electron-Spin Echo for Paramagnetic Center Space Distribution in Solids. Fizika Tverdogo Tela. 1981;23:975–982. [Google Scholar]
- [2].Pannier M, Veit S, Godt A, Jeschke G, Spiess HW. Dead-time free measurement of dipole-dipole interactions between electron spins. Journal of Magnetic Resonance. 2000;142:331–340. doi: 10.1006/jmre.1999.1944. [DOI] [PubMed] [Google Scholar]
- [3].Jeschke G, Polyhach Y. Distance measurements on spin-labelled biomacromolecules by pulsed electron paramagnetic resonance. Physical Chemistry Chemical Physics. 2007;9:1895–1910. doi: 10.1039/b614920k. [DOI] [PubMed] [Google Scholar]
- [4].Lindgren M, Eaton GR, Eaton SS, Jonsson B-H, Hammarstrom P, Svensson M, Carlsson U. Electron spin echo decay as a probe of aminoxyl environment in spin-labeled mutants of human carbonic anhydrase II. Journal of the Chemical Society, Perkin Transactions 2: Physical Organic Chemistry. 1997:2549–2554. [Google Scholar]
- [5].Borbat PP, Freed JH. Measuring distances by pulsed dipolar ESR spectroscopy: Spin-labeled histidine kinases. Two-Component Signaling Systems, Pt B. 2007;423:52–116. doi: 10.1016/S0076-6879(07)23003-4. [DOI] [PubMed] [Google Scholar]
- [6].Ward R, Bowman A, El-Mkami H, Owen-Hughes T, Norman DG. Long Distance PELDOR Measurements on the Histone Core Particle. Journal of the American Chemical Society. 2009;131:1348. doi: 10.1021/ja807918f. [DOI] [PMC free article] [PubMed] [Google Scholar]
- [7].Bowman A, Ward R, El-Mkami H, Owen-Hughes T, Norman DG. Probing the (H3-H4)(2) histone tetramer structure using pulsed EPR spectroscopy combined with site-directed spin labelling. Nucleic Acids Research. 2010;38:695–707. doi: 10.1093/nar/gkp1003. [DOI] [PMC free article] [PubMed] [Google Scholar]
- [8].Jeschke G, Chechik V, Ionita P, Godt A, Zimmermann H, Banham J, Timmel CR, Hilger D, Jung H. DeerAnalysis2006 a Comprehensive Software Package for Analyzing Pulsed ELDOR Data Applied Magnetic Resonance. 2006;30:473–498. [Google Scholar]
- [9].Zou P, Mchaourab HS. Increased Sensitivity and Extended Range of Distance Measurements in Spin-Labeled Membrane Proteins: Q-Band Double Electron-Electron Resonance and Nanoscale Bilayers. Biophysical Journal. 2010;98:L18–L20. doi: 10.1016/j.bpj.2009.12.4193. [DOI] [PMC free article] [PubMed] [Google Scholar]
- [10].Endeward B, Butterwick JA, MacKinnon R, Prisner TF. Pulsed Electron-Electron Double-Resonance Determination of Spin-Label Distances and Orientations on the Tetrameric Potassium Ion Channel KcsA. Journal of the American Chemical Society. 2009;131:15246–15250. doi: 10.1021/ja904808n. [DOI] [PMC free article] [PubMed] [Google Scholar]
Associated Data
This section collects any data citations, data availability statements, or supplementary materials included in this article.