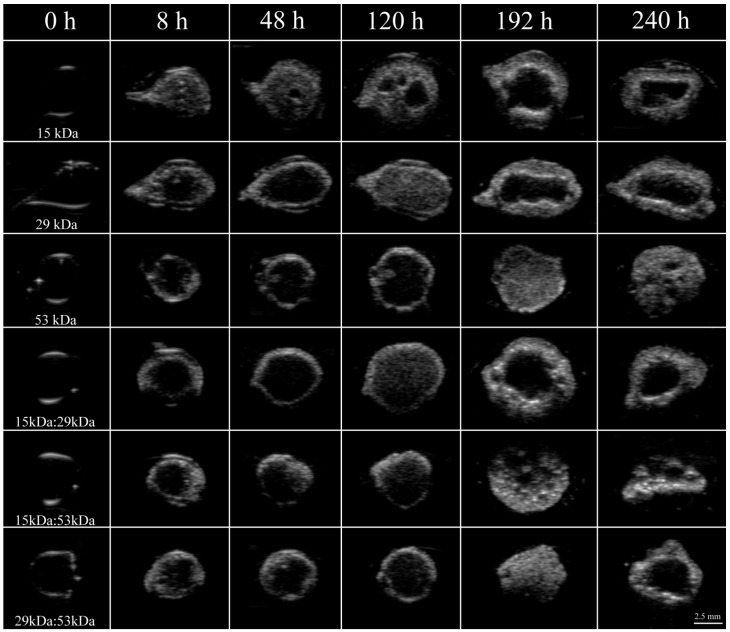
Figure 1.
Representative ultrasound images of the same implant over a period of 10 days for all six formulations examined in this study. Whiter areas represent precipitated polymer while darker areas suggest a mixture of water, solvent and remaining dissolved PLGA. Row 1 is 15 kDa implants, row 2 is 29 kDa implants, row 3 is 53 kDa implants, row 4 is 15kDa:29kDa blend, row 5 is 15kDa:53kDa blend, and row 6 is 29kDa:53kDa blend. Pore is indicated by the arrow.

