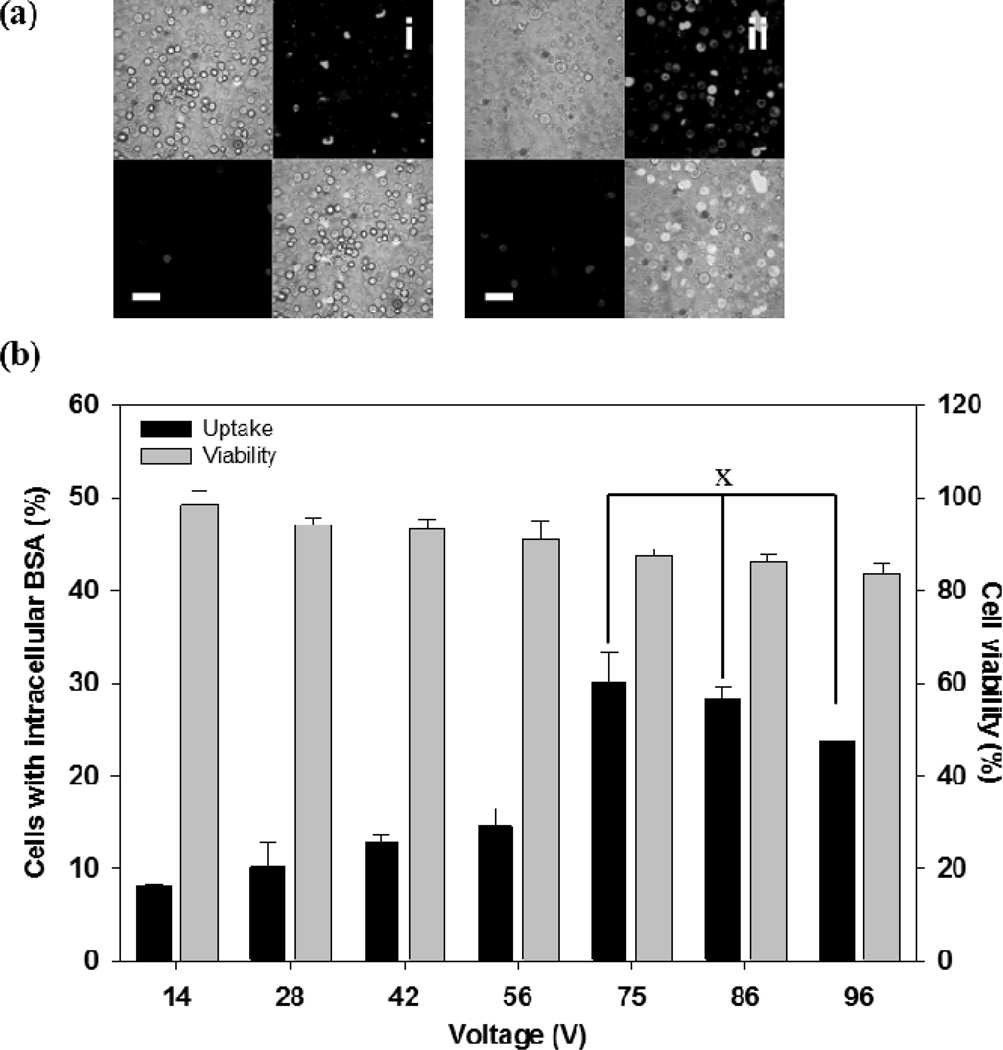
Figure 5.
Effect of voltage on intracellular BSA uptake after electroporation with a microneedle electrode device. (a) Representative confocal microscopic images of the human prostate cancer cells after delivering FITC-BSA using a 2.5 ms exponential decay pulse. Each picture contains 4 sections, and each section represents an image taken by a different channel (top left: brightfield, top right: green fluorescence, bottom left: red fluorescence, bottom right: combination of all channels). Additional images can be seen in Supplemental Figure S3. (i) Unpulsed control, (ii) 75 V (scale bar = 50 µm). (b) Uptake efficiency of BSA and cell viability at different voltages. Data represent the average of n=3 replicate experiments. Standard deviation bars are shown. × not significantly different (ANOVA, p > 0.05)

