

Abstract
Notch Signaling has been demonstrated to have a central role in Glioblastoma (GBM) Cancer Stem Cells (CSCs) and we have demonstrated recently that Notch pathway blockade by γ-secretase inhibitor (GSI) depletes GBM CSCs and prevents tumor propagation both in vitro and in vivo. In order to understand the proteome alterations involved in this transformation, a dose-dependent quantitative mass spectrometry (MS) based proteomic study has been performed based on global proteome profiling and a target verification phase where both Immunoassay and a Multiple Reaction Monitoring (MRM) assay are employed. The selection of putative protein candidates for confirmation poses a challenge due to the large number of identifications from the discovery phase. A multilevel filtering strategy together with literature mining is adopted to transmit the most confident candidates along the pipeline. Our results indicate that treating GBM CSCs with GSI induces a phenotype transformation towards non-tumorigenic cells with decreased proliferation and increased differentiation, as well as elevated apoptosis. Suppressed glucose metabolism and attenuated NFR2-mediated oxidative stress response are also suggested from our data, possibly due to their crosstalk with Notch Signaling. Overall, this quantitative proteomic based dose-dependent work complements our current understanding of the altered signaling events occurring upon the treatment of GSI in GBM CSCs.
Keywords: Glioblastoma, Cancer Stem Cells, Label-free, Multiple Reaction Monitoring, Pathway Analysis
Introduction
Glioblastoma multiforme(GBM) is the most aggressive class of brain tumors and 80% of patients with GBM survive only for 1–2 years after diagnosis [1]. The emerging evidence for the involvement of brain cancer stem cells in the initiation and propagation of brain tumors, particularly GBM, allows for the identification of more effective therapeutic targets [2]. Several groups have identified brain tumor CSCs using cell surface markers such as CD133 and CD15 [3–5], although currently there is no universally accepted collection of CSC markers for isolation of a pure population of GBM stem cells [6]. GBM neurosphere cultures are often utilized as an alternative to provide an advanced model for investigating GBM CSCs [7].
The importance of Notch signaling in cancer has been firmly established and it is one of the most intensively studied therapeutic targets in CSCs. Increasing evidence has implicated its central role in GBM [7–10] based on its participation in regulation of self-renewal and cell fate determination in normal stem cells [11]. Therefore, the investigation of the molecular mechanism upon blocking at multiple stages of the Notch signaling cascade become essential where inhibition via γ-secretase inhibitors (GSIs) are the most utilized [6]. We have demonstrated in our previous study that Notch pathway blockade by GSI targets brain tumor CSCs through decreased proliferation and induced differentiation and apoptosis [7, 9, 12].
The conventional biomarker discovery pipeline usually begins with a global unbiased screening stage which is typically MS-based. A quantitative MS proteomic approach has been demonstrated to be a powerful tool in the study of stem cells utilizing either stable isotope labeling methods or label free methods [13–16]. To gain further insight into the effects GSI exerts on Notch signaling and other potential pathways involved in GBM CSCs, we have employed a spectral counting-based label free quantitative proteomic approach to perform a large scale screening in global discovery phase. This initial profiling provides us comprehensive information about the proteome alterations which then requires verification after candidate prioritization via a multilevel filtering strategy. Also, the biomarker discovery pipeline usually involves a secondary targeted quantitative stage which traditionally relies on antibody-based protocols such as ELISA to follow up the proteomics or genomic profiling studies [17].
Currently there has been a trend toward the development of targeted MS as a methodology for confirmation based on the use of MRM [18–19]. The concept of monitoring specific peptides from proteins of interest as an accurate quantification strategy is well established, because MRM offers superior sensitivity and selectivity for the targeted analytes and the precision is further increased by facilitating the chromatographic retention time as another identifier. Due to the complementarity of Immunoassay and MRM, we have explored a combination of these two assays to verify selected high-priority protein candidates. Moreover, literature mining was performed together with Ingenuity Pathway Analysis (IPA) to relate our findings to previous publications in order to broaden our current knowledge about the underlying molecular mechanisms regarding alterations occurring upon GSI treatment in GBM CSCs. A putative altered signaling network is generated to summarize our findings reflecting those in light of previous publications and those newly mined from our data.
Experiments and Materials
1. Cell Culture and Treatments
GBM neurosphere cultures were maintained in Neurocult medium (Stem Cell Technologies, Vancouver, BC, Canada, http://www.stemcell.com) supplemented with epidermal growth factor (10 ng/ml) and fibroblast growth factor (10 ng/ml) as previously described [7, 20]. For treatment studies, cells were plated and allowed to grow overnight in Neurocult medium; Neurocult was then replaced the next morning with medium containing γ-secretase inhibitor([11-endo]-N-(5,6,7,8,9,10-hexahydro-6,9-methanobenzo[a][8]annulen-11-yl)-thiophene-2-sulfonamide, referred to as “GSI” ) [9]dissolved in dimethyl sulfoxide (DMSO) at the concentrations of 0, 2, 10, 50μM. We have shown previously that GSI can block Notch signaling pathway at Hes1 protein expression level starting at 2μM level [7, 9].
2. Cell Lysis and Trypsin Digestion
Cells were harvested on day three and washed twice with PBS (0.01 M phosphate, 0.15 M NaCl, pH 7.4) to remove culture medium. The extraction of whole cell lysates follows the procedure as previously described [16]. Basically cell pellets were resuspended in PPS (3-[3-(1,1-bisalkyloxyethyl)pyridin-1-yl]propane-1-sulfonate,Protein Discovery, Knoxville, TN) powder dissolved in 50 mM Ammonia Bicarbonate at a final concentration of 0.2%(m/v) together with 1% protease inhibitor cocktail. Protein concentration was determined by Micro BCA™ Protein Assay Kit (Pierce/Thermo Scientific, Rockford). Trypsin digestion, cleavage of PPS and purification of peptides were performed sequentially and also follow the same protocol [16]. To be noted, PPS is unique among special surfactants for protein solubilization in that it produces no oily film or cloudy pellet in the protein sample solution which may cause protein losses. The degradation of the reagent through acid-cleavage circumvents the major limitation of conventional protein solubilization protocols where detergent suppresses the ionization of low abundance species. Peptides were then lyophilized to powder and stored in a −80 °C freezer for future use. All chemicals were purchased from Sigma unless mentioned otherwise.
3. Reversed Phase Liquid Chromatography and ESI-Ion Trap Mass Spectrometry
Peptides were reconstituted in a solution of 5% ACN with 0.1% formic acid at a final concentration of 100ng/μl. Reversed phase Liquid Chromatography was performed by a Paradigm MG4 micropump system (Michrom Biosciences Inc., Auburn, CA) connected to a LTQ mass spectrometer (Thermo Finnigan, San Jose, CA). Total tryptic digests of each sample (control and 3 treatments) were directly introduced into a RPLC nano column (3μm x 100 A, 0.075 mm x 150 mm, C18 AQ particles, Michrom) after a desalting nano trap (300 × 50 mm) (Michrom). A 3hr linear gradient with 150min from 5 to 40% ACN, 15min from 5% to 80% ACN and another 15min for equilibrium to 5% ACN was used. The other LTQ parameters are the same as previously described [16]. The separated peptides were then introduced into a LTQ equipped with a nanospray ion source (Thermo Electron). The LTQ was operated in data dependent mode in which one cycle of experiments consisting of one full MS scan was followed by five pairs of zoom scans and MS/MS scans with dynamic exclusion set to 30 s. The capillary temperature was set at 175 °C, spray voltage was 2.8 kV, capillary voltage was 30 V and the normalized collision energy was 35% for fragmentation. Each sample was analyzed in triplicate with each injection of 1μg material.
4. Database Searching and Multilevel Filtering
MS/MS spectra were searched against Uniprot database (updated 05/2010) by SEQUEST search engine incorporated in Proteome Discoverer (version 1.1.0.263). Searching parameters were specified as follows: (1) Fixed modification: carbamidomethylation of Cys residue with a mass shift of 58.1Da; (2) variable modification: oxidation of Met residue with a mass shift of 15.99Da; (3) two missed cleavage sites were allowed; (4) peptide ion mass tolerance: 1.4 Da; (5) fragment ion mass tolerance: 1.0 Da; (6) peptide charges +1, +2, and +3. Searching results were further uploaded to Scaffold (v2.0) as msf format (the default output format from Proteome Discoverer) and global normalization of the spectral counts was performed subsequently. Then a multilevel filtering strategy consisting of four checkpoints is adopted to capture the most confident identifications and differentially expressed proteins. Checkpoint-1 is based on the FDR test from target-decoy database search with a cutoff p-value less than 0.05; Checkpoint-2 is according to the Trans-Proteomic Pipeline (TPP) [21] built in Scaffold. The criteria include protein and peptide probabilities above 95% and a minimum of two unique peptides identified for each protein; Checkpoint-3 is tested by first generating three lists of differentially expressed proteins by applying the student t-test for 0 vs 2μM, 0 vs 10μM and 0 vs 50μM with a threshold p-value less than 0.05 and then retaining proteins that are present in all three lists; Checkpoint-4 is a further filtering based on literature mining to retain proteins that have been previously reported to play important roles in furthering CSC properties and/or Tumorigenesis.
5. Western Blot
Western Blot was performed essentially as previously described [1]. Briefly, 20 μg of total proteins from each sample were separated by 4–20% SDS-PAGE and then transferred to PVDF membranes (Bio-Rad, CA). After being blocked for 2 h, the membranes were incubated with antibodies including polyclonal anti-APC5, polyclonal anti-GFAP, monoclonal anti-ENGO, monoclonal anti-PCNA, polyclonal anti-SODC and monoclonal anti-Actin (Abcam, Cambridge, CA) overnight. After washing three times, the membranes were incubated with peroxidase conjugated goat anti-rabbit or anti-mouse IgG (H+L) for 1 h. The blots were visualized with DAB stain (Vector Laboratory, WI).
6. MRM Assays
For the proteins of interest, the selection criteria of proteolytic signature peptides include: (1) being identified from the LTQ analysis with high confidence; (2) a unique signature of the target protein; (2) a length of 8–20 amino acids; (3) no missed cleavage sites; (4) no post translational modifications. Isotope-labeled standard peptides (purity > 98%) were synthesized by Anaspec (Fremont, CA), where the C-terminal Lysine or Arginine was fully labeled with 13C and 15N. The MRM assay was performed with an Agilent 6410 triple quadrupole MS system equipped with an Agilent 1200 LC (Agilent Technologies, New Castle, DE) in positive ion mode. Synthetic peptides were first reconstituted in 50% methanol. Flow injection analysis (FIA) was used to optimize the fragmentor voltage and collision energy determined by the intensity of precursor ions and product ions, respectively. Up to four transitions from each peptide were chosen to obtain the best signal-to-noise ratio in MRM mode. A C-18 column from Agilent with 1.8μm particle size and 4.6 x 50mm dimension was used for the HPLC separation. The mobile phase is 0.1% formic acid (Solvent A) and 0.1% formic acid in acetonitrile (Solvent B). The linear gradient was 2 to 20% acetonitrile for 1.5 minutes and 20 to 95% acetonitrile for 5 minutes with a flow rate of 0.6ml/min. The desolvation gas temperature is 350C and the capillary voltage is 4000V. The nebulizer pressure is 45 psi and the desolvation gas flow rate is 11 l/min. For the monitoring of sample response, three dose (0, 2, 10μM) points were interrogated with a total sample protein injection of 10μg analyzed in duplicates. Data analysis was carried out by Agilent Mass Hunter Quantitative Analysis Software.
7. Ingenuity Pathway Analysis
The three lists of differentially expressed proteins generated after checkpoint-3 were uploaded to IPA together with their fold changes as three different observations. Pathway analysis was then performed to infer the significantly altered pathways associated with GSI treatments. The significance values for analysis of pathway generation were calculated using the right-tailed Fisher’s Exact Test.
Results and Discussion
1. Protein Identifications and Differential Expression
A one-dimensional separation strategy was adopted in place of a two-dimensional approach used in our previous studies [16, 22] by reducing the particle size of the nanoRPLC column from 5μm to 3μm and prolonging the gradient time from 1hr to 3hrs to avoid protein losses while also saving instrument time. A total of 1127, 929, 854 and 638 proteins were identified for each sample respectively after filtering by a threshold of FDR < 0.05. Detailed information regarding the identifications for each run can be found in Supporting Material 1. Four Venn diagrams showing the overlap of protein identifications between samples of the same condition were also generated to evaluate sampling reproducibility (Supporting Material 2). For example, the three replicated runs for GSI-0μM have identified 681,720 and 725 proteins with 394 shared by all three runs. In order to improve the confidence of protein identifications, a multilevel filtering strategy is employed as shown in Figure 1. A total of 1707 proteins combining all replicate runs across different samples were identified after checkpoint-1 and a fraction of 672 proteins were retained after checkpoint-2. Next, three lists of differentially expressed proteins were generated for each pair (0 vs 2μM, 0 vs 10μM and 0 vs 50μM) by a cut-off p-value < 0.05, resulting in 117, 187 and 213 differentially expressed proteins respectively.
Figure 1.

Overall Workflow
In previous studies, we have already shown that the Notch signaling pathway can be blocked by treating CSCs with 2μM GSI [7, 9, 12]. The results indicate that the changes of related pathways have occurred at the 2μM GSI level, however, this was suggested by monitoring the change of one important protein Hes 1 in the Notch pathway. In this study, we investigated the overall protein profiling of GBM stem cells to reveal global proteome changes upon GSI treatment starting at the 2μM GSI level. Therefore, students’ t-test was applied to choose differentially expressed proteins between GSI-0μM and -2μM. Then we further analyzed the protein changes of GBM stem cells upon treatment of GSI with higher doses (10μM and 50μM). The aim was to discover if the protein changes in Notch signaling and other potential pathways can be intensified by increasing the doses of GSI. Therefore, only proteins exhibiting the same trend of changes under all three concentrations were considered as our candidates. Checkpoint-3 which requires the presence in all three differential expression lists with consistent changing pattern further narrows down the number of putative candidates to 36 (Supporting Material 4).
2. Evaluation of Label-free Quantification
Reproducibility is an essential factor to evaluate the accuracy of a label-free based quantification approach. It is interrogated from three aspects in this study: variation of the number of protein identifications across three technical replicates; the correlation of spectral counts between any two technical replicates within the same sample and the average variation of all protein identifications based on their spectral counts in between the technical replicates. First, the number of total identifications passing checkpoint-1 in each replicate run is similar to each other with a coefficient of variance (CV) of 3%, 1%, 3% and 8% for each of the control and 2, 10, 50μM treatment samples, respectively. Second, high Pearson correlation coefficients are found by comparing any two replicates within the same sample. For example, the coefficient is calculated to be 0.977 between [0.973, 0.982] at 95% confidence level based on the spectral counts assigned to each identified protein between the first and the second technical replicate run of the control sample. A detailed correlation matrix between all twelve observations across different samples can be found in Supporting Material 3. This correlation matrix was also used to generate the clustering graph shown in Figure 2. The four different biological entities are clearly separated with their technical replicates grouped under the same branch. Also, the three treatment groups are more closely associated compared to the control group where 2μM and 10μM dose treatments tend to be more closely related compared to the 50μM treatment. Another way to evaluate the reproducibility is by calculating the average CV (indicated in Supporting Material 2) for all protein identifications across technical replicates. We have observed a consistent ~30% average variation for all four conditions.
Figure 2.

Cluster Analysis based on the correlation matrix. Pearson correlation coefficients are shown between technical replicates within the same group.
3. Selection of Putative Protein Candidates
The list of 36 protein candidates were further screened through literature mining to link their biological roles pertaining to CSCs properties and/or dysregulated events in tumors. A total of 15 high-priority putative candidates were selected as listed in Table 1 and are categorized by different functions: Proliferation, Differentiation, Apoptosis, Tumor Invasion, Oxidative Response and Glycolysis. Four proteins (Proliferating cell nuclear antigen(PCNA), Nestin(NEST), Drebrin (DREB), Superoxide dismutase [Cu-Zn] (SODC)) from different functional categories in this table were selected for validations by either western blot or MRM assays. Three proteins out of this table were also selected because of their association to these investigated functions: Gamma-Enolase(ENOG) (alternatively : neuron-specific enolase (NSE)) for “Proliferation”; Glial fibrillary Acidic Protein (GFAP) for Differentiation; Anaphase promoting complex5 (APC5) for Apoptosis.
Table 1.
List of high-priority protein candidates after multilevel filtering. P-value shown here is the average from the three pairs student t-tests. ↓ indicates down-regulation of a protein after GSI treatment; ↑ indicates up-regulation of a protein after GSI treatment.
| Functions | Accession | Protein Name | Gene Name | P-value |
|---|---|---|---|---|
| Proliferation | PCNA_HUMAN | Proliferating cell nuclear antigen | PCNA | 0.0016 ↓ |
| NEST_HUMAN | Nestin | NES | 0.0067 ↓ | |
| PA2G4_HUMAN | Proliferation-associated protein 2G4 | PA2G4 | 0.0080 ↓ | |
| Differentiation | TBB3_HUMAN | Tubulin beta-3 chain | TUBB3 | 0.0241 ↑ |
| Apoptosis | 1433B_HUMAN | 14-3-3 protein beta/alpha | YWHAB | 0.0028 ↓ |
| VDAC1_HUMAN | Voltage-dependent anion-selective channel protein 1 | VDAC1 | 0.0030 ↓ | |
| 1433T_HUMAN | 14-3-3 protein theta | YWHAQ | 0.0053 ↓ | |
| 1433F_HUMAN | 14-3-3 protein eta | YWHAH | 0.0116 ↓ | |
| PDIA1_HUMAN | Protein disulfide-isomerase | P4HB | 0.0093 ↓ | |
| TCPB_HUMAN | T-complex protein 1 subunit beta | CCT2 | 0.0128 ↓ | |
| 1433E_HUMAN | 14-3-3 protein epsilon | YWHAE | 0.0139 ↓ | |
| Tumor Invasion | DREB_HUMAN | Drebrin | DBN1 | 0.0043 ↓ |
| MYH9_HUMAN | Myosin-9 | MYH9 | 0.0191 ↓ | |
| Oxidative Response | SODC_HUMAN | Superoxide dismutase [Cu-Zn] | SOD1 | 0.0238 ↓ |
| Glycolysis | KPYM_HUMAN | Pyruvate kinase isozymes M1/M2 | PKM2 | 0.0186 ↓ |
4. Validation Through Western Blot
The fold changes of five proteins were validated by western blot experiments for two dose treatments (2μM and 10μM) of an independent control sample. Figure 3 illustrates a consistent dose-dependent pattern detected between the spectral counting method and western blot experiments. PCNA is commonly used as a cell proliferation index and a good candidate for prognosis of tumor and cancer development [23]. The decreased expression pattern of PCNA detected in GBM CSCs in our study agrees with a previous report that disruption of Notch signaling by GSI in tracheal epithelial cells reduces PCNA expression [24] and our previous study showing Notch pathway inhibition by GSI reduces CSC proliferation [7, 9]. ENOG has been used as a neuron stem cell marker [25]. A previous study of different subgroups of GBM tumor-initiating cells shows 70% of ENOG positive cells have developed tumors using a mice xenograft model [26] and the expression of ENOG are only detected in high-grade GBMs [27]. Our finding of down-regulated expression of ENOG may imply that GBM CSCs exhibit a reduced tumor grade as the drug dose increases.
Figure 3.

The upper panel shows the spectral counts detected for each protein across replicate runs within each sample. The lower panel shows the corresponding western blot results. The direction of arrow indicates either up or down-regulated expression.
GFAP was chosen to verify the impact of GSI on the differentiation of GBM CSCs. It has been previously detected in ~78% differentiated brain tumor CSCs and exhibits lack of immunoreactivity in undifferentiated CSCs [28]. Our result of up-regulated GFAP expression indicates the treatment of GSI drives GBM CSCs towards a more differentiated state. There is a minor discrepancy between spectral counting and western blot results when comparing the dose of 2μM to 10μM. Western results shows the expression of GFAP follows a linear trend as the dose increases while the spectral counting results do not suggest the same. This may be due to the low base expression level of GFAP (spectral counts < 10) where the error bar between technical replicates is comparable to the variation between different conditions. For the verification of altered apoptotic activity upon GSI treatment, Anaphase-Promoting Complex, Subunit 5 (APC5) which is a subunit of the multiprotein complex that controls mitotic progression [29] was tested here. It is hypothesized that the abnormal regulation of APC may be involved in malignant transformation through chromosome instability [30] and the inhibition may lead to cell death [31]. Thus, our observation of reduced expression level of APC5 may be an indication of cell cycle failure in GBM CSCs after treatment with GSI which in turn promotes cell death. SODC is an important anti-oxidant enzyme which protects cells from free radical attack and it has been demonstrated to play a critical role in “Reactive Oxygen Species” (ROS) defense and is associated with chemoresistance and malignancy grade in astrocytic brain tumors [32]. Thus, the reduced expression level of SODC detected in our experiments may imply that the GSI treatment may render GBM CSCs more vulnerable to apoptosis by attenuating their cell defense system. Overall, the western blot results of these five proteins suggest three areas of impact on GBM CSCs upon GSI treatment: reduced proliferative potential, increased differentiation, and enhanced apoptotic activity. All of these could be viewed as a decrease of stem cell properties, leading to a phenotype change.
5. Validation Through MRM
In addition to immunoassay, MRM is also employed as another orthogonal verification strategy to validate the turnover of an important candidate NESTINs in this study. NESTIN has been identified as a neural stem cell marker and a GBM CSC marker [9, 28, 33]. We and others have demonstrated previously that NESTIN expression is enhanced by Notch signaling in medulloblastoma [9] and GBM [34] and is inhibited by GSI in a dose-dependent fashion [7] in GBM CSCs. These findings were obtained by immunostaining related approaches. Herein, a MS-based method was used to confirm the impact of the drug on NESTIN expression in GBM CSCs.
Two peptides from NESTIN were chosen according to the peptide selection criteria described in the experimental section. Table 2 shows the parent and fragment ion masses for the target peptides and heavy standard peptides. The most intense ions were selected for monitoring. Supporting Material 5 shows the MS/MS spectra used for the selection of the transitions. A total of four transitions were monitored for light and heavy GPPAPAPEVEELAR, and two transitions for light and heavy SLETEILESLK. Supporting Material 6 shows representative transitions for these peptides in 0 μM, 2 μM and 10 μM GSI-treated samples, while Supporting Material 7 shows all of the measured transitions for light and heavy SLETEILESLK. As expected, all transitions from each targeted peptide and its corresponding heavy standard were eluted at the same time.
Table 2.
Summary of the target peptides information and the transitions used for MRM analysis of Nestin.
| Peptide | Sequence | Label Type | Charge | Parent Ion | Product Ion |
|---|---|---|---|---|---|
| Pep-1 | SLETEILESLK | unlabeled | 2+ | 631.4 | 173 |
| 201 | |||||
| SLETEILESLK* | isotope-labeled | 2+ | 635.1 | 173 | |
| 201 | |||||
| Pep-2 | GPPAPAPEVEELAR | unlabeled | 2+ | 716.9 | 127 |
| 155 | |||||
| 252 | |||||
| 323 | |||||
| GPPAPAPEVEELAR* | isotope-labeled | 2+ | 721.7 | 127 | |
| 155 | |||||
| 252 | |||||
| 323 |
K* = Lys(13C615N2); R* = Arg(13C615N4).
The dose-dependent results from label-free data and the MRM data are shown in Figure 4. Basically, the differential expression of NESTIN from the MRM results was consistent with the label-free quantitation data. As demonstrated by both of these methods, NESTIN exhibited reduced expression level along with increased GSI dosage. The expression level of NESTIN was reduced by ~1.3 to 3.5 fold when treating GBM CSCs with 2μM and 10μM GSI. This is in line with our previous report that a reduced mRNA NESTIN expression is detected from ~1.5 to 4 fold after treating GBM CSCs with GSI at 2 and 10μM [7].
Figure 4.

Summary of the comparison between the fold change results obtained from label free quantification by LTQ and MRM quantification by QqQ. The y-axis in the upper bar chart represents a ratio of fold changes by dividing the response from each treatment by control. The response of control is normalized to “1”. The lower panel provides the mean and CV of the spectral counts information for Nestin in each sample. “Spectral Counts” is abbreviated as “Sp”.
6. Altered Signaling Events upon GSI Treatment
Based on the knowledge obtained from a combination of literature mining and data mining, candidate proteins listed in Table 1 and three proteins out of this table that have been verified (APC5, GFAP and ENOG) were integrated to construct a putative altered signaling network after treating GBM CSCs with GSI, as depicted in Figure 5. In addition, another three proteins were also imported: Thioredoxin (THIO/Trx), T-complex protein 1 subunit eta (TCPH/CCT7) and Hexokinase-1(HKX1). The first two proteins successfully passed checkpoint-2 with a p-value less than 0.05 in 0 vs 10μM and 0 vs 50μM treatments although they are not differentially expressed after 2μM treatment. The third protein passed checkpoint-1 but did not pass checkpoint-2 and it shows decreased expression upon 10 and 50μM treatment. The correlation between these proteins and their targeted functions are listed in Table 3.
Figure 5.
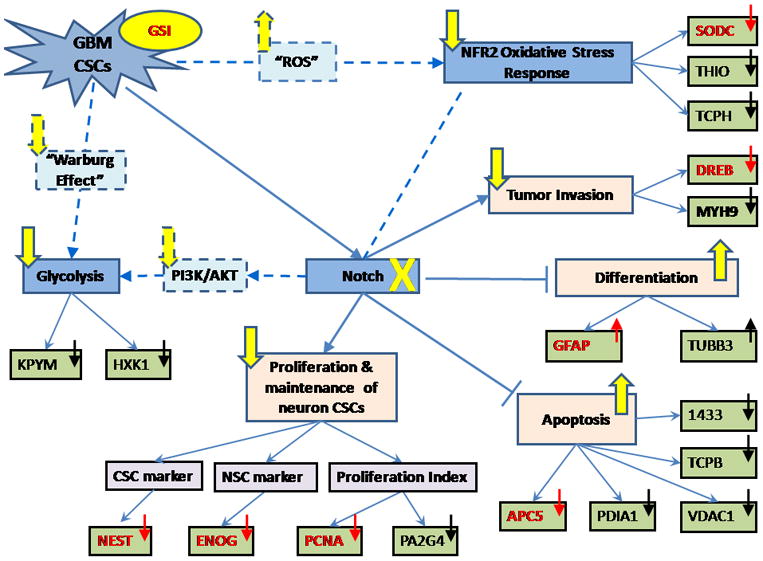
Putative Altered Signaling Events occurring upon treatment of GSI. From our current understanding: GBM CSCs signals Notch pathway leading to a constitutive activation. Sequentially, Notch signaling activates the proliferation and maintenance of the undifferentiated CSCs, while suppressing apoptosis and differentiation. Treating GBM CSCs with GSI impairs Notch signaling and therefore reverses the above effects, which is suggested from our results and previous publications. In addition, NFR2-mediated oxidative response and Glycolysis are also suggested to be down-regulated from our results possibly due to their crosstalk with Notch signaling.
Solid line/arrow indicates a conclusion that is drawn based on our results and/or from previous publications with higher confidence. Dashed line/arrow indicates our hypothesis. The direction of an arrow placed in each node represents up/down-regulation of this protein or signaling pathway, while the arrow used to link adjacent nodes represents activation and the blunt end represents inhibition. Blue arrow/line indicates the native state of GBM CSCs while yellow arrow/line indicates the alterations occurring upon GSI treatment. Black arrow indicates the up/down-regulation detected in this study while red arrow indicates the ones that have been further validated by orthogonal approaches in our experiment.
Table 3.
Correlation between the proteins used for constructing the altered signaling network and their targeted functions. “+” indicates positive association and “−” indicates negative association, which are learned from previous literature publications as listed in the “Reference” column.
| Functions | Protein | Correlation | Reference |
|---|---|---|---|
| Proliferation | PCNA | + | [23,24] |
| NEST | + | [7,9,27,32,33] | |
| PA2G4 | + | [13] | |
| ENOG | + | [25,26] | |
| Differentiation | TBB3 | + | [27] |
| GFAP | + | [27] | |
| Apoptosis | APC5 | − | [30] |
| PDIA1 | − | [39,40] | |
| VDAC1 | − | [41,42] | |
| TCPB | − | [43] | |
| 1433-serise | − | [44,45,46] | |
| Tumor Invasion | DREB | + | [36] |
| MYH9 | + | [47,48] | |
| Oxidative Response | SODC | + | [31] |
| THIO | + | [50,51] | |
| TCPH | + | [52] | |
| Glycolysis | KPYM | + | [59] |
| HKX1 | + | [59] |
The majority of altered signaling events depicted in this figure are mediated through the Notch signaling cascade. Upon blockade of the Notch pathway, proliferation of CSCs is selectively reduced [7] which is supported by our finding of decreased expression level of four key proteins: NESTIN, ENOG, PCNA and Proliferation-associated protein 2G4 (PA2G4). Also, differentiation is induced [7] which can be indicated by the elevated expression levels of two marker proteins for differentiated neural cells: GFAP and Tubulin beta-3 chain (TBB3). Previous studies in Multiple myeloma report that activation of Notch signaling inhibits apoptosis while inhibition of Notch induces apoptosis [35–36]. We also have demonstrated that Notch inhibition by GSI induces apoptosis in medulloblastoma and GBM [7, 9, 12]. Our results are in line with this where the blockade of Notch activates apoptosis in GBM CSCs. This is supported by the detection of a reduced expression level of APC5, Protein disulfide-isomerase (PDIA1), Voltage-dependent anion-selective channel protein 1 (VDAC1), TCPB and 1433 proteins, all of which have been reported to be negatively correlated with apoptosis [31, 37–44]. In addition, decreased tumor invasion capability is inferred and supported by the detection of reduced expression of DREB and Myosin-9 (MYH9) which are identified to be positively correlated with metastasis[45–47].
Another signaling cascade we speculate to be down-regulated is NFR2-mediated Oxidative Response which contributes to cellular protection against oxidative insults and chemical carcinogens [48]. The decreased expression levels of its downstream transcriptional gene products, such as anti-oxidant proteins, SODC and THIO, and a molecular chaperone protein, TCPH, imply that this cellular defense system against “ROS” has been attenuated [32, 49–51]. As aforementioned, treating GBM CSCs with GSI tends to abrogate the stem cell properties [7]. It is thus reasonable to infer that the decreased oxidative defense capability is also correlated with a phenotype transformation from CSCs towards non-tumorigenic cells. This hypothesis is in light of the recent significant discoveries that subsets of CSCs in some tumors contain an enhanced defense system compared to non-tumorigenic progeny suggested by lower “ROS” levels [52–53]. However, it is uncertain at this point that the down-regulation of NFR2-mediated oxidative response is attributed to the direct impact from the impaired γ-secretase activity or via its newly proposed crosstalk mechanism with Notch signaling [54].
In addition, the glucose metabolism pathway Glycolysis is also suggested to be down-regulated. Most cancer cells rely on anaerobic metabolism even with an abundance of oxygen rather than mitochondrial oxidative phosphorylation for normal differentiated cells and the glycolytic rate is increased to compensate for the less efficient production of ATP, a phenomenon referred to as the “Warburg effect” [55]. The expression of two out of three rate-limiting key enzymes in Glycolysis: Pyruvate kinase isozymes M1/M2 (KPYM) and HKX1, were found to be decreased from our label free quantitative data, which may imply a decrease of glycolytic rate after blockade of Notch signaling. This inference regarding the relationship between Notch pathway and Glycolysis could be supported by previous investigations showing that Notch signals promote glucose metabolism mediated by the PI3K/AKT pathway [56] and our previous finding showing that Notch pathway blockade by GSI reduces AKT phoshorylation in medulloblastoma and GBM [7, 9, 12]. Another study of Pre-T cells has also shown that the withdrawal of Notch signaling reduced AKT phosphorylation and decreased the glycolytic rate [57]. Moreover, the PI3K/AKT pathway has been shown to stimulate aerobic glycolysis in cancer cells [58] and directly enhance glucose capture by HKX1 [59]. Therefore, we hypothesize that the blockade of Notch Pathway upon GSI treatment decreases PI3K/AKT signaling which further suppresses Glycolysis. Another explanation to the hypothetical decreased glucose metabolism is that GSI treatment may induce a mechanistic switch back to aerobic metabolism so that the accelerated production of pyruvate is not needed; hence the glucose metabolism is down-regulated. There is no available evidence indicating that the impaired γ-secretase activity has a direct impact on the suppression of Glycolysis.
Another interesting link between NFR2 oxidative response and Glycolysis is the level of “ROS”. The generation of “ROS” has been postulated to be increased as the glycolytic rate is reduced [59] and also as the oxidative defense decreased in non-tumorigenic cells compared to CSCs [53]. We have discussed above our inferences that the treatment of GSI drives a transformation towards non-tumorigenic cells, suppresses the cell defense capability and down-regulates aerobic glycolysis. Thus, it is also reasonable to infer that the level of “ROS” is increased after the treatment in GBM CSCs, although it is uncertain about the alteration mechanism of mitochondrial oxidative phosphorylation which is the major cellular source of “ROS” production.
7. Ingenuity Pathway Analysis
To gain additional insight from our data, an alternative data mining tool was utilized to construct significantly affected canonical pathways upon GSI treatment by IPA. Glycolysis, NFR2-mediated Oxidative Stress Response and PI3K/AKT signaling are captured as the most significant canonical pathways which provide another piece of evidence to support our hypothesis from a bioinformatics perspective. Other important signaling pathways are also shown including VEGF signaling, Cell Cycle and Hypoxia Signaling etc. This may be attributed to the demonstrated crosstalk between Notch signaling and these pathways [60–61] or GSI may also have direct impact on these pathways. The detailed pathway lists can be found in Supporting Material 8. One needs to be careful about the interpretation of the level of the significance between the treatments. The length of the bar indicates a level of association that is by no means indicative of either up or down regulation. Also, most of the pathways appear to be increasingly significant in the third treatment (50μM GSI). This may be because more proteins are differentially expressed between the treatment and the control as the dosage increases. Thus, the increased number of imported proteins may affect the outcome of the statistic algorithm (Fisher’s Exact T-test) adopted by IPA for the calculation of significance by inducing a smaller p-value.
Concluding Remarks
In summary, this work adopts a label free quantitative global proteomic approach together with Immunoassay and MRM assays to conduct a dose-dependent investigation on the proteome alterations upon the treatment of GSI in GBM CSCs. It demonstrates a work-flow from global discovery, candidate prioritization to verification phase which could be applied to other studies as well. By coupling our results with previous literature reports from our group and others, a putative signaling network consisting of 21 candidate proteins with 7 being verified is generated to reflect our inference of the underlying molecular alterations upon GSI treatment. The downstream effects resulting from the blockade of Notch signaling are suggested to include a reduced proliferative potential, an increased differentiation and an elevated apoptotic activity, leading to a phenotype transformation towards non-tumorigenic cells. Novel involvement of the down-regulated NFR2-mediated oxidative stress response and Glycolysis are implied as a consequence of GSI treatment, possibly due to their crosstalk to Notch signaling. These findings regarding the alterations occurring on the proteome level and the signaling/metabolic pathway level provide enriched information that could broaden our current knowledge about drug mechanism, contributing to the identification of novel drug targets to develop better therapies for treating this dismal disease.
Supplementary Material
Acknowledgments
This work was funded under the National Institute of Health Grants R01 49500 (D.M.L.) and R21 CA134623 (D.M.L.) SP acknowledges grant support from the NIDDK, Molecular Phenotyping Core, Michigan Nutrition and Obesity Center (DK089503) and the Doris Duke Foundation. We would like to acknowledge grant support to Dr. Fan from Accelerate Brain Cancer Cure Project Award, American Brain Tumor Association Translational Grant, and Voices Against Brain Cancer Research Grant.
Footnotes
Conflict of interest statement:
The authors have declared no conflict of interest.
References
- 1.Stupp R, Mason WP, van den Bent MJ, Weller M, et al. Radiotherapy plus concomitant and adjuvant temozolomide for glioblastoma. N Engl J Med. 2005;352:987–996. doi: 10.1056/NEJMoa043330. [DOI] [PubMed] [Google Scholar]
- 2.Vescovi AL, Galli R, Reynolds BA. Brain tumour stem cells. Nat Rev Cancer. 2006;6:425–436. doi: 10.1038/nrc1889. [DOI] [PubMed] [Google Scholar]
- 3.Read TA, Fogarty MP, Markant SL, McLendon RE, et al. Identification of CD15 as a marker for tumor-propagating cells in a mouse model of medulloblastoma. Cancer Cell. 2009;15:135–147. doi: 10.1016/j.ccr.2008.12.016. [DOI] [PMC free article] [PubMed] [Google Scholar]
- 4.Ward RJ, Lee L, Graham K, Satkunendran T, et al. Multipotent CD15+ cancer stem cells in patched-1-deficient mouse medulloblastoma. Cancer Res. 2009;69:4682–4690. doi: 10.1158/0008-5472.CAN-09-0342. [DOI] [PubMed] [Google Scholar]
- 5.Son MJ, Woolard K, Nam DH, Lee J, Fine HA. SSEA-1 is an enrichment marker for tumor-initiating cells in human glioblastoma. Cell Stem Cell. 2009;4:440–452. doi: 10.1016/j.stem.2009.03.003. [DOI] [PMC free article] [PubMed] [Google Scholar]
- 6.Gilbert CA, Ross AH. Cancer stem cells: cell culture, markers, and targets for new therapies. J Cell Biochem. 2009;108:1031–1038. doi: 10.1002/jcb.22350. [DOI] [PMC free article] [PubMed] [Google Scholar]
- 7.Fan X, Khaki L, Zhu TS, Soules ME, et al. NOTCH pathway blockade depletes CD133-positive glioblastoma cells and inhibits growth of tumor neurospheres and xenografts. Stem Cells. 2010;28:5–16. doi: 10.1002/stem.254. [DOI] [PMC free article] [PubMed] [Google Scholar]
- 8.Stockhausen MT, Kristoffersen K, Poulsen HS. The functional role of Notch signaling in human gliomas. Neuro Oncol. 2010;12:199–211. doi: 10.1093/neuonc/nop022. [DOI] [PMC free article] [PubMed] [Google Scholar]
- 9.Fan X, Matsui W, Khaki L, Stearns D, et al. Notch pathway inhibition depletes stem-like cells and blocks engraftment in embryonal brain tumors. Cancer Res. 2006;66:7445–7452. doi: 10.1158/0008-5472.CAN-06-0858. [DOI] [PubMed] [Google Scholar]
- 10.Wang J, Wakeman TP, Lathia JD, Hjelmeland AB, et al. Notch promotes radioresistance of glioma stem cells. Stem Cells. 2010;28:17–28. doi: 10.1002/stem.261. [DOI] [PMC free article] [PubMed] [Google Scholar]
- 11.Chiba S. Notch signaling in stem cell systems. Stem Cells. 2006;24:2437–2447. doi: 10.1634/stemcells.2005-0661. [DOI] [PubMed] [Google Scholar]
- 12.Fan X, Eberhart CG. Medulloblastoma stem cells. J Clin Oncol. 2008;26:2821–2827. doi: 10.1200/JCO.2007.15.2264. [DOI] [PMC free article] [PubMed] [Google Scholar]
- 13.Steiniger SC, Coppinger JA, Kruger JA, Yates J, 3rd, Janda KD. Quantitative mass spectrometry identifies drug targets in cancer stem cell-containing side population. Stem Cells. 2008;26:3037–3046. doi: 10.1634/stemcells.2008-0397. [DOI] [PMC free article] [PubMed] [Google Scholar]
- 14.Bendall SC, Hughes C, Campbell JL, Stewart MH, et al. An enhanced mass spectrometry approach reveals human embryonic stem cell growth factors in culture. Mol Cell Proteomics. 2009;8:421–432. doi: 10.1074/mcp.M800190-MCP200. [DOI] [PMC free article] [PubMed] [Google Scholar]
- 15.Williamson AJ, Smith DL, Blinco D, Unwin RD, et al. Quantitative proteomics analysis demonstrates post-transcriptional regulation of embryonic stem cell differentiation to hematopoiesis. Mol Cell Proteomics. 2008;7:459–472. doi: 10.1074/mcp.M700370-MCP200. [DOI] [PubMed] [Google Scholar]
- 16.Dai L, Li C, Shedden KA, Lee CJ, et al. Quantitative proteomic profiling studies of pancreatic cancer stem cells. J Proteome Res. 2010;9:3394–3402. doi: 10.1021/pr100231m. [DOI] [PMC free article] [PubMed] [Google Scholar]
- 17.Kitteringham NR, Jenkins RE, Lane CS, Elliott VL, Park BK. Multiple reaction monitoring for quantitative biomarker analysis in proteomics and metabolomics. J Chromatogr B Analyt Technol Biomed Life Sci. 2009;877:1229–1239. doi: 10.1016/j.jchromb.2008.11.013. [DOI] [PubMed] [Google Scholar]
- 18.Prakash A, Tomazela DM, Frewen B, Maclean B, et al. Expediting the development of targeted SRM assays: using data from shotgun proteomics to automate method development. J Proteome Res. 2009;8:2733–2739. doi: 10.1021/pr801028b. [DOI] [PMC free article] [PubMed] [Google Scholar]
- 19.Lopez MF, Kuppusamy R, Sarracino DA, Prakash A, et al. Mass spectrometric discovery and selective reaction monitoring (SRM) of putative protein biomarker candidates in first trimester Trisomy 21 maternal serum. J Proteome Res. 2011;10:133–142. doi: 10.1021/pr100153j. [DOI] [PubMed] [Google Scholar]
- 20.Galli R, Binda E, Orfanelli U, Cipelletti B, et al. Isolation and characterization of tumorigenic, stem-like neural precursors from human glioblastoma. Cancer Res. 2004;64:7011–7021. doi: 10.1158/0008-5472.CAN-04-1364. [DOI] [PubMed] [Google Scholar]
- 21.Keller A, Nesvizhskii AI, Kolker E, Aebersold R. Empirical statistical model to estimate the accuracy of peptide identifications made by MS/MS and database search. Anal Chem. 2002;74:5383–5392. doi: 10.1021/ac025747h. [DOI] [PubMed] [Google Scholar]
- 22.Dai L, Li C, Shedden KA, Misek DE, Lubman DM. Comparative proteomic study of two closely related ovarian endometrioid adenocarcinoma cell lines using cIEF fractionation and pathway analysis. Electrophoresis. 2009;30:1119–1131. doi: 10.1002/elps.200800505. [DOI] [PMC free article] [PubMed] [Google Scholar]
- 23.Liu JW, Jiao NZ, Hong HS, Luo TW, Cai HY. Proliferating cell nuclear antigen (PCNA) as a marker of cell proliferation in the marine dinoflagellate Prorocentrum donghaiense Lu and the green alga Dunaliella salina Teodoresco. J Appl Phycol. 2005;17:323–330. [Google Scholar]
- 24.Ma XB, Jia XS, Liu YL, Wang LL, et al. Expression and role of Notch signalling in the regeneration of rat tracheal epithelium. Cell Prolif. 2009;42:15–28. doi: 10.1111/j.1365-2184.2008.00569.x. [DOI] [PMC free article] [PubMed] [Google Scholar]
- 25.Mitchell KE, Weiss ML, Mitchell BM, Martin P, et al. Matrix cells from Wharton’s jelly form neurons and glia. Stem Cells. 2003;21:50–60. doi: 10.1634/stemcells.21-1-50. [DOI] [PubMed] [Google Scholar]
- 26.Prestegarden L, Svendsen A, Wang J, Sleire L, et al. Glioma cell populations grouped by different cell type markers drive brain tumor growth. Cancer Res. 2010;70:4274–4279. doi: 10.1158/0008-5472.CAN-09-3904. [DOI] [PubMed] [Google Scholar]
- 27.Rebetz J, Tian D, Persson A, Widegren B, et al. Glial progenitor-like phenotype in low-grade glioma and enhanced CD133-expression and neuronal lineage differentiation potential in high-grade glioma. PLoS One. 2008;3:e1936. doi: 10.1371/journal.pone.0001936. [DOI] [PMC free article] [PubMed] [Google Scholar]
- 28.Singh SK, Clarke ID, Terasaki M, Bonn VE, et al. Identification of a cancer stem cell in human brain tumors. Cancer Res. 2003;63:5821–5828. [PubMed] [Google Scholar]
- 29.Park KH, Choi SE, Eom M, Kang Y. Downregulation of the anaphase-promoting complex (APC)7 in invasive ductal carcinomas of the breast and its clinicopathologic relationships. Breast Cancer Res. 2005;7:R238–247. doi: 10.1186/bcr978. [DOI] [PMC free article] [PubMed] [Google Scholar]
- 30.Bentley AM, Williams BC, Goldberg ML, Andres AJ. Phenotypic characterization of Drosophila ida mutants: defining the role of APC5 in cell cycle progression. J Cell Sci. 2002;115:949–961. doi: 10.1242/jcs.115.5.949. [DOI] [PubMed] [Google Scholar]
- 31.Wang Q, Moyret-Lalle C, Couzon F, Surbiguet-Clippe C, et al. Alterations of anaphase-promoting complex genes in human colon cancer cells. Oncogene. 2003;22:1486–1490. doi: 10.1038/sj.onc.1206224. [DOI] [PubMed] [Google Scholar]
- 32.Haapasalo H, Kylaniemi M, Paunul N, Kinnula VL, Soini Y. Expression of antioxidant enzymes in astrocytic brain tumors. Brain Pathol. 2003;13:155–164. doi: 10.1111/j.1750-3639.2003.tb00015.x. [DOI] [PMC free article] [PubMed] [Google Scholar]
- 33.Hemmati HD, Nakano I, Lazareff JA, Masterman-Smith M, et al. Cancerous stem cells can arise from pediatric brain tumors. Proc Natl Acad Sci U S A. 2003;100:15178–15183. doi: 10.1073/pnas.2036535100. [DOI] [PMC free article] [PubMed] [Google Scholar]
- 34.Shih AH, Holland EC. Notch signaling enhances nestin expression in gliomas. Neoplasia. 2006;8:1072–1082. doi: 10.1593/neo.06526. [DOI] [PMC free article] [PubMed] [Google Scholar]
- 35.Nefedova Y, Sullivan DM, Bolick SC, Dalton WS, Gabrilovich DI. Inhibition of Notch signaling induces apoptosis of myeloma cells and enhances sensitivity to chemotherapy. Blood. 2008;111:2220–2229. doi: 10.1182/blood-2007-07-102632. [DOI] [PubMed] [Google Scholar]
- 36.Jia XX, Lu ZZ, Wang H, Duan HF, et al. Zhongguo Shi Yan Xue Ye Xue Za Zhi. 2004;12:335–339. [PubMed] [Google Scholar]
- 37.Lovat PE, Corazzari M, Armstrong JL, Martin S, et al. Increasing melanoma cell death using inhibitors of protein disulfide isomerases to abrogate survival responses to endoplasmic reticulum stress. Cancer Res. 2008;68:5363–5369. doi: 10.1158/0008-5472.CAN-08-0035. [DOI] [PMC free article] [PubMed] [Google Scholar]
- 38.Cui Y, Zhu H, Zhu Y, Guo X, et al. Proteomic analysis of testis biopsies in men treated with injectable testosterone undecanoate alone or in combination with oral levonorgestrel as potential male contraceptive. J Proteome Res. 2008;7:3984–3993. doi: 10.1021/pr800259t. [DOI] [PubMed] [Google Scholar]
- 39.Pathil A, Armeanu S, Venturelli S, Mascagni P, et al. HDAC inhibitor treatment of hepatoma cells induces both TRAIL-independent apoptosis and restoration of sensitivity to TRAIL. Hepatology. 2006;43:425–434. doi: 10.1002/hep.21054. [DOI] [PubMed] [Google Scholar]
- 40.Singh TR, Shankar S, Srivastava RK. HDAC inhibitors enhance the apoptosis- inducing potential of TRAIL in breast carcinoma. Oncogene. 2005;24:4609–4623. doi: 10.1038/sj.onc.1208585. [DOI] [PubMed] [Google Scholar]
- 41.Zhao ZL, Li QF, Zheng YB, Chen LY, et al. The aberrant expressions of nuclear matrix proteins during the apoptosis of human osteosarcoma cells. Anat Rec (Hoboken) 2010;293:813–820. doi: 10.1002/ar.21074. [DOI] [PubMed] [Google Scholar]
- 42.Xing H, Zhang S, Weinheimer C, Kovacs A, Muslin AJ. 14-3-3 proteins block apoptosis and differentially regulate MAPK cascades. EMBO J. 2000;19:349–358. doi: 10.1093/emboj/19.3.349. [DOI] [PMC free article] [PubMed] [Google Scholar]
- 43.Rosenquist M. 14-3-3 proteins in apoptosis. Braz J Med Biol Res. 2003;36:403–408. doi: 10.1590/s0100-879x2003000400001. [DOI] [PubMed] [Google Scholar]
- 44.Cao W, Yang X, Zhou J, Teng Z, et al. Targeting 14-3-3 protein, difopein induces apoptosis of human glioma cells and suppresses tumor growth in mice. Apoptosis. 2010;15:230–241. doi: 10.1007/s10495-009-0437-4. [DOI] [PubMed] [Google Scholar]
- 45.Perez-Martinez M, Gordon-Alonso M, Cabrero JR, Barrero-Villar M, et al. F-actin-binding protein drebrin regulates CXCR4 recruitment to the immune synapse. J Cell Sci. 2010;123:1160–1170. doi: 10.1242/jcs.064238. [DOI] [PubMed] [Google Scholar]
- 46.Betapudi V. Myosin II motor proteins with different functions determine the fate of lamellipodia extension during cell spreading. PLoS One. 2010;5:e8560. doi: 10.1371/journal.pone.0008560. [DOI] [PMC free article] [PubMed] [Google Scholar]
- 47.Medjkane S, Perez-Sanchez C, Gaggioli C, Sahai E, Treisman R. Myocardin-related transcription factors and SRF are required for cytoskeletal dynamics and experimental metastasis. Nat Cell Biol. 2009;11:257–268. doi: 10.1038/ncb1833. [DOI] [PMC free article] [PubMed] [Google Scholar]
- 48.Cho HY, Reddy SP, Debiase A, Yamamoto M, Kleeberger SR. Gene expression profiling of NRF2-mediated protection against oxidative injury. Free Radic Biol Med. 2005;38:325–343. doi: 10.1016/j.freeradbiomed.2004.10.013. [DOI] [PubMed] [Google Scholar]
- 49.Gomez-Pastor R, Perez-Torrado R, Cabiscol E, Ros J, Matallana E. Reduction of oxidative cellular damage by overexpression of the thioredoxin TRX2 gene improves yield and quality of wine yeast dry active biomass. Microb Cell Fact. 2010;9:9. doi: 10.1186/1475-2859-9-9. [DOI] [PMC free article] [PubMed] [Google Scholar]
- 50.Ronkainen H, Vaarala MH, Kauppila S, Soini Y, et al. Increased BTB-Kelch type substrate adaptor protein immunoreactivity associates with advanced stage and poor differentiation in renal cell carcinoma. Oncol Rep. 2009;21:1519–1523. doi: 10.3892/or_00000383. [DOI] [PubMed] [Google Scholar]
- 51.Go YM, Craige SE, Orr M, Gernert KM, Jones DP. Gene and protein responses of human monocytes to extracellular cysteine redox potential. Toxicol Sci. 2009;112:354–362. doi: 10.1093/toxsci/kfp205. [DOI] [PMC free article] [PubMed] [Google Scholar]
- 52.Kai K, Arima Y, Kamiya T, Saya H. Breast cancer stem cells. Breast Cancer. 2010;17:80–85. doi: 10.1007/s12282-009-0176-y. [DOI] [PubMed] [Google Scholar]
- 53.Diehn M, Cho RW, Lobo NA, Kalisky T, et al. Association of reactive oxygen species levels and radioresistance in cancer stem cells. Nature. 2009;458:780–783. doi: 10.1038/nature07733. [DOI] [PMC free article] [PubMed] [Google Scholar]
- 54.Wakabayashi N, Shin S, Slocum SL, Agoston ES, et al. Regulation of notch1 signaling by nrf2: implications for tissue regeneration. Sci Signal. 2010;3:ra52. doi: 10.1126/scisignal.2000762. [DOI] [PMC free article] [PubMed] [Google Scholar]
- 55.Warburg O. On the origin of cancer cells. Science. 1956;123:309–314. doi: 10.1126/science.123.3191.309. [DOI] [PubMed] [Google Scholar]
- 56.Palomero T, Dominguez M, Ferrando AA. The role of the PTEN/AKT Pathway in NOTCH1-induced leukemia. Cell Cycle. 2008;7:965–970. doi: 10.4161/cc.7.8.5753. [DOI] [PMC free article] [PubMed] [Google Scholar]
- 57.Ciofani M, Zuniga-Pflucker JC. Notch promotes survival of pre-T cells at the beta-selection checkpoint by regulating cellular metabolism. Nat Immunol. 2005;6:881–888. doi: 10.1038/ni1234. [DOI] [PubMed] [Google Scholar]
- 58.Elstrom RL, Bauer DE, Buzzai M, Karnauskas R, et al. Akt stimulates aerobic glycolysis in cancer cells. Cancer Res. 2004;64:3892–3899. doi: 10.1158/0008-5472.CAN-03-2904. [DOI] [PubMed] [Google Scholar]
- 59.Vander Heiden MG, Cantley LC, Thompson CB. Understanding the Warburg effect: the metabolic requirements of cell proliferation. Science. 2009;324:1029–1033. doi: 10.1126/science.1160809. [DOI] [PMC free article] [PubMed] [Google Scholar]
- 60.Kanamori M, Kawaguchi T, Nigro JM, Feuerstein BG, et al. Contribution of Notch signaling activation to human glioblastoma multiforme. J Neurosurg. 2007;106:417–427. doi: 10.3171/jns.2007.106.3.417. [DOI] [PubMed] [Google Scholar]
- 61.Lee SH, Kim MH, Han HJ. Arachidonic acid potentiates hypoxia-induced VEGF expression in mouse embryonic stem cells: involvement of Notch, Wnt, and HIF-1alpha. Am J Physiol Cell Physiol. 2009;297:C207–216. doi: 10.1152/ajpcell.00579.2008. [DOI] [PubMed] [Google Scholar]
Associated Data
This section collects any data citations, data availability statements, or supplementary materials included in this article.