Lead is a persistent environmental contaminant,[1, 2, 3,Domaille, 2008 #17, 4] as exposure to very low levels of lead can cause neurological, reproductive, cardiovascular, and developmental disorders.[3, 5, 6] Children with variants in iron metabolism genes may be more susceptible to lead absorption and accumulation. [7],[8] The US Center for Disease Control (CDC) set standards stating that a 10–19 μg/dL blood lead level poses a potential threat and diagnostic testing is recommended.[7] Of particular interest is Pb2+ as it interferes with enzymatic heme production.[9]
Heavy metal, such as lead, poisoning has prompted demand for new techniques to selectively identify and study the actions of these metal ions.[7, 10],[4] Currently, the most common detection of lead includes atomic absorption spectrometry,[8] inductively coupled plasma mass spectrometry,[11] and anodic stripping voltammetry,[12] and these instrumentally intensive methods[6, 13] measure only total lead content,[1] and often times require extensive sample preparation. Thus, a simple and inexpensive method for not only detecting, but also quantitating Pb2+ is desirable in real time monitoring of environmental, biological, and industrial samples.
Fluorescence based sensors offer unparalleled sensitivity and thus, have garnered significant interest.[4] Most fluorescent probes for detecting Pb2+ use peptides,[14] proteins,[15] or DNAzymes.[3, 6, 16–18] These probes lack the simplicity that a small molecular probe can offer. In addition, non specific interaction and background fluorescence often act as a deterring factor, which underscores the necessity of a selective lead sensor that can function in aqueous environments.[1–3, 6] To this end, a water soluble fluorescence based small molecule Pb2+ sensor (Leadfluor-1) has showed promise in understanding cellular Pb2+ trafficking.[2] In addition to solubility and sensitivity, selectivity is an important criterion for the success of a sensor. Ideally, the sensor should have high selectivity with a high dynamic range. Herein we present the design, synthesis, and characterization of a new turn-on ratiometric fluorescent lead sensor, 4,4-dimethyl-4H-5-oxa-1,3-dithia-6,11-diaza cyclopenta[a] anthracen-2-one, Leadglow (LG, 7).
LG has a thiol-based binding site, which differs from other fluorophores with more hard donors such as oxygen or nitrogen. Lead is a soft metal and therefore favors sulfur-rich binding sites.[19] The proposed molecule can serve as a highly sensitive and selective fluorescent lead sensor in aqueous samples. LG fluoresces at 465 nm. In the presence of Pb2+, LG fluoresces at 423 nm, with a 5-fold increase in emission intensity, indicating a turn-on response to lead in aqueous solution.
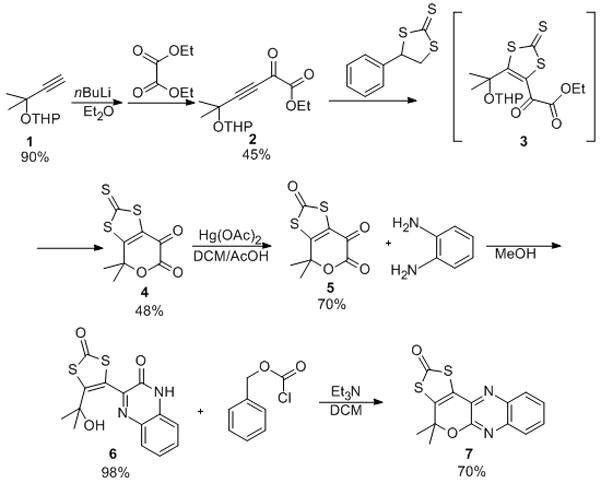
The synthetic procedure to LG is shown in Scheme 1. The reaction of 2-methyl-3-butyn-2-ol and 3,4-dihydro-2H-pyran in the presence of a catalytic amount of p-toluenesulfonic acid results in the protected alcohol 1 in excellent yield. Deprotonation of 1 followed by the addition of diethyl oxalate at low temperature affords 2 in moderate yield. Reaction of the α-keto ester 2 with 4-phenyl 1,3-dithiolane-2-thione allowed us to introduce the protected dithiolene moiety. Direct reaction of 2 with the 4-phenyl 1,3-dithiolane-2-thione affords the intermediate molecule 3 which was transformed to the pyrandione 4 upon addition of trifluoroacetic acid (TFA). Conversely when the same reaction was performed in xylene, the pyrandione 4 was isolated directly in moderate yields. The thione sulfur in 4 was replaced with oxygen using mercury(II) acetate giving the pyrandione, 5, in good yield. The reaction of 5 with o-phenylenediamine in methanol afforded almost quantitatively the quinoxaline compound, 6. Addition of benzylchloroformate and triethylamine to 6 leads to the formation of compound 7 (Leadglow, LG) in good yield. LG was characterized by infrared, NMR (1H and 13C), and UV-visible spectroscopies, and mass spectrometry.
Scheme 1.

Synthetic scheme of Leadglow
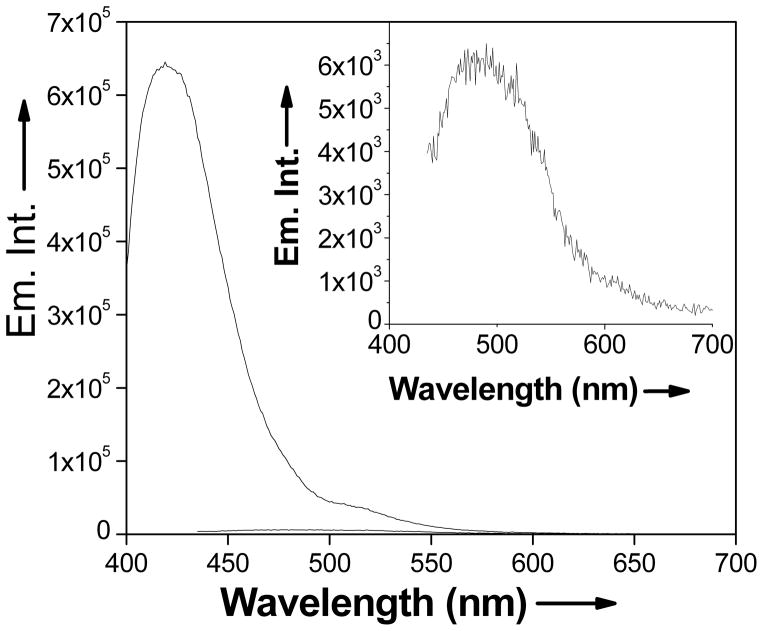
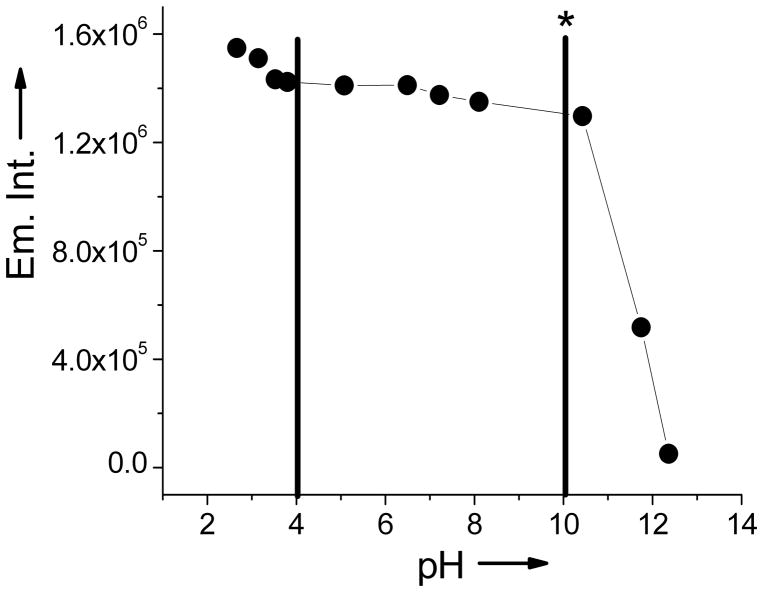
All spectroscopic measurements were performed in 2.5% MeOH and water. NEt4OH was added to the solution (2:1 NEt4OH:LG) to hydrolyze the carbonyl group and expose the thiolato binding site. LG exhibits an absorption band at 415 nm (ε = 1.3 × 10⁵ M−1 cm−1) and an emission band of low intensity (φ = 0.12) at 465 nm. Upon incubation of a solution of LG with lead acetate solution, the absorption band shifts to 389 nm (ε = 1.1 × 10⁵ M−1 cm−1). The emission band also shifts to 423 nm, with a 5-fold increase in the fluorescence intensity (φ = 0.63), thus acting as a ‘turn-on’ sensor (Figure 1). In addition, LG exhibits a shift in the emission energy characteristic feature of a wavelength-ratiometric probe (blue shifted by 42 nm). Thus, like Leadfluor-1, LG acts not only as a turn on sensor, but also as a ratiometric one[2]. Upon binding to lead, Leadflour-1 exerts a larger increase in the emission intensity (18 fold) with a quantum yield of 0.013, LG offers a higher quantum yield (0.63) for the Pb-bound species. LG is versatile and functions well at a wide pH range (Figure 2). The emission intensity of Pb2+ bound LG remains near constant in the pH range from 4 to 10.
Figure 1.
Spectra acquired in 2.5% MeOH and water and NEt4OH (2:1 NEt4OH:LG). Emission spectra of 5 μM free LG (red) and 5 μM Pb2+ bound LG (black). Excitation for free LG provided at 415 nm. Excitation for Pb2+ bound LG (1:2 Pb2+:LG) provided at 389 nm. Emission maximum observed at 423 nm with a 5-fold increase in emission intensity. Inset is a magnification of free LG (5 μM) emission spectra.
Figure 2.
pH profile of Pb2+ bound Leadglow. The complex exhibits a high, constant emission intensity from pH 4 to 10. indicating a wide functional pH range. The asterisk indicates where all selectivity studies were performed.
Binding assays were performed using Job’s method of continuous variation,[20] which indicates a 1:2 Pb2+:LG complex. The apparent dissociation constant for a complex, Kd, for Pb2+ coordination to LG was found to be 217 nM (at pH 10), using the Hill-1 function. LG is very sensitive to Pb2+ in aqueous solution. LG binds to Pb2+ much stronger than Leadfluor-1 (Kd 23 μM).[2] The ‘turn–on’ feature of the sensor allowed detection of a low level (10 ppb) of Pb2+, even in the presence of other metals, using a 1 μM solution of LG. The LG can be used in detecting and determining Pb2+ in the tested range from 1 ppb to 50 ppb. Thus LG offers a high dynamic range for Pb2+ detection. To further examine the sensitivity and accuracy of the sensor, we used a NIST standard of trace elements in water (SRM® 1643e) in the concentration range of 1–50 ppb Pb2+ and probed with 1 μM LG. In this case, accurate fluorescence responses were observed from 50 ppb to as low as 10 ppb. LG was also used in quantitating the concentration of Pb2+ in solutions prepared from a lead standard (NIST SRM® 3128). These results were compared with those obtained from ICPMS measurement. The precisions of the two methods were found to be comparable by F-test and t-test analyses.
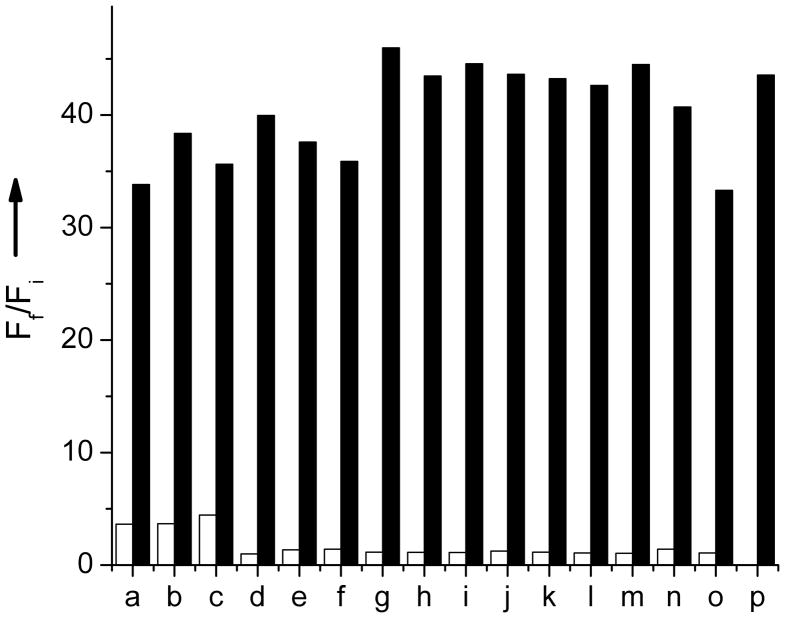
LG is extremely selective for Pb2+ against other common metal ions tested. The fluorescence response of 5 μM LG in the presence of Pb2+ and other ions in aqueous solution are shown in Figure 3. No change in the fluorescence was observed when a solution of LG containing Pb2+ was incubated with 2 mM Li+, Na+, K+, Ca2+, or Mg2+, thus exhibiting a similar properties to Leadfluor-1.[2] These metal ions were tested with higher concentration as they are highly abundant in mammalian cells. Similarly, the fluorescence intensity of LG containing Pb2+ remains unchanged in the presence of 3d transition metals. Thus, 75 μM Fe2+, Co2+, Ni2+, Cu2+, Zn2+, As3+, Sn2+ or Mn2+ ions cause no difference in fluorescence intensity. This clearly demonstrates high selectivity of LG towards Pb2+ which is important for a viable sensor whether investigating an environmental sample (where common heavy metal contamination includes Cd2+, As3+ and Hg2+) or biological sample as plausible cellular targets of toxic lead accumulation include calcium- and zinc-dependent proteins.7,17
Figure 3.
Spectra acquired in 2.5% MeOH and water and NEt4OH (2:1 NEt4OH:LG). Fluorescence response of 5 μM LG to common biologically available cations. The bars represent the final fluorescence response (Ff) over the initial fluorescence response (Fi). White bars represent the addition of each ion (2 mM for Li+, Na+, K+, Ca2+, and Mg2+ and 75 μM for Fe2+, Co2+, Ni2+, Cu2+, Zn2+, Cd2+, Mn2+, Hg2+, As3+, Sn2+, and Pb2+. Black bars represent the addition of 75 μM Pb2+ to the solution. Excitation was provided at 389 nm. a. Li+, b. Na+, c. K+, d. Ca2+, e. Mg2+, f. Fe2+, g. Co2+, h. Ni2+, i. Cu2+, j. Zn2+, k. Cd2+, l. Mn2+, m. Hg2+, n. As3+, o. Sn2+, p. Pb2+.
In conclusion, LG is a new fluorescent sensor that can detect Pb2+ in aqueous solution at a wide pH range (4–10). LG is advantageous because of its sensitivity for Pb2+ at concentrations below the EPA limit, turn-on and ratiometric detection of Pb2+ over other biologically as well environmentally abundant cations, visible excitation and emission profiles, and high optical brightness. LG is useful in determining the amount of Pb2+ in various aqueous samples, as it can detect Pb2+ in a mixture of several other metals at a concentration as low as 10 ppb. This molecular system offers a wide variety of choices from tuning the excitation to specific tagging through selective substitution.
Experimental Section
Synthetic Materials and Methods
Potassium hydroxide, carbon disulfide, and mercuric acetate were purchased from Fisher Scientific and were used as they were received without further purification. The rest of the chemicals were purchased from Acros and were used as they were received without further purification. Standard Reference Material®1643e Trace Elements in Water and 3128 Lead Standard Solution were purchased from National Institute of Standards and Technology and used as received. Column chromatography was performed on Silica gel P60 (Sorbent Technologies). CH2Cl2 was distilled over CaH2, diethyl ether over Na wire/benzophenone and MeOH over Mg. All the other solvents were used without further purification. 1H NMR and 13C NMR spectra were obtained in CDCl3 or CD3OD at 25°C on a Bruker 400 MHz spectrometer. Infrared spectra were obtained on a Nicolet 380 FT-IR (Thermo) spectrometer. APCI-MS were recorded in methanol on a Waters ZMD mass spectrometer set in positive mode (solvent: methanol; cone voltage: 20 V; corona 2.7 kV; source temperature: 130°C; flow rate: 100 μL/min) or negative mode (solvent: methanol; cone voltage: −20 V; corona 2.5 kV; source temperature: 130°C; flow rate: 100 μL/min). ESI-MS were recorded on a Waters ZMD mass spectrometer set in the negative ionization mode (solvent: methanol; cone voltage: 20 V; capillary voltage: 2.9 kV; source temperature: 130°C; flow rate: 150 μL/min). Inductively coupled plasma mass spectrometry was conducted in an Agilent 7500ce equipped with a Shield Torch SYSTEM.
3-Methyl-3-tetrahydropyranyloxy-butyne (1)
3-methyl-3tetrahydropyranyloxy-butyne was prepared according to literature procedure.[21] Dihydropyran (14.7 mL, 160.71 mmol) was added to a cooled (−20°C) solution of 2-methyl-3-butyn-2-ol (9.2 g, 112.53 mmol) in 80 mL of dry CH2Cl2. A few crystals of p-toluensulphonic acid were added to the solution. The solution was stirred for 3 h and then washed with a saturated solution of NaHCO3 (4×30 mL) and the organics were dried over MgSO4. The solvent was removed at reduced pressure and the resulting oil was purified by vacuum distillation. Yield: 15 g (90%). 1H NMR spectrum in CDCl3 (ppm): δ5.06 (m, 1H), 3.95 (m, 2H), 3.50 (m, 2H), 2.43 (s, 1H), 1.85 (m, 2H), 1.70 (m, 2H), 1.51 (s, 6H). 13C NMR spectrum in CDCl3 (ppm): δ 95.97, 86.25, 86.24, 71.78, 70.72, 63.12, 31.80, 30.47, 29.68, 25.29, 20.29. IR spectrum (neat, cm−1): 3295, 2941, 2108, 1466, 1380.
Ethyl-5-methyl-2-oxo-5-(tetrahydro-2H-pyran-2-yloxy)hex-3-ynoate (2)
A solution of 3-methyl-3-tetrahydropyranyloxy-butyne (3.3 g, 19 mmol) in 30 mL Et2O was cooled to 0°C. nButyllithium (11.5 mL, of a 2.5 M solution in hexane, 28 mmol) was added to the previous solution. The resulting solution was stirred for 30 min at 0°C, then cooled to −78°C and diethyl oxalate (4.3 mL, 29.4 mmol) was added. The reaction was followed by TLC (hexane/EtOAc 90:10). After ca. 2 h the reaction mixture was poured into a cold aqueous solution of NH4Cl. The aqueous layer was extracted with Et2O (3×25 mL). The organics were dried over MgSO4. The solvent was removed under reduced pressure and the resulting yellow oil was purified via chromatography (silica gel, hexane/EtOAc 90:10) to afford 2 as a pale yellow liquid. Yield: 2.3 g (45%). 1H NMR spectrum in CDCl3 (ppm): δ 5.10 (m, 1H), 4.38 (q, 2H), 4.36 (m, 2H), 3.96 (m, 2H), 3.54 (m, 2H), 1.85 (m, 2H), 1.75 (m, 2H), 1.64 (s, 3H), 1.59 (s, 3H), 1.40 (t, 3H). 13C NMR spectrum in CDCl3 (ppm): δ 169.3, 158.7, 101.4, 96.2, 81.6, 70.5, 63.1, 31.5, 29.2, 28.9, 25.2, 19.9, 13.8, 13.8. IR spectrum (neat, cm−1): 2209, 1741, 1689. MS-APCI calculated for C14H20O5 [M]−: 268.12, found 267.96.
4,4-Dimethyl-2-thioxo-4H-[1,3]dithiolo[4,5-c]pyran-6,7-dione (4)
4-phenyl-1,3-dithiolane-thione was prepared according to literature procedure.[22] Ethyl-5-methyl-2-oxo-5-(tetrahydro-2H-pyran-2-yloxy)hex-3-ynoate (1.0 g, 3.7 mmol) and 4-phenyl-1,3-dithiolane-thione (2.0 g, 9.3 mmol) were dissolved in xylene (15 mL). The deep yellow solution was refluxed at 140°C for 8 h under Ar. The open intermediate, 3, was treated with a few catalytic drops of trifluoroacetic acid (TFA). The reaction was followed by TLC, eluent: CH2Cl2. The solvent was removed under reduced pressure and purified via chromatography (silica gel, CH2Cl2) to afford 4 as a yellow solid. Yield: 0.31 g (34%). 1H NMR spectrum in CDCl3 (ppm): δ 1.88 (s, 6H). 13C NMR spectrum in CDCl3 (ppm): δ 205.3, 167.7, 162.7, 157.8, 153.6, 83.2, 31.9. IR spectrum (neat, cm−1) 1747, 1681, 1557, 1460. MS-ESI calculated for C7H8O4S2Na [M+Na]+: 268.96, found 268.79.
4,4-Dimethyl-4H-[1,3]dithiolo[4,5-c]pyran-2,6,7-trione (5)
Mercuric acetate (181 mg, 0.568 mmol) was added to 4,4-dimethyl-2-thioxo-4H-[1,3]dithiolo[4,5-c]pyran-6,7-dione (100 mg, 0.406 mmol) in CH2Cl2/AcOH (3:1) and stirred for 30 min. The reaction mixture was filtered through a celite pad to remove the mercury salts. The resulting solution was washed with water (3×15 mL) and saturated NaHCO3 (5×10 mL) and dried over MgSO4. The solvent was removed under reduced pressure to afford 5 as a beige solid. Yield: 40 mg (43%). 1H NMR spectrum in CDCl3 (ppm): δ 1.88 (s, 6H). 13C NMR spectrum in CDCl3 (ppm): δ 184.5, 163.5, 160.4, 153.5, 128.3, 84.2, 31.8. IR spectrum (neat, cm−1) 1746, 1693, 1641, 1552, 1453. MS-ESI calculated for C7H8O4S2Na [M+Na]+: 252.96, found 252.79.
3-(5-(2-Hydroxypropan-2-yl)-2-oxo-1,3-dithiol-4-yl)quinoxalin-2(1H)-one (6)
o-phenylenediamine (50 mg, 0.46 mmol) was added to a stirred solution of 4,4-dimethyl-4H-[1,3]dithiolo[4,5-c]pyran-2,6,7-trione (100 mg, 0.43 mmol) in methanol (15 mL). The solution was stirred overnight. The solvent was removed under reduced pressure and the residue was purified via crystallization from CH2Cl2/hexane affording pure 6 as a light orange solid. Yield: 143 mg (98%). 1H NMR in CDCl3 (ppm): δ 10.40 (bs, 1H), 7.88 (d, 1H), 7.62 (t, 1H), 7.43 (d, 1H), 7.28 (t, 1H), 4.28 (s, 1H), 1.61 (s, 6H). 13C NMR spectrum in CD3OD (ppm): δ 194.6, 158.7, 156.0, 148.2, 136.0, 132.6, 127.9, 125.5, 123.6, 122.3, 119.2, 77.3, 33.8. IR spectrum (neat, cm−1) 1667, 1598. MS-ESI calculated for C14H11N2O3S2 [M-H]−: 319.03, found 318.87.
4,4-Dimethyl-4H-5-oxa-1,3-dithia-6,11-diaza-cyclopenta[a]anthracen-2-one (Leadglow, LG) (7)
3-(5-(2-hydroxypropan-2-yl)-2-oxo-1,3-dithiol-4-yl)quinoxalin-2(1H)-one (140 mg, 0.439 mmol) was partially dissolved in CH2Cl2 (10 mL). Benzylchloroformate (125 μL, 0.81 mmol) and triethylamine (120 μL) were added and the resulting solution was stirred overnight. The volume of the solution was reduced to ca. 3 mL and it was purified via chromatography (silica gel, CH2Cl2) to give pure Leadglow, 7. Yield: 92 mg (70%). 1H NMR spectrum in CDCl3 (ppm): δ 7.96 (d, 1H), 7.83 (d, 1H), 7.66 (t, 1H), 7.60 (t, 1H), 1.84 (s, 6H). 13C NMR spectrum in CDCl3 (ppm): δ 189.0, 152.5, 141.0, 140.7, 139.6, 133.7, 130.5, 128.6, 128.1, 127.5, 124.2, 81.2, 30.0. IR spectrum (neat, cm−1): 1705, 1664, 1624, 1461, 1409. MS-APCI calculated for C14H11N2O2S2 [M+H]+: 303.02, found 302.93. UV-vis in MeOH (λmax, nm (ε, M−1 cm−1): 256 (10988), 367 (11194), 385 (9568). Fluorescence in MeOH: Excitation = 367, 385 nm. Emission = 415 nm. Fluorescence in 2.5% MeOH and water and NEt4OH (1:2, LG: NEt4OH): Excitation = 415 nm. Emission = 465 nm.
Spectroscopic Materials and Methods
All spectroscopic measurements were recorded in a solution of 2.5% methanol (for solubility reason) and water. HPLC grade MeOH and distilled water were used for each measurement. Absorption spectra were measured on a Varian Cary 300 spectrometer. Samples for absorption measurement were performed in 1-cm × 1-cm quartz cuvettes (3.5 mL volume, Starna). Fluorescence spectra were measured on a Photon Technology International Quanta Master ™ 4 spectrofluorometer. Fluorescence measurements were performed in 1-cm × 1-cm quartz cuvettes (3.5 mL volume, NSG Precision Cells). Fluorescence quantum yields were determined in reference to fluorescein in 0.1 NaOH (φ = 0.95).[23] The binding ratio was determined using Job’s method of continuous variation.[20] The binding affinity of Pb2+ to LG was also found. Excitation was provided at 389 nm. The dissociation constant, Kd, was determined by using the Hill1 function in OriginPro 8, which is as follows: y = START + (END – START) × xn / (kn + xn). START is the first data point where the curve begins, END is the last data point where the curve ends, x is the concentration of Pb2+, k is the Kd for the binding reaction, and n is the Hill coefficient or the cooperativity of the dependence on x. A 10 μM solution (1:2:4 Pb2+:LG:NEt4OH) was pH adjusted down by adding AcOH and adjusted up by adding NEt4OH. SRM®1643e Trace Elements in Water (1–50 ppb Pb2+) was probed with 1 μM LG in NEt4OH (2:1 NEt4OH:LG) and 2.5% MeOH and water. LG was able to detect Pb2+ quantitatively by an increase in fluorescence response from 10–50 ppb Pb2+. For ICPMS measurements solutions were scanned for 204Pb, 206Pb, 207Pb, 208Pb isotopes, the sums of the counts for all isotopes were used for analyses. For quantitative analyses, (ICPMS and fluorescence) calibration curves at pH ~6.6, were created using a multi-element (31 elements) calibration standard (ICP-MSCS-M) obtained from High Purity Standards, Charleston, SC. In both cases, linearity with >99% correlation was maintained with Pb2+ concentration in the range 1–50 ppm. Using the linear equations, concentrations of Pb2+ present in samples prepared from lead standard solution (SRM® 3128) via serial dilution were determined. The results from two methods (ICPMS and fluorescence) passed the F-test with 95% confidence limit. The t-test with 95% confidence interval showed the results of the methods are statistically equivalent.
Acknowledgments
We thank the National Institutes of Health for partial financial support of this research. Lauren Marbella is a John V. Crable fellow. We thank Drs. Bernd Hammann, Mizanur Rahman and Mitchell Johnson for experimental assistance and helpful discussions.
References
- 1.Swearingen CB, Wernette DP, Cropek DM, Lu Y, Sweedler JV, Bohn PW. Anal Chem. 2005;77:442. doi: 10.1021/ac0401016. [DOI] [PubMed] [Google Scholar]
- 2.He Q, Miller EW, Wong AP, Chang CJ. J Am Chem Soc. 2006;128:9316. doi: 10.1021/ja063029x. [DOI] [PubMed] [Google Scholar]
- 3.Li J, Lu Y. J Am Chem Soc. 2000;122:10466. [Google Scholar]
- 4.Domaille DW, Que EL, Chang CJ. Nat Chem Biol. 2008;4:168. doi: 10.1038/nchembio.69. [DOI] [PubMed] [Google Scholar]
- 5.Jain AK, Gupta VK, Singh LP, Raisoni JR. Electrochim Acta. 2006;51:2547. [Google Scholar]
- 6.Xiao Y, Rowe AA, Plaxco KW. J Am Chem Soc. 2007;129:262. doi: 10.1021/ja067278x. [DOI] [PubMed] [Google Scholar]
- 7.Hopkins MR, Ettinger AS, Hernandez-Avila M, Schwartz J, Tellez-Rojo MM, Lamadrid-Figueroa H, Bellinger D, Hu H, Wright RO. Environ Health Persp. 2008;116:1261. doi: 10.1289/ehp.11233. [DOI] [PMC free article] [PubMed] [Google Scholar]
- 8.Bannon DI, Murashchik C, Zapf CR, Farfel MR, Chisolm JJJ. Clin Chem. 1994;40:1730. [PubMed] [Google Scholar]
- 9.Labbe RF, Vreman HJ, Stevenson DK. Clin Chem. 1999;45:2060. [PubMed] [Google Scholar]
- 10.Fahrni CJ. Curr Opin Chem Biol. 2007;11:121. doi: 10.1016/j.cbpa.2007.02.039. [DOI] [PubMed] [Google Scholar]
- 11.Aggarwal SK, Kinter M, Herold DA. Clin Chem. 1994;40:1494. [PubMed] [Google Scholar]
- 12.Bannon DI, Chisolm JJJ. Clin Chem. 2001;47:1703. [PubMed] [Google Scholar]
- 13.Feldman BJ, Osterloh JD, Hata BH, D’Alessandro A. Anal Chem. 1994;66:1983. doi: 10.1021/ac00085a010. [DOI] [PubMed] [Google Scholar]
- 14.Deo S, Godwin HA. J Am Chem Soc. 2000;122:174. [Google Scholar]
- 15.Chen P, Greenberg B, Taghavi S, Romano C, van der Lelie D, He CA. Angew Chem Int Ed. 2005;44:2715. doi: 10.1002/anie.200462443. [DOI] [PubMed] [Google Scholar]
- 16.Liu J, Lu Y. J Am Chem Soc. 2003;125:6642. doi: 10.1021/ja034775u. [DOI] [PubMed] [Google Scholar]
- 17.Liu J, Lu Y. J Am Chem Soc. 2004;126:12298. doi: 10.1021/ja046628h. [DOI] [PubMed] [Google Scholar]
- 18.Juewen Liu YL. Angew Chem Int Ed. 2007;46:7587. doi: 10.1002/anie.200702006. [DOI] [PubMed] [Google Scholar]
- 19.Magyar JS, Weng TC, Stern CM, Dye DF, Rous BW, Payne JC, Bridgewater BM, Mijovilovich A, Parkin G, Zaleski JM, Penner-Hahn JE, Godwin HA. J Am Chem Soc. 2005;127:9495. doi: 10.1021/ja0424530. [DOI] [PubMed] [Google Scholar]
- 20.Job P. Ann Chim. 1928;9:113. [Google Scholar]
- 21.Baraldi PG, Barco A, Benetti S, Ferretti V, Pollini GP, Polo E, Zanirato V. Tetrahed. 1989;45:1517. [Google Scholar]
- 22.Culvenor CCJ, Davies W, Pausacker KH. J Chem Soc. 1946:1050. [Google Scholar]
- 23.Brannon JH, Magde D. J Phys Chem. 1978;82:705. [Google Scholar]


