Abstract
Histone acetyltransferase enzymes (HATs) are important therapeutic targets, but there are few cell-based assays available for evaluating the pharmacodynamics of HAT inhibitors. Here we present the application of a FRET-based reporter, Histac, in live cell studies of p300/CBP HAT inhibition, by both genetic and pharmacologic disruption. shRNA knockdown of p300/CBP led to increased Histac FRET, suggesting a role for p300/CBP in the acetylation of the histone H4 tail present. Additionally, we describe a new p300/CBP HAT inhibitor, C107, and show that it can also increase cellular Histac FRET. Taken together, these studies provide a live cell strategy for identifying and evaluating p300/CBP inhibitors.
Keywords: drug design, enzymes, FRET, protein modifications, Histone H4
Introduction
Over the past 15 years, there has been an explosion of interest in the biology and chemistry of epigenetic pathways and mechanisms. Many of the enzymes that catalyze the reversible post-translational modification of histones on lysine residues by acetylation and methylation have received attention as potential drug targets in cancer and other diseases. To date, there have been two histone deacetylase (HDAC) inhibitors approved for clinical use in cutaneous T cell lymphoma,[1] spurring drug discovery campaigns targeted at other histone modifying enzymes. Although potentially equally important as drug targets, progress in the identification and characterization of histone acetyltransferase (HAT) inhibitors has lagged relative to the vigorous advances in HDAC inhibitor development.
The p300 and CBP histone acetyltransferase paralogs have been pursued as potential therapeutic targets in cancer, metabolic disorders, congestive heart failure, and viral diseases.[2] The HAT activity of p300/CBP is proposed to be responsible for acetylation of histones as well as many other cellular proteins, which together regulate many signaling and transcriptional networks.[3] Although p300/CBP activity is essential for mammalian viability,[4] its inhibition is a plausible treatment, as the upregulation or misregulation of p300 or CBP is associated with various diseases,[5] and p300/CBP activity is essential for replication of certain viruses.[6] Several natural and synthetic compounds have been reported to inhibit the action of p300/CBP HAT.[7] One such p300/CBP HAT inhibitor compound, C646,[8] has been used as a tool in a variety of studies from clarifying the mechanism of fate switches in mouse development to interrogating the process of memory extinction.[9]
One of the challenges in chromatin drug discovery, particularly in the field of p300/CBP HAT inhibitor development, is to ensure that compounds are targeting the desired protein in cells. Such target validation has relied heavily on antibodies of varying specificity and other indirect assays. In contrast, live cell reporters have become increasingly popular for the dissection of pathways and the investigation of inhibitors in the study of protein phosphorylation in signaling.[10] These live cell experiments can offer enhanced spatiotemporal resolution, do not rely on antibodies, can overcome the limitations of fixing and permeabilizing cells, and can provide information about single cells rather than bulk readouts on cell populations. To our knowledge, no live cell assay, other than the work reported here, has been established for the analysis of HAT activity.
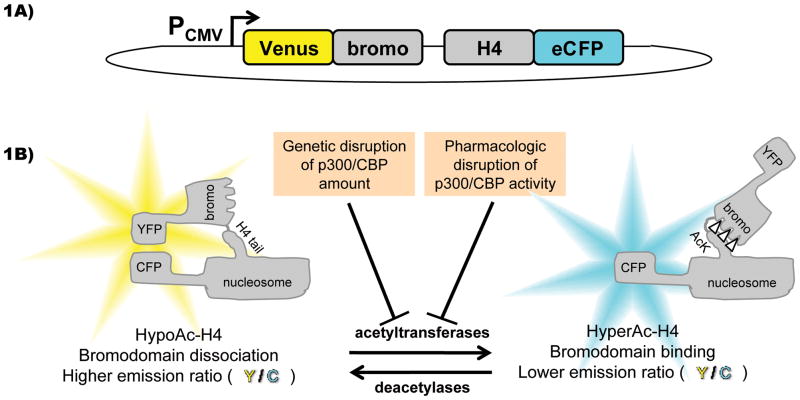
Recently, the live cell FRET-based reporter Histac[11] was developed by fusing the gene for histone H4 with the BrdT double bromodomains flanked by eCFP and Venus fluorescent proteins (Figure 1A). Histac was designed to show a change in FRET upon the acetylation of lysines 5 and 8 in the H4 tail by virtue of a predicted intramolecular conformational change that involves the association of the bromodomains and the acetylated lysines. This unimolecular design, while limiting the dynamic range, simplifies data interpretation due to the 1:1 ratio of the donor:acceptor expression levels. Histac was shown to be incorporated into chromatin and responsive to trichostatin A (TSA)-induced HDAC inhibition and hyperacetylation. In principle, Histac could be used to identify HAT inhibitors and evaluate their effects in living cells.[12] Because cells possess a number of HATs,[13] it was not obvious which HAT(s) would be most influential in histone H4 K5/8 acetylation. Here, we explore the possibility that p300 and/or CBP might be critical enzymes for the acetylation of Histac and use this reporter to study the action of a p300/CBP inhibitor (Figure 1B).
Figure 1.
A FRET-based assay of HAT activity. A) Overall scheme of the Histac reporter fusion protein in the pcDNA3.1+ vector, driven by the CMV promoter (PCMV), which encodes BRDT double bromodomains (bromo) joined to the histone H4, separated by a flexible linker, with yellow and cyan fluorescent protein variants (Venus and eCFP) on either end. B) Action of HAT enzymes (and reversed by HDAC enzymes) should result in acetylation of the histone H4 tail encoded in Histac, which is recognized by the bromodomains also encoded in Histac, and the resultant conformational change is measured (upon excitation of CFP) as a change in emission ratio, calculated as YFP emission divided by CFP emission (Y/C). In this study, we employed the Histac reporter to measure the response to genetic and pharmacologic disruption of p300/CBP.
Results and Discussion
Genetic knockdown of p300 and CBP and Histac FRET increase
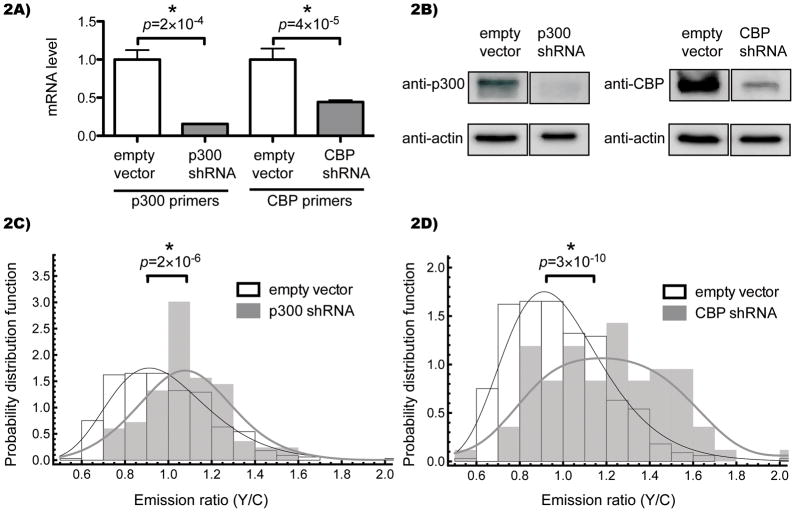
To determine whether p300 and/or CBP could contribute to the FRET readout of the Histac reporter, we stably transfected Cos7 cells with shRNAs to knock down p300 or CBP (for complete data on all shRNAs tested, see Supporting Information). While one could envision that the cells could compensate for this defect through the activation of other functionally redundant HATs, and indeed we only knocked down p300 or CBP singly, we hypothesized that stable knockdown would confer a chronic, if subtle, defect. These shRNAs were effective in reducing p300 and CBP effectively at the RNA and protein level, as demonstrated by qRT-PCR (Figure 2A) and immunoblot (Figure 2B). We then transiently transfected Histac and quantified the emission ratio. Although there was a broad distribution of emission ratios across each population of cells, a statistically significant difference was observed between the Cos7 cells in which either p300 (Figure 2C) or CBP (Figure 2D) had been knocked down and the Cos7 cells with the empty vector control. This increase in FRET in cells with p300 and CBP knockdown is consistent with a state of hypoacetylation on K5/K8 of the Histac reporter.
Figure 2.
Genetic knockdown of p300/CBP induces a FRET increase. A) Cos7 cells stably expressing shRNAs against p300 (NM_001429.x-8437s1c1) or CBP (NM_004380.1-3884s1c1) were harvested, transcriptome cDNA synthesized, and levels of p300 or CBP analyzed by real-time PCR compared to GAPDH control. The averages and standard errors of four technical replicates are shown. B) Whole cell lysates were analyzed by SDS-PAGE followed by immuno blotting against p300, CBP, or β-actin. Images were cropped to show the relevant bands side-by-side. C,D) Cells were transfected with Histac and images captured after 24 hours. Each nucleus was quantified for average pixel intensity (with background from an untransfected region subtracted) in each channel, and the emission ratio of YFP to CFP was calculated for each nucleus. 83 nuclei for p300 knockdown, 84 nuclei for CBP knockdown, and 333 nuclei for empty vector control were analyzed and shown as a histogram of the probability distribution function versus FRET ratio. The empty vector control is shown as open boxes, and knockdowns are shown as grey boxes, with black and grey curves indicating a log-normal fit and a smoothed empirical distribution for empty vector and knockdowns, respectively. The difference in the median FRET ratio was statistically significant when comparing the empty vector to p300 (p = 2×10⁻⁶) and CBP (p = 3×10⁻¹⁰).
Development of C107, a nonfluorescent p300/CBP inhibitor
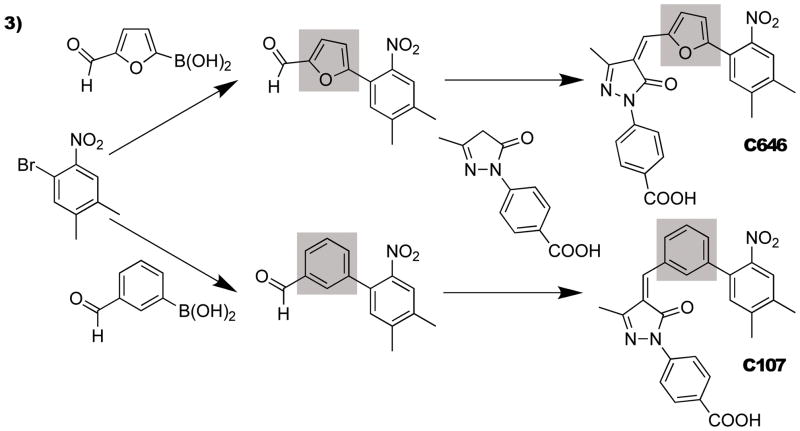
Initially, we examined the potential of a p300/CBP-selective inhibitor, C646, to modulate the Histac reporter in Cos7 cells. Unfortunately, the intrinsic fluorescence of C646 registered a large time-dependent fluorescent change in the relevant spectral region in untransfected Cos7 cells, limiting its use for Histac studies. This prompted us to investigate the characteristics of synthetic derivatives of C646 that might still block p300/CBP HAT activity but circumvent the fluorescent interference exhibited by C646. For this purpose, we pursued the analog C107, in which the furan ring is replaced with a phenyl group (Figure 3). In addition to a possible contribution to C646 fluorescence, furan rings in general are sometimes associated with pharmacokinetic liabilities.[14] Structure-based modeling studies with p300 HAT domain had suggested that the furan replacement would be tolerated. The synthesis of C107 followed a route developed for C646 in which a benzaldeyde building block was used in place of the corresponding furanyl aldehyde (see Supporting Information for complete chemical characterization).
Figure 3.
Synthetic scheme for C646 and its analog, C107.
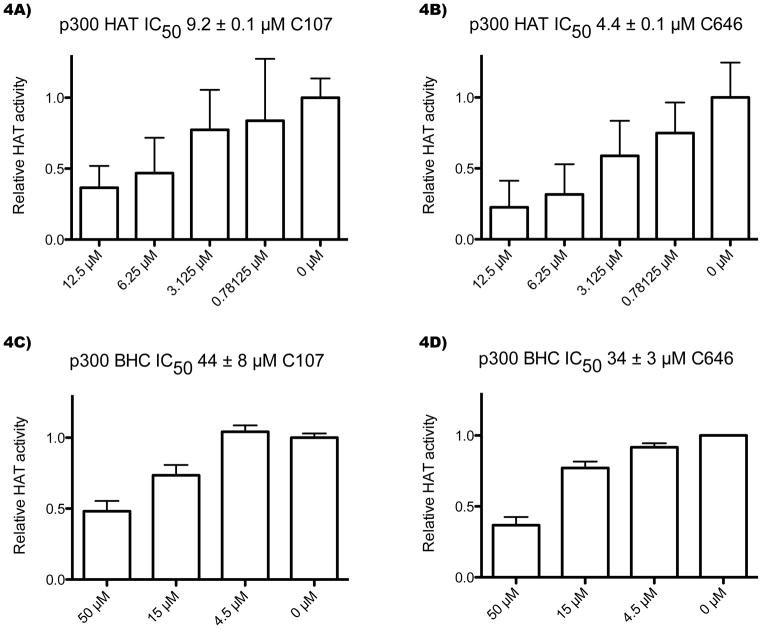
Compound C107 was found to be a moderately potent inhibitor of purified recombinant p300 HAT domain with an IC50 of approximately 9 μM (Figure 4A), about 2-fold less potent than C646 (Figure 4B). We also examined the inhibition of an extended p300 recombinant protein construct containing the bromodomain and C/H3 domain flanking the HAT domain (p300 BHC), which we generated from a baculovirus expression system. p300 BHC is considerably more efficient as a histone acetyltransferase compared with the p300 HAT domain, with a 5-fold higher kcat and 10-fold lower apparent Km for acetyl-CoA (see Supporting Information for kinetic characterization of p300 BHC). Interestingly, both C107 (Figure 4C) and C646 (Figure 4D) showed 4- to 8-fold higher IC50 values with p300 BHC. This result suggests conformational plasticity in the active site may be influenced by domain interactions.
Figure 4.
C107 is an inhibitor of p300 HAT. A–B) Concentration dependence of C107 and C646 inhibition of p300 HAT domain acetyltransferase activity. C107 and C646 experiments were run in parallel. Reactions contained 10 nM p300 HAT domain, 100 μM H4 N-terminal 15-mer peptide, and C107 or C646 compound (with DMSO amounts held constant) were allowed to pre-equilibrate for 12 min, followed by a 10-min reaction at 30°C with 10 μM 14C-acetyl-CoA. The reaction mixtures were separated by Tris-Tricine gel electrophoresis quantified with a phosphorimager, and background subtracted. The averages and standard errors of quadruplicate reactions are shown, and the IC50s were calculated using a nonlinear fit in Grafit. C–D) Concentration dependence of C107 and C646 inhibition of p300 BHC (bromodomain, histone acetyltransferase domain, C/H3 domain) acetyltransferase activity. C107 and C646 experiments were run in parallel. Reactions contained 0.05 nM p300 BHC, 100 μM H4-15mer, and C107 or C646 were allowed to pre-equilibrate for 10 min, followed by a 5-min reaction at 30°C with 0.1 μM 14C-acetyl-CoA. The reactions were analyzed as above, with the C107 experiment conducted with six replicates and the C646 experiment with two replicates.
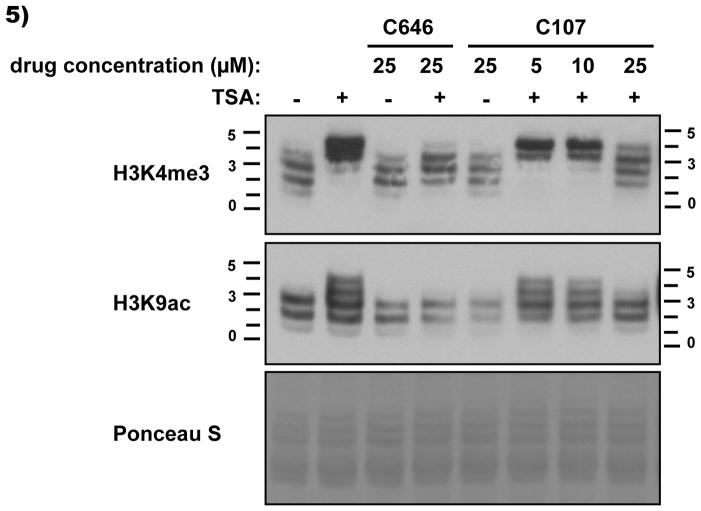
Next, we investigated the potential of C107 to block dynamic histone acetylation in C3H 10T1/2 mouse fibroblasts using acid urea gel western blots. Acetylation can be detected on acid urea gels by the appearance of upper bands, caused by the presence of additional acetyl moieties (on the same histone) reducing the charge on the molecule. As previously reported,[15] the treatment of cells with trichostatin A (TSA) for 30 min can induce a rapid increase in acetylation of histone H3 trimethylated on lysine 4, and pretreatment for 1 h with compound C646 (25 μM) can block this TSA-induced hyperacetylation. Here we show that pretreatment with C107 at 25 μM can achieve a similar effect as C646 (Figure 5), consistent with the possibility that C107 can inhibit p300/CBP HAT activity in cells.
Figure 5.
C107 effects on dynamic cellular histone acetylation. Quiescent C3H 10T1/2 mouse fibroblasts were treated with C646 or C107 for 1 h, followed by harvesting or addition of TSA (trichostatin A, 33 nM) for a further 30 min before harvesting. Histones were extracted and analyzed by Acid-Urea gel. These gels separate histones based on their charge, with individual acetylation events slowing the migration to produce a ‘ladder’ of bands. The numbers on either side of the blot indicate the number of acetyl moieties present on each molecule migrating at these positions. Note that methylation does not affect migration.
C107 pharmacodynamics using Histac
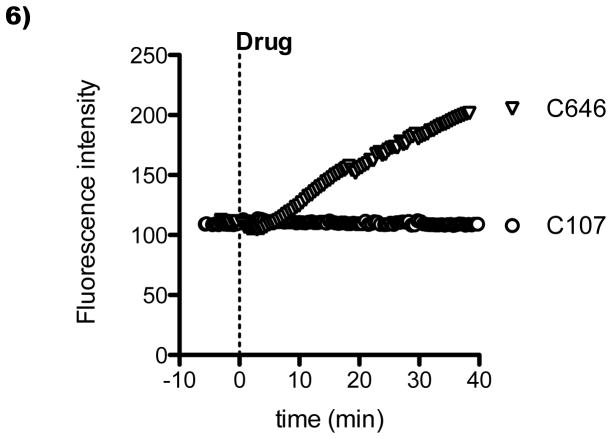
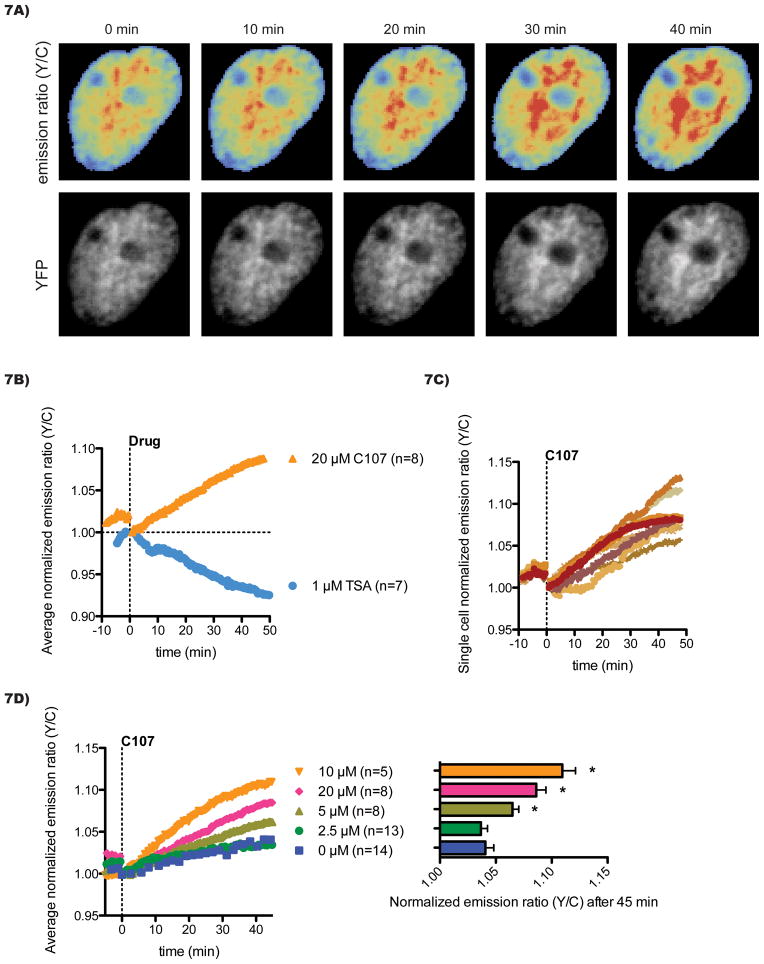
Compound C107 was devoid of interference in the emission wavelengths recorded for Histac (Figure 6), enabling us to examine its ability to influence the Histac FRET signal in Cos7 cells. C107 reproducibly increased the Histac emission ratio of yellow over cyan (Figure 7A), comparable in magnitude but opposite in direction to the change in emission ratio induced by the HDAC inhibitor TSA (Figure 7B). Interestingly, the extent of the increase in emission ratio, around 10% after 50 min, was similar to that induced by the genetic knockdown of p300/CBP (Figure 2). The C107 impact on emission ratio began within 5 min of the exposure of cells to the compound and persisted for at least 50 min. Across a population of cells, some variability in the degree of emission ratio increase was observed with C107 treatment (Figure 7C), but all cells experienced at least a 5% increase. We also examined the dose dependency of C107 on Histac FRET. There was a dose-dependent increase in the effect of C107 on Histac, with an intermediate effect seen at 5 μM and a maximal effect achieved at 10–20 μM (Figure 7D), in the same range as the effect on dynamic histone acetylation described above (Figure 5).
Figure 6.
C107 lacks the fluorescence seen with C646. Untransfected Cos7 cells were imaged using the same protocol as a typical FRET experiment and treated with 40 μM C107 (circles) or C646 (triangles) at time zero. The signal intensity for the FRET channel (CFP excitation and YFP emission) is shown over time for a representative cell.
Figure 7.
Pharmacologic inhibition of p300/CBP induces a FRET increase. A) Cos7 cells were transfected with the Histac FRET reporter and imaged after 24 h. A representative nucleus treated with 20 μM C107 is shown. The emission ratio (Y/C) was calculated for each pixel and pseudocolored according to a “rainbow” colormap, with lower values at the blue end of the spectrum and higher values in red. Corresponding images of the total reporter levels (regardless of FRET), captured by direct stimulation of YFP, are shown in grey scale. B) The emission ratios for each cell imaged were normalized to the time at which drug was added and then averaged across a population of cells undergoing the same treatment. The time course for treatment with 20 μM C107 (orange triangles) is shown in comparison with 1 μM TSA (blue circles). C) Single cells were treated with 20 μM C107. D) Cells were treated with different doses of C107 with final DMSO concentrations held constant. The time course data are shown on the left with the averages and standard errors of responses after 45 min of treatment shown on the right. Statistical significance (p < 0.05) compared to control was calculated with a T-test and is indicated with an asterisk (*).
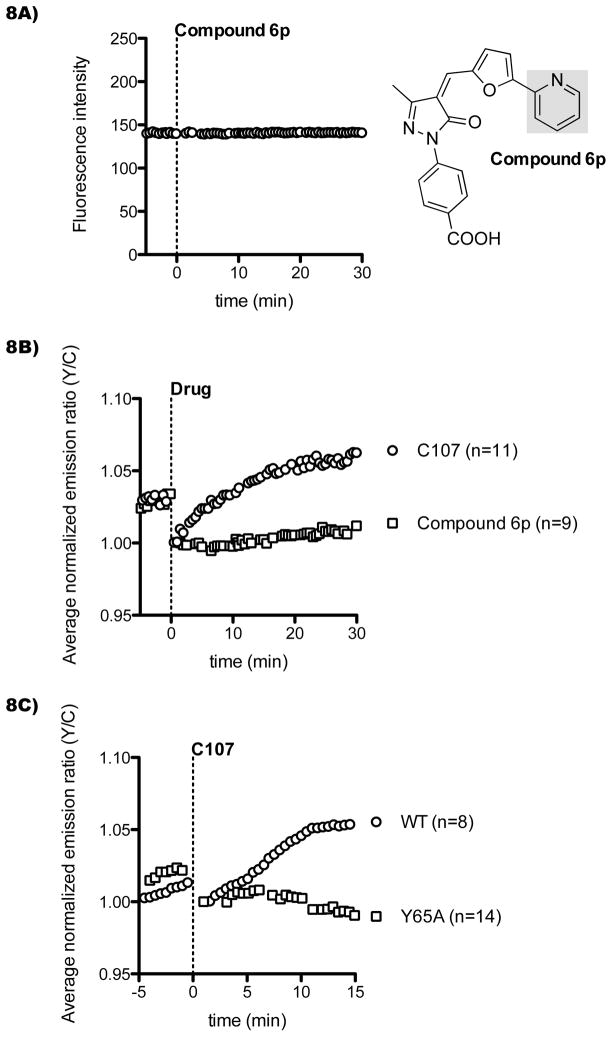
To verify that the effect on FRET was due to compound activity against p300/CBP and not an off-target effect, we tested a structural analog of C646, compound 6p, that was previously shown to be inactive against p300/CBP[8] and is not fluorescent (Figure 8A). The emission ratio of Histac did not change upon treatment with this control compound as compared with C107 treatment conducted in parallel (Figure 8B). To ensure that the effect was related to the expected conformational change of a Histac reporter, we tested the effect of the Histac point mutation (Y65A) in which a tyrosine residue in the bromodomain, which is implicated in acetyl-lysine binding, is lost. It has been shown previously that this Y65A Histac is insensitive to TSA treatment.[11] Here we show that Y65A Histac is also unresponsive to C107 (Figure 8C), consistent with C107 inducing its effect through blockade of reporter acetylation.
Figure 8.
Inactive compound and mutant reporter lack FRET response. A) Compound 6p, a structural analog of C646 that does not block p300 in vitro,[4] was analyzed for intrinsic fluorescence in untransfected cells under the same conditions as C646 and C107 in Figure 6. B) Cos7 cells were transfected with the Histac reporter and treated with 20 μM C107 or control compound 6p. C) Cos7 cells were transfected with either WT Histac or a Histac bearing a desensitizing point mutation in the bromodomain (Y65A). After 24 h, cells were imaged and treated with 40 μM C107.
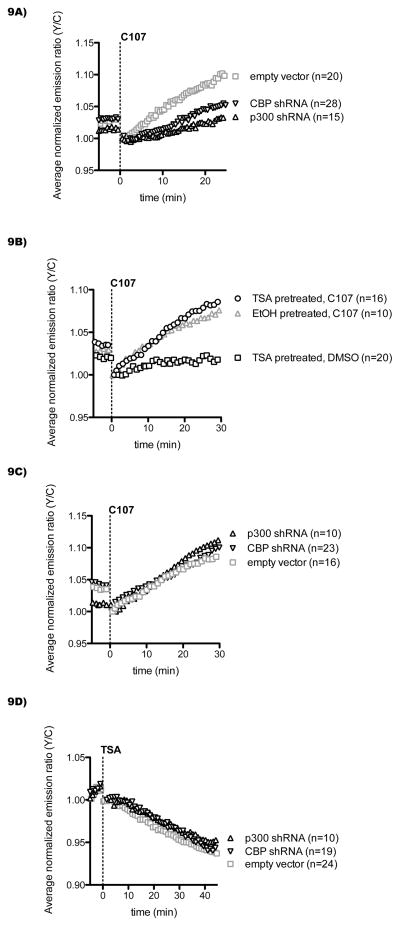
We further investigated the role of p300/CBP in mediating the impact of C107 on Histac by testing these reagents in the Cos7 cells in which p300 or CBP had been stably knocked down by shRNA. These experiments revealed a reduced effect of C107 on Histac FRET in p300 and CBP knockdown Cos7 cells relative to control cells (Figure 9A). These results are consistent with the proposition that C107 is targeting p300/CBP because reduction in the levels of p300/CBP activity could lead to a reduced response to the p300/CBP HAT inhibitor as judged by reporter acetylation.
Figure 9.
p300/CBP knockdown desensitizes cells to C107, and TSA pretreatment sensitizes cells to C107. A) Cos7 cells stably expressing p300/CBP shRNA or empty vector control (as described in Figure 2) were transfected with Histac, followed by imaging and treatment with 20 μM C107 at time zero (p < 0.05 after 25 min for p300 shRNA and CBP shRNA versus empty vector). B) Wild-type Cos7 cells transfected with Histac were pretreated with 1 μM TSA or ethanol control for 1 h, followed by imaging and treatment with 20 μM C107 or DMSO control at time zero, with TSA or ethanol remaining throughout (p < 0.05 after 30 min for C107 treatment of TSA pretreated versus EtOH pretreated). C) Cos7 cells stably expressing p300/CBP shRNA or empty vector control, transfected with Histac, were pretreated with 1 μM TSA for 1 h, followed by imaging and treatment with 20 μM C107 at time zero. D) Cos7 cells stably expressing p300/CBP shRNA or empty vector control were transfected with Histac, followed by imaging and treatment with 1 μM TSA at time zero.
We also explored whether TSA treatment of cells could alter C107 effects on the Histac FRET signal. Interestingly, there was a small, but statistically significant enhancement of C107 response when cells were pre-treated with TSA (Figure 9B). Moreover, when the same compound treatments were carried out in the p300 and CBP knockdown Cos7 cells, we observed that the Histac FRET response induced by C107 after TSA pretreatment was now similar to that of control Cos7 cells (Figure 9C). Unlike C107, TSA treatment induced a comparable FRET decrease regardless of whether p300/CBP were knocked down (Figure 9D). These data suggest that pre-acetylation of the reporter by TSA and/or the enhanced autoacetylation of p300/CBP and/or the acetylation of other proteins can enhance the C107 influence on the Histac reporter under defined circumstances.
Conclusion
Through the combination of genetics and pharmacology, we validate the use of the live cell imaging fusion protein Histac as a reporter for p300 and CBP histone acetyltransferase activities. Although it is possible that the effect is mediated by a third entity, the rapid response to p300/CBP inhibition suggests that Histac is a direct substrate of p300/CBP. These studies suggest that histone H4 K5 and/or K8 acetylation are mediated in significant measure by p300 and/or CBP HAT activities in these cells and under certain conditions, although the contribution of other HATs cannot be ruled out. It is possible that our assay is biased towards newly deposited histone H4, due to the fact that our reporter is transiently transfected and assayed within 24 hours of expression, and therefore, it remains unknown whether p300/CBP act on the H4 of older nucleosomes. Because the reporter is incorporated into chromatin, its histone H4 likely functions as a similar substrate for HATs as the native H4, although it should be noted that the readout is based on H4 that has been tagged at both termini. This tagging is likely disruptive to H4 function, as evidenced by a loss in cell viability upon prolonged expression of the reporter.[11] Nevertheless, the overall readout reflects both HAT and HDAC activities in these cells.
These studies also reveal that the furan ring of C646 can be replaced by a phenyl ring with only a modest loss in in vitro p300 HAT potency, no obvious decrease in cellular potency, and a loss of fluorescence that makes this compound suitable for cell-based assays with a fluorescence readout, including dyes and fluorescent protein-based markers. It is also potentially noteworthy that p300 HAT and p300 BHC histone acetyltransferase activities and sensitivities to C646 and C107 compounds are somewhat different. This finding suggests that the p300 bromodomain and C/H3 domain may serve to regulate the enzymatic activity of p300/CBP, although further work will be needed to assess the relevance of this finding to cellular actions.
The use of a live cell reporter for p300/CBP enzymatic activities opens up a variety of potential applications. Our methods could be adapted for the high-throughput screening for HAT inhibitors using automated multiwell imaging or flow cytometry. In addition to drug screening as pursued here, one could investigate particular cell stimuli (for example, stress, hormones, or growth factors) that might lead to global p300/CBP enzymatic activation with increased spatiotemporal resolution as compared to past studies. In this regard, it was interesting that HDAC inhibition seemed to result in enhanced C107 sensitivity. One possible explanation for this is that HDAC inhibitors can facilitate the autoacetylation of the regulatory loop of p300/CBP, which can stimulate its HAT activity.[16] However, given that a multitude of other known substrates of p300/CBP exists, and that the acetylation of many protein lysines increases in response to TSA, alternative mechanisms for TSA effects on C107 sensitivities can be imagined.
Another potential application of this reporter would be to investigate HAT activity and inhibition in cell type cocultures, organotypic cultures, or even animal tissues. Finally, it might also be feasible in a future study to link Histac to specific transcription factors so that gene-specific reporters for p300/CBP are formed. Such reporters, when used in conjunction with established transcriptional reporters, could allow for a live cell dissection of the role of histone modification in regulating gene expression.
Experimental Section
Plasmids
The vector pcDNA3.1+ containing the reporter gene Histac was reported previously[11] and encodes Venus (a yellow fluorescent protein) fused to the double bromodomains of BrdT, followed by a flexible linker and histone H4 fused to eCFP (a cyan fluorescent protein), all driven by the CMV promoter. The Y65A mutant was created using a QuickChange site-directed mutagenesis strategy. Knockdown constructs from the RNAi Consortium (TRC) Collection II were obtained from the Johns Hopkins University High Throughput Biology Center as pLKO.1 vectors containing short hairpin (shRNA) sequences driven by the U6 promoter along with a puromycin resistance gene.
Cell culture and knockdown
Cos7 cells were maintained in Dulbecco’s modified Eagle’s medium (DMEM) supplemented with 10% fetal bovine serum (FBS), 1 unit/ml penicillin, and 1 mg/ml streptomycin at 37°C with 5% CO2. HEK (human embryonic kidney) 293T cells were maintained in DMEM supplemented with 10% FBS at 37°C with 5% CO2. Lentiviral production was carried out according to the RNAi Consortium (TRC) protocol (last updated 8/09/10), which consisted of the transient transfection of the packing plasmid, envelope plasmid, and pLKO.1 plasmid with Lipofectamine 2000 (Invitrogen). The viral supernatants were produced in DMEM supplemented with 30% FBS at intervals within 15–63 hours after transfection. 16 μg/ml polybrene was used to facilitate the infection of Cos7 cells and selection in 5 μg/ml puromycin was carried out for 2 wk, beginning 24 h after infection. C3H 10T1/2 mouse fibroblasts were maintained in DMEM supplemented with 10% fetal calf serum (FCS) at 37°C with 5% CO2.
Protein sample preparation, gel electrophoresis, and western blotting
Subconfluent Cos7 cultures were harvested and total cell lysates were prepared in SDS sample buffer. p300 and CBP transfer was carried out at 40 mA for 15 h at 4°C in 25 mM Tris pH 8.3, 192 mM glycine, 4% methanol, and 0.1% SDS, whereas actin transfer was conducted using an iBlot apparatus (Invitrogen). Mouse anti-p300 (1:1,000) was obtained from Millipore (clone RW128, catalog #05-257), rabbit anti-CBP was obtained from Santa Cruz Biotechnology (clone A-22, catalog #sc-369), mouse anti-actin (1:5,000) was obtained from Sigma (clone AC-15, catalog #1978), horseradish peroxidase-linked sheep anti-mouse (1:5,000) was obtained from GE Healthcare (NA931), and horseradish peroxidase-linked donkey anti-rabbit (1:5,000) was obtained from GE Healthcare (NA934). These blots were imaged using a Kodak Image Station 4000R PRO with Carestream Molecular Imaging software version 5.0.7.24. Confluent C3H 10T1/2 cultures were quiesced in DMEM with 0.5% FCS for 18–20 h, followed by treatment with trichostatin A (TSA, 33 nM; Sigma), C646 (25 μM), and/or C107 (5, 10, or 25 μM). Histones were isolated from cells by acid extraction, separated by Acid-Urea polyacrylamide gel electrophoresis and analyzed by western blotting as described previously.[17] Rabbit anti-H3K4me3 (1:5,000) and rabbit anti-K3K9ac (1:10,000) were generated in-house.[18]
RNA sample preparation, reverse transcriptase cDNA synthesis, and quantitative real-time PCR
Subconfluent Cos7 cultures were harvested, counted, and lysed using QIAshredder (Qiagen), and RNA was isolated using RNeasy spin columns (Qiagen) according to the manufacturer’s instructions. The RNA was analyzed for absorbance at 260 and 280 nm, reverse transcriptase PCR was carried out using SuperScript II First-Strand Synthesis System (Invitrogen) with oligo(dT), and cDNA samples were treated with RNase H according to the manufacturer’s instructions. Primers were synthesized by Integrated DNA Technologies (IDT) with the following 5′-3′ sequences: AGG CAT GGG AAG TGC TGG CAA C (p300 forward), GCT GTT GAC CCA TGT TGG GCA TTC (p300 reverse), TCG GCG AAT GAC AGC ACA GAT TTT G (CBP forward), GGG CTG CTG GCG CTC ACA TT (CBP reverse), CAT GAG AAG TAT GAC AAC AGC CT (GAPDH forward), and AGT CCT TCC ACG ATA CCA AAG T (GAPDH reverse). Quantitative real-time PCR reactions were prepared using SYBR Green (Invitrogen) according to the manufacturer’s instructions and run on a StepOnePlus (Life Technologies) thermocycler, with the threshold cycle (CT) calculated by its StepOne software v2.2.
Microscopy
Cos7 cells were seeded in glass-bottom dishes (MatTek Corporation), allowed to adhere overnight, and transfected with Histac using Lipofectamine 2000 (Invitrogen). 24 h after transfection, cells were rinsed, supplied with Hanks balanced salt solution (HBSS), and loaded onto a Zeiss Axiovert 200M microscope equipped with a heated stage. A lambda 10-2 wavelength selector (Sutter Instrument Company), Micro MAX BFT512 cooled charge-coupled device camera (Roper Scientific), and MetaFluor 6.2 software were used to capture images in three channels every 30 s. The excitation filter, dichroic mirror, emission filter, and exposure times for each channel are as follows: 420DF20, 450DRLP, 535DF25, 500 ms (channel 1, FRET acceptor); 420DF20, 450DRLP, 475DF40, 500 ms (channel 2, FRET donor); 495/10, 515, 535DF25, 50 ms (channel 3, total reporter). Average pixel intensities were calculated for each nucleus at each time point for each channel. The background was subtracted from each channel, and the emission ratio (Y/C) was calculated by channel 1 divided by channel 2.
p300 purification
Semisynthetic p300 HAT domain was prepared as reported previously using expressed protein ligation.[19] A construct containing the bromodomain, HAT domain, and C/H3 domain (p300 BHC, residues 1036–1822) was amplified by PCR using primers with the following 5′-3′ sequences: ATG CAT GAA TTC ATG GAT TAC AAG GAT GAC GAT GAC AAG CAG TCA TCT CCG GCT CCA GGA (forward, includes a FLAG tag) and ATG CAT GCG GCC GCT CAT AGT CGG TGC TGC AGC TGT TGC (reverse). The PCR products were ligated into the pFASTbac vector (Invitrogen) for baculovirus expression, and the sequences were confirmed. Bacmids were then prepared from DH10Bac competent cells using Large Construct kit (Qiagen) according to the manufacturer’s instructions. The p300 insert was confirmed using PCR. Bacmids were transfected into SF9 insect cells with Cellfection II (Invitrogen) and grown in SF900III SFM medium with successive collections of the P1, P2, and P3 baculovirus at 72 h intervals. Following expression, cells were harvested and lysed in a dounce homogenizer with 20 mM HEPES, pH 7.9, 150 mM NaCl, 0.1% Triton X-100, 1 mM PMSF, and EDTA-free COMPLETE protease inhibitors (Roche). The lysate was clarified by centrifugation and applied to anti-FLAG M2 affinity beads (Sigma) that had been washed. After binding for 3 h at 4°C, the beads were washed with 20 mM HEPES, pH 7.9, 150 mM NaCl, and 0.1% Triton X-100. p300 BHC was eluted by a 2-h incubation at 4°C with 150 ng/μl triple-FLAG peptide, concentrated, and passed through a NAP-10 gel filtration column (GE Healthcare) with 20 mM HEPES, pH 7.9 and 150 mM NaCl. 10% glycerol and 1 mM DTT were then added, giving a final concentration of 0.8 mg/ml protein, with a yield of 0.25 mg from 1L culture.
HAT assays
Radioactive assays of acetylation were conducted as described previously.[19] Assays with p300 HAT were conducted in a 30 μl reaction volume in 50 mM HEPES, pH 7.9, 5 mM DTT, 50 μg/ml BSA, 10 nM enzyme, 100 μM synthetic histone H4 15-mer N-terminal peptide, 10 μM acetyl-CoA (of which 50% was labeled with 14C), and 2.5% DMSO. Assays with p300 BHC were conducted in the same manner except in a 40 μl reaction volume with 0.05 nM enzyme and 0.1 μM acetyl-CoA (of which 100% was labeled with 14C). Reactions were prepared with all reagents except acetyl-CoA, pre-equilibrated at 30°C for 10 min, initiated with the addition of acetyl-CoA, and allowed to react at 30°C (for 10 min with p300 HAT or 5 min with p300 BHC) before quenching by the addition of loading dye containing 14% SDS. Aliquots of each reaction were analyzed for total radioactivity alongside a 14C-BSA standard using a scintillation counter. Aliquots of each reaction were analyzed for acetylation activity by separating with gel electrophoresis on a 16% Tris-Tricine gel alongside a 14C-BSA standard at 140V for 90 min. The gels were washed, dried, and exposed in a phosphorimager cassette for ~2 d. Bands corresponding to Ac-H4 peptide were quantified using ImageQuant (GE Healthcare) and background subtracted. The rate of acetylation was calculated for each reaction and normalized to the DMSO control for each compound concentration. For p300 HAT domain, the experiment was repeated exactly for a total of four replicates run on four separate gels, and the replicates were averaged and standard errors calculated.
Synthetic chemistry
C646 and 6p were synthesized as reported previously.[8] See the Supporting Information for spectra and complete methods of C107 synthesis.
Supplementary Material
Acknowledgments
We thank the Johns Hopkins University High Throughput Biology Center for the RNAi Consortium knockdown clones, K. A. O’Donnell for knockdown protocols, W. Warren and K. Dewar for Cos7 genome sequence information, V. Sample and C. Depry for microscopy assistance, G. Yan for assistance with qRT-PCR, and M. Pacella for assistance with PyMol. National Institutes of Health, grants U54-RR020839 and GM62437 provided funding.
References
- 1.Marks PA, Breslow R. Nat Biotechnol. 2007;25(1):84–90. doi: 10.1038/nbt1272. [DOI] [PubMed] [Google Scholar]
- 2.Dekker FJ, Haisma HJ. Drug Discov Today. 2009;14(19–20):942–8. doi: 10.1016/j.drudis.2009.06.008. [DOI] [PubMed] [Google Scholar]; Iyer NG, Ozdag H, Caldas C. Oncogene. 2004;23(24):4225–31. doi: 10.1038/sj.onc.1207118. [DOI] [PubMed] [Google Scholar]
- 3.Chan HM, Thangue NB. J Cell Sci. 2001;114(3):2363–73. doi: 10.1242/jcs.114.13.2363. [DOI] [PubMed] [Google Scholar]; Shiama N. Trends Cell Biol. 1997;7(6):230–6. doi: 10.1016/S0962-8924(97)01048-9. [DOI] [PubMed] [Google Scholar]
- 4.Kasper LH, Fukuyama T, Biesen MA, Boussouar F, Tong C, de Pauw A, Murray PJ, van Deursen JM, Brindle PK. Mol Cell Biol. 2006;26(3):789–809. doi: 10.1128/MCB.26.3.789-809.2006. [DOI] [PMC free article] [PubMed] [Google Scholar]; Kasper LH, Lerach S, Wang J, Wu S, Jeevan T, Brindle PK. EMBO J. 2010;29(21):3660–72. doi: 10.1038/emboj.2010.235. [DOI] [PMC free article] [PubMed] [Google Scholar]; Yao TP, Oh SP, Fuchs M, Zhou ND, Ch’ng LE, Newsome D, Bronson RT, Li E, Livingston DM, Eckner R. Cell. 1998;93(3):361–72. doi: 10.1016/s0092-8674(00)81165-4. [DOI] [PubMed] [Google Scholar]
- 5.Li M, Luo RZ, Chen JW, Cao Y, Lu JB, He JH, Wu QL, Cai MY. J Transl Med. 2011;9:5. doi: 10.1186/1479-5876-9-5. [DOI] [PMC free article] [PubMed] [Google Scholar]; Reynoird N, Schwartz BE, Delvecchio M, Sadoul K, Meyers D, Mukherjee C, Caron C, Kimura H, Rousseaux S, Cole PA, Panne D, French CA, Khochbin S. EMBO J. 2010;29(17):2943–52. doi: 10.1038/emboj.2010.176. [DOI] [PMC free article] [PubMed] [Google Scholar]; Vleugel MM, Shvarts D, van der Wall E, van Diest PJ. Hum Pathol. 2006;37(8):1085–92. doi: 10.1016/j.humpath.2006.03.015. [DOI] [PubMed] [Google Scholar]
- 6.Hottiger MO, Nabel GJ. Trends Microbiol. 2000;8(12):560–5. doi: 10.1016/s0966-842x(00)01874-6. [DOI] [PubMed] [Google Scholar]; Mujtaba S, Zhou MM. Methods. 2011;53(1):97–101. doi: 10.1016/j.ymeth.2010.09.001. [DOI] [PMC free article] [PubMed] [Google Scholar]
- 7.Balasubramanyam K, Altaf M, Varier RA, Swaminathan V, Ravindran A, Sadhale PP, Kundu TK. J Biol Chem. 2004;279:33716–26. doi: 10.1074/jbc.M402839200. [DOI] [PubMed] [Google Scholar]; Balasubramanyam K, Swaminathan V, Ranganathan A, Kundu TK. J Biol Chem. 2003;278:19134–40. doi: 10.1074/jbc.M301580200. [DOI] [PubMed] [Google Scholar]; Balasubramanyam K, Varier RA, Altaf M, Swaminathan V, Siddappa NB, Ranga U, Kundu TK. J Biol Chem. 2004;279:51163–71. doi: 10.1074/jbc.M409024200. [DOI] [PubMed] [Google Scholar]; Lau OD, Kundu TK, Soccio RE, Ait-Si-Ali S, Khalil EM, Vassilev A, Wolffe AP, Nakatani Y, Roeder RG, Cole PA. Mol Cell. 2000;5:589–95. doi: 10.1016/s1097-2765(00)80452-9. [DOI] [PubMed] [Google Scholar]; Mai A, Rotili D, Tarantino D, Nebbioso A, Castellano S, Sbardella G, Tini M, Altucci L. Bioorg Med Chem Lett. 2009;19:1132–5. doi: 10.1016/j.bmcl.2008.12.097. [DOI] [PubMed] [Google Scholar]; Mantelingu K, Reddy BA, Swaminathan V, Kishore AH, Siddappa NB, Kumar GV, Nagashankar G, Natesh N, Roy S, Sadhale PP, Ranga U, Narayana C, Kundu TK. Chem Biol. 2007;14:645–57. doi: 10.1016/j.chembiol.2007.04.011. [DOI] [PubMed] [Google Scholar]; Ravindra KC, Narayan V, Lushington GH, Peterson BR, Prabhu KS. Chem Res Toxicol. 2012;25:337–47. doi: 10.1021/tx200383c. [DOI] [PMC free article] [PubMed] [Google Scholar]; Ravindra KC, Selvi BR, Arif M, Reddy BA, Thanuja GR, Agrawal S, Pradhan SK, Nagashayana N, Dasgupta D, Kundu TK. J Biol Chem. 2009;284:24453–64. doi: 10.1074/jbc.M109.023861. [DOI] [PMC free article] [PubMed] [Google Scholar]; Stimson L, Rowlands MG, Newbatt YM, Smith NF, Raynaud FI, Rogers P, Bavetsias V, Gorsuch S, Jarman M, Bannister A, Kouzarides T, McDonald E, Workman P, Aherne GW. Mol Cancer Ther. 2005;4:1521–32. doi: 10.1158/1535-7163.MCT-05-0135. [DOI] [PubMed] [Google Scholar]; Xiao X, Shi D, Liu L, Wang J, Xie X, Kang T, Deng W. PLoS One. 2011;6:22934. doi: 10.1371/journal.pone.0022934. [DOI] [PMC free article] [PubMed] [Google Scholar]; Zheng Y, Balasubramanyam K, Cebrat M, Buck D, Guidez F, Zelent A, Alani RM, Cole PA. J Am Chem Soc. 2005;127:17182–3. doi: 10.1021/ja0558544. [DOI] [PubMed] [Google Scholar]
- 8.Bowers EM, Yan G, Mukherjee C, Orry A, Wang L, Holbert MA, Crump NT, Hazzalin CA, Liszczak G, Yuan H, Larocca C, Saldanha SA, Abagyan R, Sun Y, Meyers DJ, Marmorstein R, Mahadevan LC, Alani RM, Cole PA. Chem Biol. 2010;17:471–82. doi: 10.1016/j.chembiol.2010.03.006. [DOI] [PMC free article] [PubMed] [Google Scholar]
- 9.Crump NT, Hazzalin CA, Bowers EM, Alani RM, Cole PA, Mahadevan LC. Proc Natl Acad Sci. 2011;108:7814–9. doi: 10.1073/pnas.1100099108. [DOI] [PMC free article] [PubMed] [Google Scholar]; Mali P, Chou BK, Yen J, Ye Z, Zou J, Dowey S, Brodsky RA, Ohm JE, Yu W, Baylin SB, Yusa K, Bradley A, Meyers DJ, Mukherjee C, Cole PA, Cheng L. Stem Cells. 2010;28:713–20. doi: 10.1002/stem.402. [DOI] [PMC free article] [PubMed] [Google Scholar]; Marek R, Coelho CM, Sullivan RK, Baker-Andresen D, Li X, Ratnu V, Dudley KJ, Meyers D, Mukherjee C, Cole PA, Sah P, Bredy TW. J Neurosci. 2011;31:7486–91. doi: 10.1523/JNEUROSCI.0133-11.2011. [DOI] [PMC free article] [PubMed] [Google Scholar]; Min SW, Cho SH, Zhou Y, Schroeder S, Haroutunian V, Seeley WW, Huang EJ, Shen Y, Masliah E, Mukherjee C, Meyers D, Cole PA, Ott M, Gan L. Neuron. 2010;67:953–66. doi: 10.1016/j.neuron.2010.08.044. (Erratum in: Neuron, 2010, 68, 801) [DOI] [PMC free article] [PubMed] [Google Scholar]; Reynoird N, Schwartz BE, Delvecchio M, Sadoul K, Meyers D, Mukherjee C, Caron C, Kimura H, Rousseaux S, Cole PA, Panne D, French CA, Khochbin S. EMBO J. 2010;29:2943–52. doi: 10.1038/emboj.2010.176. [DOI] [PMC free article] [PubMed] [Google Scholar]; Santer FR, Höschele PP, Oh SJ, Erb HH, Bouchal J, Cavarretta IT, Parson W, Meyers DJ, Cole PA, Culig Z. Mol Cancer Ther. 2011;10:1644–55. doi: 10.1158/1535-7163.MCT-11-0182. [DOI] [PubMed] [Google Scholar]; Wang L, Gural A, Sun XJ, Zhao X, Perna F, Huang G, Hatlen MA, Vu L, Liu F, Xu H, Asai T, Xu H, Deblasio T, Menendez S, Voza F, Jiang Y, Cole PA, Zhang J, Melnick A, Roeder RG, Nimer SD. Science. 2011;333:765–9. doi: 10.1126/science.1201662. [DOI] [PMC free article] [PubMed] [Google Scholar]; Wang Y, Toh HC, Chow P, Chung AY, Meyers DJ, Cole PA, Ooi LL, Lee CG. FASEB J. 2012 doi: 10.1096/fj.11-201855. [DOI] [PMC free article] [PubMed] [Google Scholar]; Xu CR, Cole PA, Meyers DJ, Kormish J, Dent S, Zaret KS. Science. 2011;332:963–6. doi: 10.1126/science.1202845. [DOI] [PMC free article] [PubMed] [Google Scholar]
- 10.Zhang J, Allen MD. Mol Biosyst. 2007;3(11):759–65. doi: 10.1039/b706628g. [DOI] [PubMed] [Google Scholar]
- 11.Sasaki K, Ito T, Nishino N, Khochbin S, Yoshida M. Proc Natl Acad Sci. 2009;106:16257–62. doi: 10.1073/pnas.0902150106. [DOI] [PMC free article] [PubMed] [Google Scholar]
- 12.Sasaki K, Ito A, Yoshida M. Bioorg Med Chem. 2012;20:1887–92. doi: 10.1016/j.bmc.2012.01.018. [DOI] [PubMed] [Google Scholar]
- 13.Schiltz RL, Mizzen CA, Vassilev A, Cook RG, Allis CD, Nakatani Y. J Biol Chem. 1999;274(3):1189–92. doi: 10.1074/jbc.274.3.1189. [DOI] [PubMed] [Google Scholar]; Wittschieben BO, Fellows J, Du W, Stillman DJ, Svejstrup JQ. EMBO J. 2000;19(12):3060–8. doi: 10.1093/emboj/19.12.3060. [DOI] [PMC free article] [PubMed] [Google Scholar]
- 14.Moro S, Chipman JK, Antczak P, Turan N, Dekant W, Falciani F, Mally A. Toxicol Sci. 2012;126:336–52. doi: 10.1093/toxsci/kfs005. [DOI] [PubMed] [Google Scholar]
- 15.Crump NT, Hazzalin CA, Bowers EM, Alani RM, Cole PA, Mahadevan LC. Proc Natl Acad Sci. 2011;108:7814–9. doi: 10.1073/pnas.1100099108. [DOI] [PMC free article] [PubMed] [Google Scholar]
- 16.Thompson PR, Wang D, Wang L, Fulco M, Pediconi N, Zhang D, An W, Ge Q, Roeder RG, Wong J, Levrero M, Sartorelli V, Cotter RJ, Cole PA. Nat Struct Mol Biol. 2004;11:308–15. doi: 10.1038/nsmb740. [DOI] [PubMed] [Google Scholar]
- 17.Clayton AL, Rose S, Barratt MJ, Mahadevan LC. EMBO J. 2000;19:3714–3726. doi: 10.1093/emboj/19.14.3714. [DOI] [PMC free article] [PubMed] [Google Scholar]; Thomson S, Mahadevan LC, Clayton AL. Semin Cell Dev Biol. 1999;10:205–214. doi: 10.1006/scdb.1999.0302. [DOI] [PubMed] [Google Scholar]
- 18.Edmunds JW, Mahadevan LC, Clayton AL. EMBO J. 2008;27:406–420. doi: 10.1038/sj.emboj.7601967. [DOI] [PMC free article] [PubMed] [Google Scholar]
- 19.Thompson PR, Wang D, Wang L, Fulco M, Pediconi N, Zhang D, An W, Ge Q, Roeder RG, Wong J, Levrero M, Sartorelli V, Cotter RJ, Cole PA. Nat Struct Mol Biol. 2004;11:308–15. doi: 10.1038/nsmb740. [DOI] [PubMed] [Google Scholar]; Muir TW, Sondhi D, Cole PA. Proc Natl Acad Sci. 1998;9:6705–10. doi: 10.1073/pnas.95.12.6705. [DOI] [PMC free article] [PubMed] [Google Scholar]
Associated Data
This section collects any data citations, data availability statements, or supplementary materials included in this article.


