

Summary
Treatment with anti-CD3 mAbs modulates immune responses that cause Type 1 diabetes and other diseases. CD8+ Tregs can be induced in vitro and in vivo by the mAb. However, 1/3 of patients do not respond to drug therapy and in an equal proportion, anti-CD3 mAb does not induce Tregs in vitro. The acquisition of CD8+ Treg activity is a function of the CD8+ cells and not the targets in the assay. To identify markers to differentiate responses of CD8+ Tregs, we analyzed genes differentially expressed in CD8+ T cells of non-responders compared to responders, and found that an inhibitory receptor NKG2A (CD159a) was highly expressed in cells from all non-responders tested. An agonistic mAb to NKG2a during in vitro CD8+ Treg induction by anti-CD3 prevented induction of CD8+ Tregs. CD8+ T cells that are TNFR2+ but NKG2A− are the most potent induced Tregs. The level of NKG2A expression on resting CD8+ T cells inversely correlated with acquisition of regulatory function when activated. We suggest that induction of human CD8+ Tregs by anti-CD3 mAb is controlled by a negative signaling through NKG2A, and that NKG2A may serve as a negative marker of human CD8+ Tregs.
Keywords: anti-CD3 mAb, immune therapy, CD8, Treg
Introduction
We previously reported that, in patients with recent-onset Type 1 diabetes mellitus (T1DM), treated with Teplizumab, a humanized FcR-non-binding anti-CD3 mAb, clinical responders to drug treatment (designated because of preservation of C-peptide responses to a mixed meal) could be distinguished from non-responders by an increase in the ratio of CD8/CD4 T cells in the peripheral blood [1, 2]. We were unable to distinguish immunologic and metabolic responders on the basis of conventional markers such as autoantibody titers, HLA-genotype, or age. Even baseline C-peptide responses, which had been shown to predict responses in other immune therapy studies, were not significantly different between individuals who did and did not have retention of C-peptide in response to Teplizumab treatment. Predictors of this clinical response would be of value since drug administration and potential adverse events could be avoided in individuals who are not likely to benefit from drug treatment.
We have found that Teplizumab induces a subpopulation of CD8+ T cells with regulatory function (iCD8 Tregs) in vivo and in vitro. These cells inhibit CD4+ proliferative responses to antigen and to superantigens such as staphylococcal enterotoxin B (SEB)[3, 4]. They express CD25 and TNFR2, and they require TNF for development. We postulated that the induction of these cells in vivo was related to clinical responses since we showed that drug treatment induced Foxp3 on the CD8+ cells in vivo and CD8+ cells freshly isolated from drug treated patients were able to inhibit proliferative responses of allogeneic cells to SEB ex vivo[4, 5].
Consistent with our findings of clinical responses in drug treated patients, we were able to induce iCD8+ Tregs in vitro by culturing PBMC with Teplizumab in about 2/3 of all subjects, but not in all. The cellular or molecular basis for these individual differences were not clear, and therefore, we sought to identify them in order to understand the mechanism of the Treg induction by anti-CD3 mAb and to develop a means whereby individuals who are likely (or unlikely) to respond to drug treatment could be identified. Herein we report that the expression of NKG2A is a marker of non-responsiveness to anti-CD3 mAb. Ligation of NKG2A modifies the induction of regulatory CD8+ T cells by Teplizumab. CD8+ and CD8+CD25+ T cells from individuals with higher levels of expression of NKG2A fail to acquire regulatory function whereas these cells from individuals with low levels of NKG2A expression reliably become Tregs. We also show that TNFR2+NKG2a− CD8+ cells are superior in inhibition of proliferation compared to other subsets.
Results
Individual differences in the induction of CD8+ Tregs with anti-CD3 mAb
We had previously found that the regulatory activity within CD8+ T cells taken from 5 day cultures with Teplizumab primarily resided within the CD25+ subset [3, 4]. However, the anti-CD3 mAb did not induce CD8+ Tregs in all individuals in vivo or in vitro. We therefore analyzed the range of inhibitory function of CD8+CD25+, or CD8+ T cells from 40 and 38 individuals, respectively, using proliferation of CD8-depleted target cell to SEB (Figure 1A). The mean (±SEM) percent inhibition when CD8+CD25+ T cells were added was 42±4.0%, and when CD8+ cells were added was 28±3.4% consistent with our previous observations that CD25 identifies a group of more potent regulatory cells[3]. Based on our previous studies in patients, we considered individuals in the lower 33% of the distribution as non-responders which established the designation of a “responder” for CD8+CD25+ cells as > 28% inhibition (n=40) and > 17% inhibition (n=38) for total CD8+ cells [1, 2]. In each subsequent experiment, the inhibition of target cells with anti-CD3 mAb cultured CD8+ or CD8+CD25+ cells was compared to inhibition with CD8+ cells that had been cultured with control Ig. None of the cultures with control CD8+ cells showed inhibition above the 33rd percentile for anti-CD3 mAb treated cells. Figure 1B shows examples of suppression CD8+CD25+ T cells from a responder (top panel) or non-responder (bottom panel).
Figure 1. Inhibition of PBMC by CD8+ and CD8+CD25+ T cells from responders and non-responders to Teplizumab.

(A): CD8+CD25+ (, n=40) or total CD8+ (, n=38) T cells were sorted after culture with Teplizumab for 5 days and equal numbers of cells were added to cultures of autologous CD8-depleted PBMC that were activated with SEB. The percent inhibition of proliferation was calculated as described in Materials and Methods. Individuals whose cells were in the lowest 1/3 of inhibition (open symbols) were considered non-responders (<28 and <17% for CD8+CD25+ and total CD8+ cells, respectively (*P<0.001 by one way ANOVA with Bonferroni’s post-test). (B): Representative suppression assays with autologous CD8+CD25+ T cells from cultures with Teplizumab from a “responder” (top panels) and a “non-responder” (lower panels). Proliferation of CFSE labeled CD8-depleted PBMC are shown after 3 days in culture with SEB alone (L column), with SEB+Teplizumab activated CD8’s (middle column), or SEB+CD8’s cultured with control IgG (R column). Equal numbers of CD8+ cells from cultures with control Ig and Teplizumab were added to the responder cells (each 105). The numbers in the panels indicate the percent inhibition.
The degree of inhibition by CD8+CD25+ T cells is a function of the Tregs and not the target cells
The differences between the inhibitory effects that we observed could have been due to the CD8+ cells or to the sensitivity of the target cells to inhibition. Since the iCD8+ Tregs are able to inhibit autologous or allogeneic cells [4], we isolated CD8+ cells from responders and non-responders and tested their ability to inhibit proliferative responses of target cells from allogeneic non-responders or responders. Figure 2 shows two representative experiments in which targets from a responder, activated with SEB, were inhibited by CD8+ T cells from a responder but not from a non-responder (Figure 2A), or in which targets from both a responder and a non-responder were inhibited by CD8+ T cells from a responder (Figure 2B). Thus, the designation of the individual as a responder or non-responder was a function of the Tregs and not of the ability of the target cells to be inhibited.
Figure 2. A non-responder phenotype is a function of CD8+Tregs.

(A) CFSE-dilution of target cells cultured with CD8+CD25+ T cells from a responder and non-responder. Anti-CD3-activated CD8+ T cells from a responder inhibit proliferation of target cells (CFSE-labeled, CD8-depleted PBMC) by 71.9%, but an equal number of anti-CD3 mAb-activated CD8+ T cells from a non-responder inhibit proliferation of the same targets by only 13.3%. CD8+ T cells from control Ig cultures showed 0% inhibition (compared to cultures without added CD8+ cells). (B) CD8+ T cells from a responder activated with Teplizumab inhibit target cells from both a responder and a non-responder. Data from 2 of 3 representative experiments are shown. CD8+ cells from control Ig cultures showed 14.5% and 14.8% inhibition respectively.
Differences in cell markers and gene expression in CD8+ Tregs from responders and non-responders
We then focused on identifying differences between iCD8+ Tregs from responders and non-responders. We first compared the expression of markers that were known to be expressed on iCD8+ Tregs including CD25, CTLA-4, FoxP3, and TNFR2 by flow cytometry. As shown in Figure 3A, expression of all four markers was similar in the responders and non-responders.
Figure 3. FACS and qPCR analysis of CD8+ Tregs.

(A) Expression of markers previously associated with Tregs on gated CD8+ T cells from responders (Resp, n=6) and non-responders (Non-resp, n=6) by flow cytometry after 5 day culture with Teplizumab. (B) Expression of NKG2A of both isoforms on CD8+ cells measured by RT-PCRfrom responders (n=5) and non-responders (n=3) to Teplizumab. RNA was extracted from sorted subpopulations of CD8+25+, CD25+25− T cells after activation with anti-CD3, or following culture with control IgG. The expression of both long and short isoforms were significantly different among the cell populations (*p<0.05, **p<0.01).
We then performed 2 separate microarray analyses, with pooled RNA samples from 5 responders and 3 non-responders. From each subject tested, we sorted CD8+CD25+ and CD8+CD25− cells after 5 day culture with anti-CD3 mAb, as well as CD8+ cells from the same individual, cultured for 5 days in human IgG. We did not identify any genes that showed a significantly greater expression in responders compared to non-responders. However, in the non-responders, we found that one gene, KLRC1 was expressed at significantly higher levels than in the responders (Table 1, p=0.004). We confirmed this finding by qPCR. Again, the only gene that was consistently increased in both CD25+, the CD25− subfraction, as well as the control Ig cultures of CD8+ T cells of the non-responders was KLRC1 (Figure 3B).
Table 1.
Summary of gene microarray data*
| Fold increase | |||||||||||||
|---|---|---|---|---|---|---|---|---|---|---|---|---|---|
| Symbol | Accession | Name | Mean NR* | Mean RR* | Non-Responders | Responders | |||||||
| NR1 | NR2 | NR3 | RR1 | RR2 | RR3 | RR4 | RR5 | P | |||||
| Non-Responders > Responders | |||||||||||||
| KLRC1 | NM_213657.1 | Killer cell lectin-like receptor subfamily C | 2.82 | 0.99 | 2.17 | 3.20 | 3.08 | 0.99 | 0.91 | 1.21 | 1.00 | 0.85 | 0.004 |
| TST | NM_003312.4 | Thiosulfate sulfurtransferase (rhodanese) | 2.62 | 1.23 | 1.62 | 3.62 | 2.63 | 1.14 | 1.06 | 1.20 | 1.90 | 0.85 | 0.028 |
| CDT1 | NM_030928.2 | Chromatin licensing and DNA replication factor 1 | 5.38 | 2.58 | 1.66 | 10.2 | 4.25 | 2.07 | 2.69 | 1.10 | 4.93 | 2.09 | 0.22 |
| UBE2C | NM_181803.1 | Ubiquitin-conjugating enzyme E2C | 9.86 | 4.03 | 1.73 | 19.2 | 8.58 | 3.27 | 4.49 | 1.12 | 8.71 | 2.58 | 0.21 |
| RAB31 | NM_006868.2 | RAB31, member RAS oncogene family | 2.04 | 0.92 | 0.55 | 3.83 | 1.75 | 1.16 | 0.65 | 0.61 | 1.08 | 1.10 | 0.17 |
| CDC20 | NM_001255.2 | Cell division cycle 20 homolog | 7.85 | 3.23 | 1.37 | 15.3 | 6.94 | 2.16 | 4.25 | 1.05 | 6.58 | 2.10 | 0.20 |
| ENTPD1 | NM_001098175.1 | Ectonucleoside triphosphate diphosphohydrolase 1 | 3.07 | 1.52 | 2.10 | 2.14 | 4.97 | 0.59 | 2.06 | 0.68 | 2.96 | 1.32 | 0.14 |
| CYORF15A | NM_001005852.2 | Chromosome Y open reading frame 15A | 1.23 | 0.57 | 0.92 | 1.37 | 1.40 | 0.91 | 0.17 | 0.16 | 1.46 | 0.17 | 0.13 |
| EIF1AY | NM_004681.2 | Eukaryotic translation initiation factor 1A | 1.25 | 0.51 | 0.98 | 1.47 | 1.29 | 1.12 | 0.05 | 0.05 | 1.26 | 0.06 | 0.11 |
| AXUD1 | NM_033027.2 | AXIN1 up-regulated 1 | 3.42 | 1.65 | 2.19 | 7.11 | 0.96 | 1.98 | 0.45 | 0.75 | 0.61 | 4.43 | 0.34 |
| RPS4Y1 | NM_001008.3 | Ribosomal protein S4, Y-linked 1 | 1.03 | 0.50 | 1.12 | 1.04 | 0.93 | 1.26 | 0.02 | 0.02 | 1.17 | 0.02 | 0.22 |
|
| |||||||||||||
| Responders > Non-responders | |||||||||||||
| HS.406790 | Hs.406790 | Homo sapiens mRNA full length insert | 0.78 | 1.49 | 1.03 | 0.35 | 0.97 | 1.31 | 1.90 | 1.29 | 1.85 | 1.11 | 0.038 |
| IFIT3 | NM_001031683.1 | Interferon-induced protein with tetratricope | 1.37 | 5.40 | 0.86 | 1.21 | 2.03 | 0.97 | 2.12 | 1.64 | 1.00 | 21.3 | 0.48 |
| RSAD2 | NM_080657.4 | Radical S-adenosyl methionine domain | 1.26 | 3.13 | 0.90 | 1.00 | 1.87 | 1.06 | 2.23 | 2.81 | 0.90 | 8.65 | 0.36 |
| Hs.125087 | Hs.125087 | Homo sapiens cDNA clone IMAGE:6156595 | 1.42 | 3.62 | 0.94 | 0.96 | 2.36 | 1.07 | 3.16 | 6.48 | 0.84 | 6.57 | 0.24 |
| XIST | NR_001564.1 | X (inactive)-specific transcript (non-protein coding) | 0.75 | 7.92 | 0.91 | 0.62 | 0.73 | 0.93 | 14.7 | 16.6 | 0.65 | 6.77 | 0.16 |
| CYP1B1 | NM_000104.2 | Cytochrome P450, family 1 | 0.69 | 1.67 | 0.77 | 0.58 | 0.72 | 1.22 | 3.33 | 1.10 | 1.37 | 1.32 | 0.13 |
| IFIT1 | NM_001548.3 | Interferon-induced protein with tetratricopeptide | 0.71 | 4.63 | 0.54 | 0.56 | 1.05 | 0.58 | 3.10 | 3.28 | 0.50 | 15.7 | 0.34 |
| OAS3 | NM_006187.2 | 2′-5′-oligoadenylate synthetase 3, 100kDa | 1.86 | 4.25 | 1.04 | 1.59 | 2.96 | 1.23 | 3.31 | 2.56 | 0.94 | 13.2 | 0.47 |
| DDX60 | NM_017631.4 | DEAD box polypeptide 60 | 0.96 | 2.04 | 0.69 | 0.85 | 1.34 | 0.80 | 1.96 | 2.14 | 0.53 | 4.77 | 0.33 |
| IFI44L | NM_006820.1 | Interferon-induced protein 44-like | 2.64 | 7.91 | 0.97 | 1.92 | 5.04 | 1.03 | 6.30 | 10.7 | 0.34 | 21.1 | 0.35 |
| IFI44 | NM_006417.3 | Interferon-induced protein 44 | 1.70 | 3.83 | 0.90 | 1.25 | 2.94 | 1.21 | 3.70 | 5.48 | 0.50 | 8.26 | 0.32 |
| XAF1 | NM_199139.1 | XIAP associated factor 1 | 1.04 | 2.18 | 1.25 | 0.56 | 1.31 | 1.14 | 2.96 | 3.27 | 0.31 | 3.21 | 0.22 |
Genes that are increased more than twofold in non-responders compared to responders, and vice versa, are presented.
Genes with significant differences (P<0.05) are shown in bold.
In humans, KLRC1 exists in a long and short isoform which differ by 1 exon. We also compared the expression of each isoform, and found that the expression of both was increased in non-responders compared to responders (not shown). In all cases, the CT value of the long isoform appeared to be about 3 cycles ahead of the CT value of the short isoform. This suggests that the long isoform is about 5–10 fold more abundant than the short isoform in all cells, and this ratio was similar in both responders and non-responders.
Expression of NKG2A on CD8+ T cells and its function in culture with anti-CD3 mAb
KLRC1 gene encodes for a C-type lectin NKG2A (CD159a) that forms a heterodimer with CD94. We studied the kinetics and surface expression of NKG2A and CD94 on CD8+ T cells cultured in control Ig and anti-CD3 mAb and correlated these findings with regulatory function of CD8+ T cells. Figure 4A shows representative expression of NKG2A on 2 responders and 2 non-responders. Figure 4B shows that only a small proportion of resting CD8+ T cells express NKG2A (day 0), but its expression was increased from 4.14±0.64% to 11.3±2.43% (n=16, p=0.01) in culture with Teplizumab compared to control Ig (Figure 4C). Consistent with previous reports, NKG2A was co-expressed with CD94 (not shown) [6].
Figure 4. Expression of CD94, CD25, and NKG2A on CD8+ T cells activated with anti-CD3 mAb.

A: Staining for NKG2A is shown on CD8+ T cells from two “responders” and two “non-responders”. (B): The expression of NKG2A and CD94 was measured on gated CD8+ T cells during each day of culture with Teplizumab. The data shown are from one out of two similar experiments. (C) Comparison of NKG2A expression on cells cultured in control Ig or anti-CD3 mAb for 5 days. For control Ig: mean±SEM = 4.15±0.64, anti-CD3 mAb: 11.3±2.43 p=0.01).(C) CD25 and NKG2A staining of CD4+ (top 2 panels) and CD8+ (bottom 2 panels) cultured with control Ig (left 2 panes), or Teplizumab (right 2 panels) for 5 days.
CD25 is up-regulated on CD8+ T cells isolated from cultures with Teplizumab compared to control Ig but we did not find differences in the expression of CD25 on responders and non-responders (Figure 3A). To determine the relationship between CD25 and NKG2A we costained for both of these surface markers. Figure 4D shows that about half of the CD25+CD8+ T cells co-express NKG2A after culture with anti-CD3 mAb.
The pairing of NKG2A and CD94 creates a functional inhibitory receptor. Our finding of increased gene expression for NKG2A on CD8+ T cells from non-responders suggested that engagement of NKG2A may result in inhibition of Treg induction by anti-CD3 mAb. To test this, we added a cross-linking anti-NKG2A antibody [7] to cultures of PBMC with Teplizumab and compared the proliferation and regulatory function of CD8+ T cells from these cultures to those with Teplizumab and a control Ig. Consistent with our previous findings, Teplizumab induced proliferation of CD8+ T cells in culture. However, adding the agonistic anti-NKG2A mAb completely inhibited the proliferation of CD8+ T cells to anti-CD3 mAb (Figure 5A). It also eliminated the regulatory function of the resulting CD8+ T cells (Figures 5B and C) (p<0.05).
Figure 5. Effect of an agonistic mAb to NKG2A (1 μg/mL) on the generation of CD8+Tregs.

(A) Crosslinking NKG2A by an agonistic mAb blocks proliferation of CD8+ T cells in response to anti-CD3 (a representative experiment of 4). (B) CD8+ T cells were isolated after 5 day cultures with Teplizumab or control Ig with or without an agonistic anti-NKG2A mAb and added to autologous CD8-depleted PBMC activated with SEB Values show % inhibition. (C) Pooled data from 4 experiments showing that anti-NKG2A reduced inhibitory capacity of CD8+ cells to that of non-responders; *P=0.029 by paired t test..
Following activation with anti-CD3 mAb, CD8+ T cells show increased expression of TNFR2 which serves as a marker of cells with a stronger inhibitory phenotype [4]. When co-stained for NKG2a, the majority of NKG2a+ CD8+ T cells are also TNFR2+ (Figure 6A). We therefore compared subpopulations of CD8+ T cells, based on the expression of TNFR2 and NKG2A for their relative potency as Tregs in suppression assays. Figure 6B shows that sorted, NKG2A-negative cells have the most potent regulatory activity (p<0.003 by ANOVA).
Figure 6. Comparison of regulatory properties of CD8+ T cells based on their expression of TNFR2 and NKG2A.

(A) PBMC from healthy donors were incubated with Teplizumab or control IgG for 5 days, washed, and stained for CD8, TNFR2, and NKG2A to evaluate co-expression of NKG2a and TNFR2 on CD8+ cells; (B) PBMC from healthy donors were incubated with Teplizumab for 5 days, washed, stained for CD8, TNFR2, and NKG2A, and sorted. Subpopulations of CD8+ cells were added to CFSE-labeled autologous target cells and proliferation to SEB was assessed by FACS. Values indicate per cent of inhibition of proliferation. Pooled data from 9 separate experiments are shown. (*p<0.05, by repeated measures ANOVA).
Finally, we analyzed correlation between NKG2a expression and the ability of PBMC to generate inhibitory CD8+ cells in response to Teplizumab. There was an inverse relationship between the expression of NKG2A on resting CD8+ cells, and the degree of inhibitory properties acquired by CD8+ cells after Teplizumab (Figure 7, p<0.02). In this analysis, using the threshold of 17% inhibition as the designation as a “responder”, 5 out of 11 donors shown on Figure 7 were responders, and six were non-responders. Thus, higher levels of NKG2A on non-activated CD8+ cells were predictive of the non-responder phenotype following culture with Teplizumab.
Figure 7. Association of NKG2A expression and the ability of CD8+ T cells to proliferate and to acquire Treg function to Teplizumab.
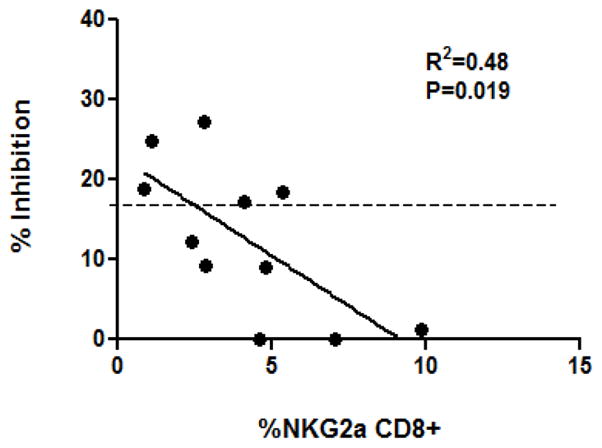
Relationship between the expression of NKG2A on CD8+CD25+ cells cultured in control IgG and the % inhibition of the Teplizumab-activated CD8+ T cells in suppression assays (r2=0.48, n=11; p=0.019). Dotted line indicates the threshold dividing responders from non-responders as described in the Results.
Discussion
CD8+ T cells acquire inhibitory phenotype when activated with anti-CD3 mAb in vivo and in vitro [1, 3, 8]. We have postulated that the function of these cells may account for the action of anti-CD3 mAb in patients with new-onset T1DM who are treated with Teplizumab. However, CD8+ Tregs are not induced in all individuals and the basis for the individual differences had not been clear from earlier investigations. Our previous attempts to identify markers that could be used to distinguish clinical responders to the drug had largely been unsuccessful except for the finding that there was an increased number of CD8+ T cells in the peripheral blood of responders. The mAb (Teplizumab) is non-FcR binding and consistent with this, we have not found differences in FcRγ II or III genotypes among clinical responders or non-responders to drug (unpublished). In the present studies, in which we evaluated differences in the induction of regulatory cells in vitro, we first determined that the basis for individual variation in response to anti-CD3 mAb was a property of the CD8+ T cells and not the target cells. The markers that we had previously associated with the induced CD8+ Tregs, including CD25, CTLA-4, TNFR2, as well as Foxp3 were unable to differentiate responders and non-responders in our functional assay. By analyzing the differences in gene expression we found higher expression of NKG2A (KLRC1) on CD8+CD25+ T cells from non-responders compared to the responders. As shown in Figure 3B, while gene expression and total protein expression did not differ significantly between cells that had been cultured in anti-CD3 mAb and control Ig the expression of cell surface NKG2A, detected by flow cytometry was increased with culture in anti-CD3 mAb. An agonistic anti-NKG2A mAb, added at the initiation of cultures, could inhibit CD8+ T cell proliferation and generation of regulatory phenotype. Furthermore, there was an inverse relationship between the expression of NKG2A in the control Ig cultures and the potency of the regulatory T cells that were induced with anti-CD3 mAb. We did not find, however, a relationship between the surface expression of NKG2A and the potency of Tregs after culture with anti-CD3 mAb. These findings and our kinetic studies suggest that NKG2A expression and ligation may be most important during the early stages of induction of the Tregs. Its expression peaks by 3 days in cultures with the anti-CD3 mAb, and ligation during the induction phase prevented generation of Tregs.
There are a number of factors that may affect the cell surface expression of NKG2A and its pairing with CD94. Therefore, the potential use of this marker to distinguish responsiveness to the induction of T cells with inhibitory properties by anti-CD3 mAb relies on analysis of the unstimulated cells. This information may be helpful for selecting potential subjects for treatment with anti-CD3 mAb and for avoiding treatment in subjects in whom the mAb is not likely to exert an immunologic effect. A limitation of our studies for patient selection is that our designation as a “responder” or “non-responder” was based on the distribution of responses that we observed in the population rather than a clinical outcome. Further studies are needed to identify the relationship between the expression of NKG2A and clinical responses to Teplizumab treatment.
In addition, a limitation of our array studies is that they involved a relatively small number of individuals. However, in each case, the expression level of NKG2A was compared to non-selected CD8+ cells which minimized variability between the analyses. It is possible that with an increased number of subjects we might have found significant differences in the expression of additional molecules that did not achieve significance in our samples. The contribution of other modulators is likely to be more subtle and may not therefore have the same utility in screening potential recipients of the drug.
NKG2A (CD159a) is a C-type lectin most commonly found on natural killer (NK) cells and on a small proportion of cytotoxic T lymphocytes [9, 10]. The molecule couples with another C-type lectin CD94 forming a receptor which recognizes the non-polymorphic MHC class Ib antigen HLA –E in humans and Qa-1 in mice [11, 12]. Once engaged, it induces an immunoreceptor tyrosine-based inhibition motif (ITIM) that delivers an inhibitory signal [13, 14], suggesting the molecule is an important regulator of NK and T cell function. Although NKG2A is expressed on a small fraction of resting CD8+ cells, it is up-regulated, upon activation, similarly to other activation markers such as CD25, TNFR2, and CD94, its coupling partner (Figure 4). Accordingly, it is possible that the response of CD8+ T cells may be affected by the activation state of the cells at the time that the mAb is administered. Previously activated cells that express higher levels of NKG2A than resting cells appear to be more resistant to development of Tregs. The molecule is also internalized and recycled. Thus our findings of decreased expression of NKG2A on cells with more potent Treg activity could reflect the recycling of the receptor[13]. However, our real-time PCR analyses would argue against this interpretation.
While expressed on a relatively small proportion of CD8 T cells even during activation with anti-CD3, engagement of this receptor completely blocks proliferation and Treg formation in CD8+ population (Figure 5). One possibility is that the NKG2A+ cells are directly responsible for the induction of Tregs possibly by production of cytokines such as TNF that we have shown are required for induction of the cells [4]. In addition, it is possible that many more CD8+ cells actually express NKG2a during the 5 days incubation with anti-CD3, but down-regulate or internalized (recycle) the molecule. Finally, it is also possible that our staining reveals only the cells that express the highest density of NKG2A, while agonistic mAb is capable of signaling in all of them. Noteworthy, cross-linking NKG2A with the agonistic mAb reduced the potency of inhibition in both responders and non-responders (Figure 5C), although the effect was more substantial in responders.
Adaptive CD8+ Tregs have been described in a number of experimental and clinical settings such as following infection with viruses and in response to mycobacteria[15–19]. The mechanisms of their actions and induction have varied and include cell killing as well as production of inhibitory factors such as CCL4[19]. CD8+ T cells have been shown to render dendritic cells tolerogenic using the inhibitory receptors ILT3 and ILT4. In previous studies we showed that iCD8+ Tregs induced with anti-CD3 mAb inhibited the proliferation of CD4+ T cells but did not induce increased cell death. Our findings suggested that contact dependent mechanisms were responsible but a role for soluble factors including TNF and CCL4 were also suggested by the finding of significant blockade of inhibition when these factors were neutralized [4]. Interestingly, Correale et al described CD8+ Tregs in patients with MS that were specific for myelin basic protein (MBP) and myelin oligodendrocyte glycoprotein (MOG) that expressed NKG2A and killed their targets in an HLA-E restricted manner[20]. The frequency of these cells decreased during exacerbations.
Our findings with human cells have been mirrored by studies in murine systems in which immunization of mice with autoreactive T cells that express Qa-1 peptide complexes prevented induction of EAE [21] by the absence of CD8+ Tregs in Qa-1 deficient mice. More recently, disruption of interaction between NKG2A and Qa-1 by a point mutation or by using anti NKG2A F(ab)2 resulted in protection of animals from EAE [22, 23]. In the latter study, a F(ab′)2 anti-NKG2A mAb decreased EAE induced to MOG. These observations are consistent with our findings of decreased function of iCD8+ Tregs with increased signaling through NKG2A. This data also suggest a common mechanism may control the induction of regulatory CD8+ T cells in mice and humans.
The basis for individual differences in the induction or function of CD8+ or even other T regs under basal conditions or in response to immune therapies has not previously been addressed. Clearly the complete loss of Foxp3, a transcriptional factor needed for the generation of CD4+ Tregs leads to aggressive autoimmune disease in humans, and in mice loss of CD28 also leads to the failure to generate naturally occurring Tregs[24–27]. Tellier et al reported that genes linked to the MHC modulate differentiation of mature CD4+ Tregs from their immature precursors in mice[28]. Barreto et al found that CTLA-4 and TGFβ variants contributed to the heritable frequency of Tregs in families with SLE[29]. However, mutations and deletions of these genes are rare and may not account for responses to therapies. In addition to genetic modulators that affect the function or expression of regulatory molecules, the effects of mAbs, such as anti-CD3 mAb, that signal T cells may be affected by molecules that are expressed by T cells at the time that drug is administered, even if the expression is transient. The immunologic state of the host cells may therefore affect responses to immune therapies. Our new findings suggest that baseline expression of NKG2A predicts the induction of CD8+ cells with regulatory function but it remains unclear whether the baseline expression of this molecule is an inherited or acquired trait. [30]. We carried out a limited study of genetic polymorphisms of NKG2A in patients but were unable to identify clear differences between responders and non-responders (data not shown) [30]. Inflammatory mediators may increase NKG2A expression which might prevent induction of Tregs by anti-CD3 mAb. The notion that inflammation blocks regulatory T cells has been developed in other experimental settings[31].
Our findings may have relevance to understanding the effects of anti-CD3 mAb therapy and for developing new ways of improving clinical responses. First, they suggest how T cell responses are affected by mAb treatment and indicate factors that may modify those responses. This information may help to identify individuals who are most likely to respond to treatment and avoid administration in those who are not. In addition, blocking NKG2A by a non-activating reagent may improve the efficacy of anti-CD3 mAb by preventing inhibitory signals to CD8+ T cells and cause the successful induction of Tregs in these individuals. Testing this hypothesis and its relevance to clinical responses will require further studies.
Methods
Human samples
Buffy coats from healthy volunteers were obtained from the New York Blood Center (Long Island City, NY), and peripheral blood mononuclear cells (PBMC) were isolated by Ficoll-Hypaque gradient centrifugation (Ficoll-Paque PLUS, GE Healthcare, Uppsala, Sweden) All protocols were approved by the Yale University Institutional Review Board.
Culture with anti-CD3 mAb and isolation of CD8+ regulatory T cells
Teplizumab (hOKT3γ1(Ala-Ala)) was obtained from MacroGenics, Inc (Rockville, MD)[32]. PBMC were cultured in AIM-V medium (Invitrogen, Grand Island, NY) at 1×10⁶/mL with Teplizumab at 4 μg/ml or with normal human IgG (Sigma, St. Louis, MO). In certain cultures, an agonist anti-NKG2A antibody (Clone 131411, R&D Systems, Minneapolis, MN) was added at concentration 1 μg/mL [7]. For flow cytometry, cells were stained with mAb against NKG2A (clone Z199.1, Beckman Coulter, Marseille, France); anti-human CD8, CD25, CTLA-4, TNFR2, and Foxp3 were from BD Biosciences (San Jose, CA). Anti-human CD94 mAb (clone DX22) was from eBioscience (San Diego, CA). On day 5 of cultures, cells were collected and sorted either as total CD8+, or as CD25+ or CD25− cells based on a threshold determined by staining with an isotype control mAbs using a FACSAria cell sorter (BD Biosciences). Total CD8+ cells were sorted from cultures with human IgG as negative controls since there was no detectable CD25 expression on these CD8+ cells. Where indicated, CD8+ cells were sorted on the basis of TNFR2 and NKG2A expression. The sorted cells were added to autologous or allogeneic PBMC that were depleted of CD8+ cells using Dynabeads CD8 isolation kit (Invitrogen Dynal, Oslo, Norway), and labeled with CFSE (Cell Trace Kit, Invitrogen)(here, designated as target cells). The target cells and sorted CD8+ T cells (105 each) were incubated with SEB (1μg/ml, Sigma, St. Louis, MO) in AIM-V medium for 72 hrs, after which the dilution of CFSE was analyzed by FACS using the FlowJo software (TreeStar Inc, Ashland, OR), and inhibition of proliferation was calculated as [1−(%divided with added cells/%divided without added cells)] x100.
Gene array analysis
Some of the CD8+CD25+ and CD8+CD25− T cells sorted from cultures with Teplizumab were used for gene expression studies. Total RNA was prepared using the RNeasy mini kit (Qiagen, Valencia, CA), and further processed with the “Illumina TotalPrep” RNA Amplification Kit (Ambion Inc., Austin, TX). Two μg of cRNA was placed in 11μl ultrapure water and was hybridized onto Illumina HumanWG-6 v2 Expression BeadChip arrays (Illumina, Inc., San Diego, CA). Data were imported into the BeadStudio and analyzed using the GeneSpring GX software package (Agilent Technologies, Stamford, CT).
To statistically compare and identify genes with significant changes between two or more groups in the study, we used either Student’s t-test (p < 0.01) or one-way ANOVA, respectively. To address the possibility that changes in expression could occur by chance, we applied a Benjamini and Hochberg multiple testing correction calculation, which controls the false discovery rate, and is set at < 0.01.
Quantitative PCR
In order to verify by qPCR whether any of the genes differentially expressed on microarrays, were increased or decreased in responders or non-responders to anti-CD3 mAb culture, we designed primers for about 120 human genes including KLRC1, GZMB, CD25, IFNG, CD44, TBET, FOXP3, and others. Aliquots of ~1μg cRNA each from the original 24 samples used in the two array experiments were subjected to reverse transcriptase reactions using Superscript II (Invitrogen) and hexamers-dT, to prepare cDNA. For the KLRC1 QPCR reaction, we used primers KLRQF1 = ACAGTCAAACCCATGGAGACAGAA and KLRQR1 = ATTCGCAGAGTTACAACCATCACC, amplifying a 156bp fragment in the UTR of the gene[10, 33]. QPCR reactions were performed in 96-well PCR plates, at 10ul final volumes, using 1:40,000 dilution of SYBR Green I (Invitrogen) and 1U Taq polymerase, 0.2μM each primer; 200μM each dNTP, and 1μl cDNA (~1/100 of the cDNA syntesized from the ~1μg cRNA in the RT reaction). Cycling conditions were 94°C/20sec; 60°C/10sec; 70°C/30sec, x40 cycles. Since there are two major isoforms from this gene, one long, with 7 exons, the other short, with 6 exons (lacking exon #4), we made PCR primers to detect each of these isoforms. Primers forward KLR7F = CATTGTTGGGATCCTGGGAATTAT and reverse KLR7R = GGGAAGAATTGTTGTGCCTCTGTA amplify a 103bp fragment only from the isoform with all 7 exons, since the reverse primer is located inside the spliceable exon 4, that the short isoform lacks. Forward primer KLR6F = GGTAACGATAGTTGTTATTCCCTCACGTCATT, and reverse primer KLR67R = TGTGGTAACGATAGTTGTTATTCCCT amplify a 203bp fragment only from the short isoform, since the forward primer spans junction of exons 3/5.
Statistical analysis was performed using GraphPad Prizm® Version 5 software (GraphPad Software Inc., San Diego, CA). One way analysis of variance (ANOVA) was used with P<0.05 considered significant. Where indicated, paired t test was used. Linear regression analysis was used to evaluate correlation.
Acknowledgments
This work was supported by NIH grants DK057846 and UL1 RR024139, grants 2006-351, 2006-502, 2007-1059, and grant 2005-1168 from the Juvenile Diabetes Research Foundation, and a gift from the Brehm foundation.
VA designed, performed the studies, analyzed the data, and wrote the manuscript. OH performed array studies and analyzed the data. PP-H assisted with performing the studies. KH designed the studies, analyzed the data, and wrote the manuscript.
The authors are thankful to Mr. Geoffrey Lyon for expert cell sorting.
Footnotes
Conflicts of interests
KH has received a grant from MacroGenics Inc to study patients treated with anti-CD3 mAb.
References
- 1.Herold KC, Gitelman SE, Masharani U, Hagopian W, Bisikirska B, Donaldson D, Rother K, Diamond B, Harlan DM, Bluestone JA. A Single Course of Anti-CD3 Monoclonal Antibody hOKT3{gamma}1(Ala-Ala) Results in Improvement in C-Peptide Responses and Clinical Parameters for at Least 2 Years after Onset of Type 1 Diabetes. Diabetes. 2005;54:1763–1769. doi: 10.2337/diabetes.54.6.1763. [DOI] [PMC free article] [PubMed] [Google Scholar]
- 2.Herold KC, Hagopian W, Auger JA, Poumian-Ruiz E, Taylor L, Donaldson D, Gitelman SE, Harlan DM, Xu D, Zivin RA, Bluestone JA. Anti-CD3 monoclonal antibody in new-onset type 1 diabetes mellitus. N Engl J Med. 2002;346:1692–1698. doi: 10.1056/NEJMoa012864. [DOI] [PubMed] [Google Scholar]
- 3.Bisikirska B, Colgan J, Luban J, Bluestone JA, Herold KC. TCR stimulation with modified anti-CD3 mAb expands CD8 T cell population and induces CD8CD25 Tregs. J Clin Invest. 2005;115:2904–2913. doi: 10.1172/JCI23961. [DOI] [PMC free article] [PubMed] [Google Scholar]
- 4.Ablamunits V, Bisikirska B, Herold KC. Acquisition of regulatory function by human CD8(+) T cells treated with anti-CD3 antibody requires TNF. Eur J Immunol. 2010;40:2891–2901. doi: 10.1002/eji.201040485. [DOI] [PMC free article] [PubMed] [Google Scholar]
- 5.Herold KC, Burton JB, Francois F, Poumian-Ruiz E, Glandt M, Bluestone JA. Activation of human T cells by FcR nonbinding anti-CD3 mAb, hOKT3gamma1(Ala-Ala) J Clin Invest. 2003;111:409–418. doi: 10.1172/JCI16090. [DOI] [PMC free article] [PubMed] [Google Scholar]
- 6.Brooks AG, Posch PE, Scorzelli CJ, Borrego F, Coligan JE. NKG2A complexed with CD94 defines a novel inhibitory natural killer cell receptor. J Exp Med. 1997;185:795–800. doi: 10.1084/jem.185.4.795. [DOI] [PMC free article] [PubMed] [Google Scholar]
- 7.Culley FJ, Johnson M, Evans JH, Kumar S, Crilly R, Casasbuenas J, Schnyder T, Mehrabi M, Deonarain MP, Ushakov DS, Braud V, Roth G, Brock R, Kohler K, Davis DM. Natural killer cell signal integration balances synapse symmetry and migration. PLoS Biol. 2009;7:e1000159. doi: 10.1371/journal.pbio.1000159. [DOI] [PMC free article] [PubMed] [Google Scholar]
- 8.Ablamunits V, Bisikirska BC, Herold KC. Human regulatory CD8 T cells. Ann N Y Acad Sci. 2008;1150:234–238. doi: 10.1196/annals.1447.000. [DOI] [PubMed] [Google Scholar]
- 9.Lazetic S, Chang C, Houchins JP, Lanier LL, Phillips JH. Human natural killer cell receptors involved in MHC class I recognition are disulfide-linked heterodimers of CD94 and NKG2 subunits. J Immunol. 1996;157:4741–4745. [PubMed] [Google Scholar]
- 10.Houchins JP, Yabe T, McSherry C, Bach FH. DNA sequence analysis of NKG2, a family of related cDNA clones encoding type II integral membrane proteins on human natural killer cells. J Exp Med. 1991;173:1017–1020. doi: 10.1084/jem.173.4.1017. [DOI] [PMC free article] [PubMed] [Google Scholar]
- 11.Posch PE, Borrego F, Brooks AG, Coligan JE. HLA-E is the ligand for the natural killer cell CD94/NKG2 receptors. J Biomed Sci. 1998;5:321–331. doi: 10.1007/BF02253442. [DOI] [PubMed] [Google Scholar]
- 12.Miller JD, Weber DA, Ibegbu C, Pohl J, Altman JD, Jensen PE. Analysis of HLA-E peptide-binding specificity and contact residues in bound peptide required for recognition by CD94/NKG2. J Immunol. 2003;171:1369–1375. doi: 10.4049/jimmunol.171.3.1369. [DOI] [PubMed] [Google Scholar]
- 13.Borrego F, Kabat J, Sanni TB, Coligan JE. NK cell CD94/NKG2A inhibitory receptors are internalized and recycle independently of inhibitory signaling processes. J Immunol. 2002;169:6102–6111. doi: 10.4049/jimmunol.169.11.6102. [DOI] [PubMed] [Google Scholar]
- 14.Kabat J, Borrego F, Brooks A, Coligan JE. Role that each NKG2A immunoreceptor tyrosine-based inhibitory motif plays in mediating the human CD94/NKG2A inhibitory signal. J Immunol. 2002;169:1948–1958. doi: 10.4049/jimmunol.169.4.1948. [DOI] [PubMed] [Google Scholar]
- 15.Billerbeck E, Blum HE, Thimme R. Parallel expansion of human virus-specific FoxP3− effector memory and de novo-generated FoxP3+ regulatory CD8+ T cells upon antigen recognition in vitro. J Immunol. 2007;179:1039–1048. doi: 10.4049/jimmunol.179.2.1039. [DOI] [PubMed] [Google Scholar]
- 16.Billerbeck E, Bottler T, Thimme R. Regulatory T cells in viral hepatitis. World J Gastroenterol. 2007;13:4858–4864. doi: 10.3748/wjg.v13.i36.4858. [DOI] [PMC free article] [PubMed] [Google Scholar]
- 17.Billerbeck E, Nakamoto N, Seigel B, Blum HE, Chang KM, Thimme R. Determinants of in vitro expansion of different human virus-specific FoxP3+ regulatory CD8+ T cells in chronic hepatitis C virus infection. J Gen Virol. 2009;90:1692–1701. doi: 10.1099/vir.0.009837-0. [DOI] [PMC free article] [PubMed] [Google Scholar]
- 18.Billerbeck E, Thimme R. CD8+ regulatory T cells in persistent human viral infections. Hum Immunol. 2008;69:771–775. doi: 10.1016/j.humimm.2008.07.016. [DOI] [PubMed] [Google Scholar]
- 19.Joosten SA, van Meijgaarden KE, Savage ND, de Boer T, Triebel F, van der Wal A, de Heer E, Klein MR, Geluk A, Ottenhoff TH. Identification of a human CD8+ regulatory T cell subset that mediates suppression through the chemokine CC chemokine ligand 4. Proc Natl Acad Sci U S A. 2007;104:8029–8034. doi: 10.1073/pnas.0702257104. [DOI] [PMC free article] [PubMed] [Google Scholar]
- 20.Correale J, Villa A. Isolation and characterization of CD8+ regulatory T cells in multiple sclerosis. J Neuroimmunol. 2008;195:121–134. doi: 10.1016/j.jneuroim.2007.12.004. [DOI] [PubMed] [Google Scholar]
- 21.Panoutsakopoulou V, Huster KM, McCarty N, Feinberg E, Wang R, Wucherpfennig KW, Cantor H. Suppression of autoimmune disease after vaccination with autoreactive T cells that express Qa-1 peptide complexes. J Clin Invest. 2004;113:1218–1224. doi: 10.1172/JCI20772. [DOI] [PMC free article] [PubMed] [Google Scholar]
- 22.Lu L, Kim HJ, Werneck MB, Cantor H. Regulation of CD8+ regulatory T cells: Interruption of the NKG2A-Qa-1 interaction allows robust suppressive activity and resolution of autoimmune disease. Proc Natl Acad Sci U S A. 2008;105:19420–19425. doi: 10.1073/pnas.0810383105. [DOI] [PMC free article] [PubMed] [Google Scholar]
- 23.Leavenworth JW, Schellack C, Kim HJ, Lu L, Spee P, Cantor H. Analysis of the cellular mechanism underlying inhibition of EAE after treatment with anti-NKG2A F(ab′)2. Proc Natl Acad Sci U S A. 2010;107:2562–2567. doi: 10.1073/pnas.0914732107. [DOI] [PMC free article] [PubMed] [Google Scholar]
- 24.Salomon B, Lenschow DJ, Rhee L, Ashourian N, Singh B, Sharpe A, Bluestone JA. B7/CD28 costimulation is essential for the homeostasis of the CD4+CD25+ immunoregulatory T cells that control autoimmune diabetes. Immunity. 2000;12:431–440. doi: 10.1016/s1074-7613(00)80195-8. [DOI] [PubMed] [Google Scholar]
- 25.Bennett CL, Christie J, Ramsdell F, Brunkow ME, Ferguson PJ, Whitesell L, Kelly TE, Saulsbury FT, Chance PF, Ochs HD. The immune dysregulation, polyendocrinopathy, enteropathy, X-linked syndrome (IPEX) is caused by mutations of FOXP3. Nat Genet. 2001;27:20–21. doi: 10.1038/83713. [DOI] [PubMed] [Google Scholar]
- 26.Sakaguchi S. The origin of FOXP3-expressing CD4+ regulatory T cells: thymus or periphery. J Clin Invest. 2003;112:1310–1312. doi: 10.1172/JCI20274. [DOI] [PMC free article] [PubMed] [Google Scholar]
- 27.Wildin RS, Ramsdell F, Peake J, Faravelli F, Casanova JL, Buist N, Levy-Lahad E, Mazzella M, Goulet O, Perroni L, Bricarelli FD, Byrne G, McEuen M, Proll S, Appleby M, Brunkow ME. X-linked neonatal diabetes mellitus, enteropathy and endocrinopathy syndrome is the human equivalent of mouse scurfy. Nat Genet. 2001;27:18–20. doi: 10.1038/83707. [DOI] [PubMed] [Google Scholar]
- 28.Tellier J, van Meerwijk JP, Romagnoli P. An MHC-linked locus modulates thymic differentiation of CD4+CD25+Foxp3+ regulatory T lymphocytes. Int Immunol. 2006;18:1509–1519. doi: 10.1093/intimm/dxl084. [DOI] [PMC free article] [PubMed] [Google Scholar]
- 29.Barreto M, Ferreira RC, Lourenco L, Moraes-Fontes MF, Santos E, Alves M, Carvalho C, Martins B, Andreia R, Viana JF, Vasconcelos C, Mota-Vieira L, Ferreira C, Demengeot J, Vicente AM. Low frequency of CD4+CD25+ Treg in SLE patients: a heritable trait associated with CTLA4 and TGFbeta gene variants. BMC Immunol. 2009;10:5. doi: 10.1186/1471-2172-10-5. [DOI] [PMC free article] [PubMed] [Google Scholar]
- 30.Shum BP, Flodin LR, Muir DG, Rajalingam R, Khakoo SI, Cleland S, Guethlein LA, Uhrberg M, Parham P. Conservation and variation in human and common chimpanzee CD94 and NKG2 genes. J Immunol. 2002;168:240–252. doi: 10.4049/jimmunol.168.1.240. [DOI] [PubMed] [Google Scholar]
- 31.Ricciardelli I, Lindley KJ, Londei M, Quaratino S. Anti tumour necrosis-alpha therapy increases the number of FOXP3 regulatory T cells in children affected by Crohn’s disease. Immunology. 2008;125:178–183. doi: 10.1111/j.1365-2567.2008.02839.x. [DOI] [PMC free article] [PubMed] [Google Scholar]
- 32.Xu D, Alegre ML, Varga SS, Rothermel AL, Collins AM, Pulito VL, Hanna LS, Dolan KP, Parren PW, Bluestone JA, Jolliffe LK, Zivin RA. In vitro characterization of five humanized OKT3 effector function variant antibodies. Cell Immunol. 2000;200:16–26. doi: 10.1006/cimm.2000.1617. [DOI] [PubMed] [Google Scholar]
- 33.Park KS, Park JH, Song YW. Inhibitory NKG2A and activating NKG2D and NKG2C natural killer cell receptor genes: susceptibility for rheumatoid arthritis. Tissue Antigens. 2008;72:342–346. doi: 10.1111/j.1399-0039.2008.01110.x. [DOI] [PubMed] [Google Scholar]