Abstract
The analysis of proteins by reversed-phase liquid chromatography (RPLC) commonly involves the use of TFA as an ion-pairing agent, even though it forms adducts and suppresses sensitivity. The presence of adducts can complicate protein molecular weight assignment especially when protein isoforms coelute as in the case of histones. To mitigate the complicating effects of TFA adducts in protein LC-MS, we have optimized TFA-free methods for protein separation. Protein standards and histones were used to evaluate TFA-free separations using capillary (0.3 mm id) and nanoscale (0.1 mm id) C8 columns with the ion-pairing agents, formic acid or acetic acid. The optimized method was then used to examine the applicability of the approach for histone characterization in human cancer cell lines and primary tumor cells from chronic lymphocytic leukemia patients.
Keywords: Histone, RPLC-MS, TFA-free, capillary/nanoscale separation
INTRODUCTION
Nucleosomes, comprised of DNA and histones, are the fundamental unit of chromatin and are responsible for to the regulation of chromatin structure and function [1]. Chromatin structure influences DNA replication, repair, and recombination, as well as gene transcription [2]. Traditionally, to identify histones and their PTMs, immunoassay techniques such as immunoprecipitation, western-blotting, and immunofluorescence have been commonly utilized [3–5]. However, the shortcomings of these methods limit their applications. Immunoassays are dependent on the availability of high specificity antibodies for known modification sites. Furthermore, the specificity of the antibody to a given posttranslational modification can be affected by modifications on neighboring amino acids in the epitope [6]. Moreover, the identification and characterization of histones are complicated because of sequence variants and their multiple PTMs. These variants usually differ from each other by only a few amino acids, which may or may not be within the antigenic epitope. Therefore, detection of specific variants by antibodies is especially challenging [7].
Recently, Liquid Chromatography Mass Spectrometry (LC-MS) has become increasingly popular to analyze histones and their PTMs [8, 9]. Ion-pairing agents are added to the LC mobile phases to bind analytes and neutralize charge in order to improve chromatographic resolution. The most commonly used ion-pairing reagent in histone analysis is trifluoroacetic acid (TFA). TFA provides excellent chromatographic protein separation, but causes signal suppression in ESI–MS systems due to ion pair formation and increased mobile phase surface tension [10, 11]. In addition, TFA binds the histones producing adducts that decrease the limit of detection and complicate the data analysis. The alternative ion-pairing agent heptafluorobutyric acid (HFBA) has also been shown to exhibit the same effects [8]. Weaker ion-pairing reagents, such as formic acid and acetic acid, form adducts that are less stable but result in poorer chromatography performance. Consequently, the choice of ion-pairing reagents is a balance between sensitivity and separation efficiency.
Mixtures of TFA with other ion-pairing agents have been used to separate and identify proteins by LC-MS. Duchateau et al. used a mixture of TFA and formic acid to obtain high separation efficiency and better sensitivity [12]. Years later Clarke et al. [13] tested a mixture of acetic acid (0.5%) and TFA (0.02%) for the analysis of amyloid-β polypeptides. Chong et al. [14] used the combination of TFA (0.1%) and formic acid (0.2 to 0.3%) to characterize proteins from human breast cancer cells [15]. Despite these efforts, even modest amounts of TFA still result in adduct formation complicating data analysis, especially when species coelute and are isobaric in mass with the TFA adducts.
The focus of the work described in this manuscript was to develop TFA-free histone separations. We offset the decreased chromatographic performance brought on using weak ion-pairing agent by capillary and nanoscale columns. We evaluated the performance of formic acid, acetic acid, and a mixture of formic acid and TFA at varied mobile phase concentrations on C8 columns of different column diameters and particle sizes. Core histones extracted from bovine calf thymus and protein standards were used for method optimization. The optimized methods were then evaluated for their ability to profile histones by LC-MS for human cancer cell lines and primary tumor cells from chronic lymphocytic leukemia (CLL) patients.
EXPERIMENTAL
Preparation Of Cell Lines
Peripheral blood was obtained from patients following written consent. Patients were diagnosed with CLL by NCI 1996 criteria [16] and had elevated peripheral leukocyte counts (> 20,000/μL), but were otherwise unselected based on disease stage or prognostic subgroup. CLL B-cells were negatively selected using RosetteSep (Stem Cell Technologies, Vancouver, BC) and isolated by ficoll density gradient centrifugation. Cells were incubated at 37 °C and 5% CO2 in RPMI 1640 with 10% fetal bovine serum (FBS), 100 U/mL penicillin, 100 μg/mL streptomycin, and 2 mM L-glutamine (Sigma-Aldrich Co., St. Louis, MO).
The non-malignant immortalized breast cell line, MCF-10A (CRL-10317) and the breast cancer cell lines, MCF-7 (HTB-22) and MDA-MB-231 (HTB-26), were obtained from ATCC (Manassas, VA). MCF-10A cells were cultured in DMEM/F-12 (#11320-033, Life Technologies, Carlsbad, CA) with 5% Horse serum (Life Technologies), 100 μM MEM Non-Essential Amino Acid (NEAA, #111-400-50, Life Technologies), 10 mg/mL EGF (#E1257, Sigma-Aldrich Co., St. Louis, MO), 0.5 μg/mL Hydrocortisone (EMD Chemicals Inc., Gibbstown, NJ), 100 ng/mL Cholera Toxin (#C8052, Sigma-Aldrich Co.), and 10 μg/mL bovine insulin (#I5500, Sigma-Aldrich Co.) as described previously [17]. MCF-7 and MDA-MB-231 cells were cultured in RPMI Medium 1640 (#11875-119, Life Technologies) and DMEM (#11965-126, Life Technologies), respectively, in the presence of 10% FBS and MEM NEAA. All three cell lines were maintained in humidified incubator with 5% CO2. At the time of splitting or harvesting, cells were treated with 0.05% or 0.25% trypsin for 10 minutes with subsequent termination by addition of growth medium then washed with ice-cold PBS and stored at −80 °C.
Preparation Of Protein Standards
Ubiquitin from bovine erythrocytes and insulin from bovine pancreas were purchased from Sigma-Aldrich Corp (St. Louis, MO). Carbonic anhydrase from bovine erythrocytes, cytochrome C from equine heart, lysozyme from chicken egg white, and myoglobin from equine heart were purchased from Protea Biosciences Inc. (Morgantown, WV). A six-component equimolar (50 μM) mixture of them was made by dissolving and mixing all the compounds by HPLC grade water.
Extraction Of Histones From Bovine Calf Thymus
Core histones were extracted from bovine calf thymus (Worthington Biochemical Corp., Lakewood, NJ) using an acidic extraction procedure previously described [6, 18].
Extraction Of Histones From Human Cells
Histones in human cancer cells (1.0×10⁸ cells) were extracted as previously described [19]. The cell pellet was resuspended with 5 mL ice cold nuclei isolation buffer (NIB) (10 mM Tris-HCl, pH 7.5, 10 mM NaCl, 3 mM MgCl2, 0.5% Nonidet P-40, 0.15 mM Spermine, and 0.5 mM Spermidine) and incubated on ice for 5 min. Nuclei were pelleted by 1,500 rpm centrifugation at 4 °C for 15 min, and then the nuclei pellet was washed with 5 mL solution (10 mM Tris-HCl, pH 7.5, 150 mM NaCl) and resuspended in 400 μL 0.4 M H2SO4 (ice cold), followed by 30 min incubation on ice. After 15 min centrifugation (14,000 rpm, 4 °C), acetone was added to the supernatant with a final concentration of 80% to precipitate histones at −20 °C overnight. The precipitate was washed with ice cold acetone, and dried, and dissolved in water before HPLC separation.
Liquid Chromatography Mass Spectrometry (LC-MS)
Histone extracts and protein standards were separated by reversed-phase HPLC (Dionex Ultimate 3000 capillary/nano HPLC system, Dionex, Sunnyvale, CA) and mass analyzed with either a Thermo Fisher LTQ Orbitrap XL, or an LCQ Deca XP (Thermo Finnigan, San Jose, CA), equipped with micro/nanospray ionization sources (Michrom Bioresources Inc., Auburn, CA). HPLC separations were carried out at a flow rate of 5 μL/min or 7 μL/min on a 0.3 mm × 150 mm C8 column (5 μm, 300 Å, Michrom Bioresources Inc., Auburn, CA), and at a flow rate of 1 μL/min on a 0.1 mm × 150 mm C8 column (3 μm, 300 Å, Michrom Bioresources Inc., Auburn, CA). The mobile phases consisted of HPLC grade water, and acetonitrile (ACN), with TFA, formic acid, or acetic acid added as ion-pairing reagents. The optimized gradient methods were developed to provide the optimal separation of core histones and protein standards. The optimized gradient to separate histones was a linear-convex segment gradient (Table 1). Protein standards were eluted with a linear segment gradient (Table 2). The heated capillary temperature and electrospray voltage were set at 175°C and 2.0kV, respectively. Molecular weight and distribution of protein isoforms were determined using Xtract deconvolution (Thermo FisherScientific, San Jose, CA) and IsoPro 3.1 (http://sites.google.com/site/isoproms/).
Table 1.
Linear-convex gradient for histone separation.
| Time range | % B | Curve |
|---|---|---|
| 0–5 min | 20% - 20% | linear |
| 5–25 min | 20% – 30% | convex 2 |
| 25–65 min | 30% – 35% | convex 4 |
| 65–78 min | 35% – 48% | linear |
Table 2.
Linear gradient for protein standard separation.
| Time range | % B |
|---|---|
| 0–5 min | 15% – 15%583 |
| 5–15 min | 15% – 35% |
| 15–20 min | 35% – 40%584 |
| 20–25 min | 40% – 40% |
| 25–27 min | 40% – 60%585 |
RESULTS AND DISCUSSION
Effect Of TFA Ion-Pairing Agent On The ESI-MS Spectra Of Histones
Effective separations of proteins by RP-HPLC require the addition of ion-pairing agents. These components form ion-pairs with protein analytes’ charged side-chains exposing the hydrophobic core of the protein. Consequently, the interaction of proteins with the hydrophobic stationary phase allows for their retention and separation [15, 20]. Organic acids are common ion-pairing agents and their low pKa promotes protein unfolding and denaturation. The combination of ion-pairing and unfolding results in proteins adopting similar conformations in solution manifested by sharp and symmetrical peaks [10, 21, 22].
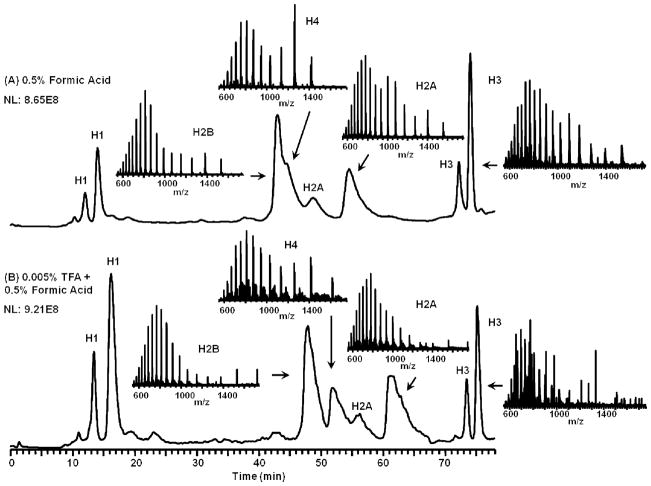
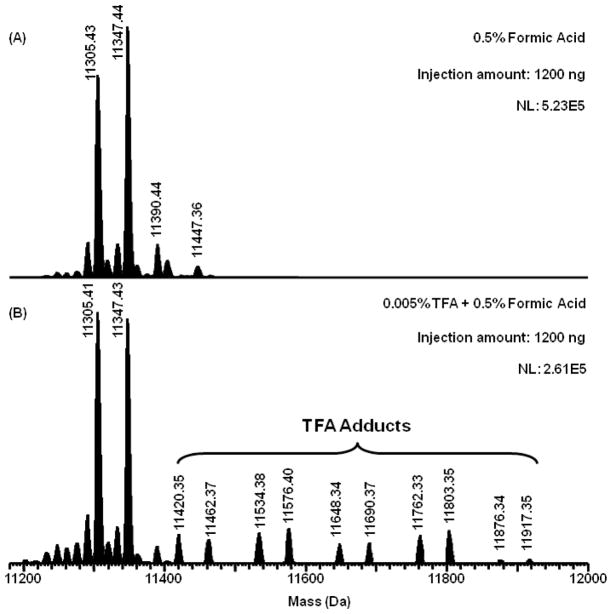
The most frequently used ion-pairing agent TFA, even in modest amounts, results in the formation of adducts with basic species complicating data analysis. For histone profiling, this is especially a problem due to their highly basic nature and protein modifications that can be obscured by the TFA adducts. To illustrate this effect, Figure 1 shows a capillary (0.3 mm id, 5 μm particle size) LC-MS separation of bovine histones using either 0.5% formic acid or a mixture of 0.5% formic acid and 0.005% TFA as the mobile phase modifiers. Comparison of the two histone profiles reveals that TFA gave a better separation of histones, and improved retention times, which can be attributed to its well-known ion pairing. This effect may also be partially attributed to the adsorption of TFA on the RP surface and consequent ion interaction effects [23]. Formic acid yielded higher signal response (as measured by the total ion current from separations with the same quantity injected onto the column) and thus higher sensitivity. More important, TFA in the mobile phase gives rise to adducts that suppress ionization and complicate data analysis (Figure 2). Attempts to disrupt the TFA adducts using nozzle skimmer dissociation ultimately result in fragmentation of histone H4 (data not shown) before the adducts are disrupted. TFA also affects stability of the electrospray resulting in decreased sensitivity [10]. A comparison of two histone profiles in Figure 1 and Figure 2 shows that it is possible to balance efficient LC separation and sensitive mass detection. For the characterization of histones with complex co-eluting PTMs, the elimination of adducts is necessary to not only simplify data analysis but also improve the detection of low abundant species.
Figure 1.
Capillary LC-MS separation of bovine histones, 5 μL/min, C8 column, 0.3 mm × 150 mm, 5 μm, 300 Å. (A): The separation performed without TFA, (B): The separation with TFA. The absence of TFA adducts on (A) is noticeable. Data were collected on an LTQ Orbitrap XL.
Figure 2.
Reconstructed mass spectra of H4 from Figure 1 using the Xtract deconvolution software (Thermo FisherScientific, San Jose, CA). (A): The H4 profile obtained without TFA, (B): The H4 profile with TFA present. Data were collected on an LTQ Orbitrap XL. TFA adduct formulas, observed and expected masses are listed in Supporting Information Table S2.
Optimization Of TFA-Free Histone LC-MS
Our laboratory has taken great efforts to develop histone separation methods for LC-MS. We have previously reported on the application of microbore separations based on the 1.0 mm × 150 mm C18 columns (Discovery Bio wide pore C18 column, 5 μm, 300 Å, Supleco Inc., Bellefonte, PA) using TFA as a mobile phase additive [6, 7, 24]. Histone separations yield an average peak capacity of 65 for this method. When we evaluated the capillary scale (0.3 mm id) separations, we found that C18 columns provided poorer performance than C8 columns. The use of a 0.3 mm id C8 column w/TFA (Figure 1) provided significantly improved peak capacity (124) over the microbore separations.
In this study, in order to develop TFA-free histone separation methods, several variants and factors important for LC and MS performance were optimized; gradient elution program, flow rate, ion-pairing agent(s) and their concentration(s) in the mobile phase, column id (capillary scale 0.3 mm id, and nanoscale 0.1 mm id), and the particle size of stationary phase. Figure S1 in Supporting Information shows the capillary scale LC-MS separation of bovine histones at different flow rates using 1% formic acid as the modifier. 5 μL/min and 7 μL/min flow rates yielded similar peak capacities (120 and 126). However, 5 μL/min gave slightly better resolution compared with that of 7 μL/min. Therefore, we optimized all additional parameters using the 5 μL/min flow rate.
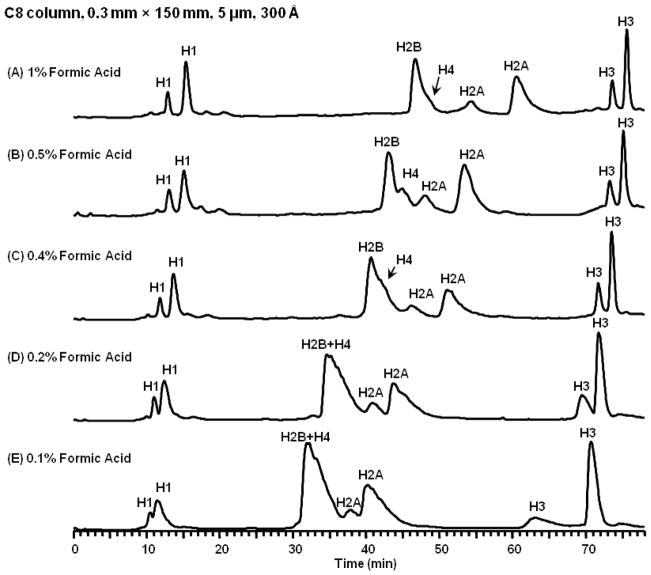
Next we evaluated the use of formic acid and acetic acid as ion-pairing agents at varying concentrations in mobile phase. Figure 3 shows the LC-MS separations of bovine histones with the optimized gradient over 5 different concentrations of formic acid in mobile phase, 0.1%, 0.2%, 0.4%, 0.5%, and 1%. Separation resolution was enhanced with increased mobile phase concentrations of formic acid until it is above 0.5%. Peak shape improved and peak widths at half height decreased when increasing concentration of formic acid in mobile phase. No significant difference was observed between 0.5% and 1.0% formic acid. The increased retention time of the histones at higher formic acid concentrations in the mobile phase is due to increased adsorption of formic acid on the RP surface and consequently more ion interaction effects [15]. Peak capacity also decreased as the concentration of formic acid in mobile phase decreased. The peak capacity was 120 for 1% formic acid, 116 for 0.5% formic acid, 112 for 0.4% formic acid, 71 for 0.2% formic acid, 52 for 0.1% formic acid. We also noted higher background with 1% formic acid (2.5 times higher noise level) compared with 0.5% formic acid, emphasizing the importance of high purity reagents. Therefore, we selected 0.5% formic acid as the preferred mobile phase modifier concentration.
Figure 3.
Capillary LC-MS chromatograms of bovine histones, 5 μL/min, C8 column, 0.3 mm × 150 mm, 5 μm, 300 Å. Data were collected on an LTQ Orbitrap XL. From (A) to (E): 1%, 0.5%, 0.4%, 0.2%, and 0.1% formic acid.
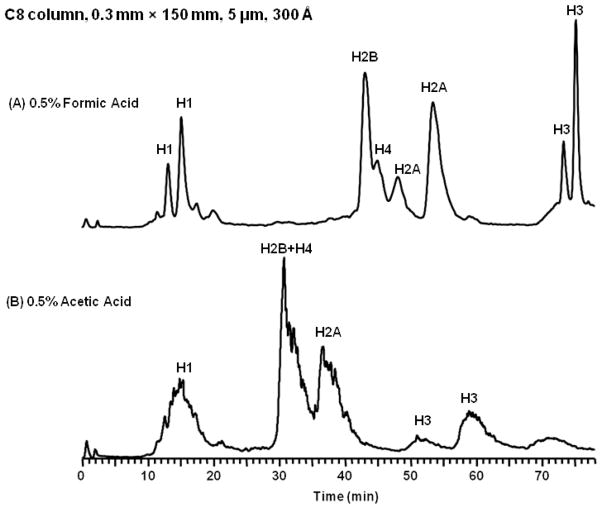
In addition to formic acid, acetic acid (0.5%, 1%) was also evaluated as a mobile phase modifier. Figure 4 shows the LC-MS separations of bovine histones with the optimized gradient over 2 different conditions, 0.5% formic acid and 0.5% acetic acid. Acetic acid provided much poorer separation as compared to formic acid. The chromatogram with 1% acetic acid wasn’t shown as no signal was obtained because of the high noise level presumably due to the increased amount of acetic acid. These results are consistent with those reported by Garcia [20]. The better performance of the formic acid can be partially explained by the strength of the ion-pair complex. Formic acid has a pKa = 3.75 compared to acetic acid’s pKa = 4.75. The ion-pair complex forms a stronger bond with formic acid than with acetic acid because its lower pKa, thus decreasing dissociation of the ion-pair bond. Overall the effect is a reduction in the band broadening for separations using formic acid.
Figure 4.
Capillary LC-MS chromatograms of bovine histones, 5 μL/min, C8 column, 0.3 mm × 150 mm, 5 μm, 300 Å. Data were collected on an LTQ Orbitrap XL. (A): 0.5% formic acid, (B): 0.5% acetic acid.
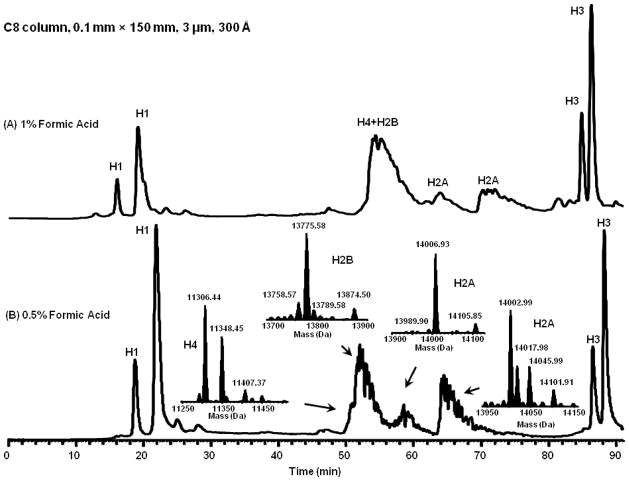
Next we evaluated the use of smaller id column with smaller particle sizes. By moving to the smaller C8 column (0.1 mm × 150 mm, 3 μm, 300Å), sensitivity, detection limit and peak capacity were all improved. At 1% formic acid concentration, the peak capacity improved to 154 and at 0.5% concentration improved to 146 (Figure 5). In addition the amount of sample loaded on the column was reduced from 0.5–1.0 μg on the capillary column (0.3 mm id) to 100–200 ng on the nanoscale column (0.1 mm id). Thus the nanoscale sensitivity was > 5 times better than that for capillary separations.
Figure 5.
Nano LC-MS chromatograms of bovine histones, 1 μL/min, C8 column, 0.1 mm × 150 mm, 3 μm, 300 Å. Data were collected on an LTQ Orbitrap XL. (A): 1% formic acid, (B): 0.5% formic acid.
Xtract deconvolution of the average FTMS spectra for each resolved LC peak was performed for all the separation conditions. The resulting histone isoform masses were then compared against bovine histone sequences with commonly observed PTMs applied and prior analyses performed with Human histones extracted from Hela Cells [7]. The masses of histones and histone PTMs were calculated by IsoPro based on known amino acid sequences and PTMs. The histone variants that we observed under each separation condition are listed in Supporting Information Table S1. The majority of histone variants/isoforms were observable under all the conditions we examined. The histone isoform corresponding in mass to H2AV was only detected with 0.1 mm column and the H2B variant PT15 was not observed with the acetic acid modifier. This analysis suggests that regardless of the peak capacity the TFA-free separations are robust at detecting a wide range of histone isoforms.
TFA-Free LC-MS Analysis Of Protein Standards
To test the general applicability of the TFA-free capillary scale separation method, an equimolar mixture of 6 protein standards was separated on the capillary C8 column (0.3 mm × 150 mm, 5 μm, 300 Å) at 5 μL/min, using a solvent system consisting of 0.5% formic acid in water (solvent A) and 0.5% formic acid in acetonitrile (solvent B), and a linear segment gradient described in the experimental section. The chromatogram is shown in Supporting Information Figure S2. By use of the Xtract deconvolution algorithm (Thermo FisherScientific, San Jose, CA), the protein standards’ molecular weights and elution order were determined. Six protein standards eluted in the following order: lysozyme (14305 Da), cytochrome C (12360 Da), ubiquitin (8560 Da), insulin (5733 Da), myoglobin (16951 Da), and carbonic anhydrase (29024 Da). The elution order correlates with the predicted increasing hydrophobicity of protein standards [25].
Application Of TFA-Free LC-MS Analysis
The previous data demonstrate that the TFA-free LC-MS method is valuable for identification of histones and characterization of histone PTMs, and could be applied to analyze protein standards in general (mass range from 5,733 Da to 29,024 Da). It is important to determine whether this method can be extended to intended application of profiling histones in “real” human cancer samples. For this purpose we studied histones extracted from B cells (one normal volunteer and seven CLL patients) and three human breast cancer cell lines. Extracted histones were separated under the optimized conditions, consisting of a capillary scale column (C8, 0.3 mm × 150 mm, 5 μm, 300 Å), 5 μL/min flow rate, mobile phase A (0.5% formic acid in water) and mobile phase B (0.5% formic acid in acetonitrile), and a linear-convex segment gradient described in the experimental section. Intact histone mass profiles were generated from acquired mass spectra using the Xtract deconvolution (Thermo FisherScientific, San Jose, CA) in Xcalibur QualBrowser software.
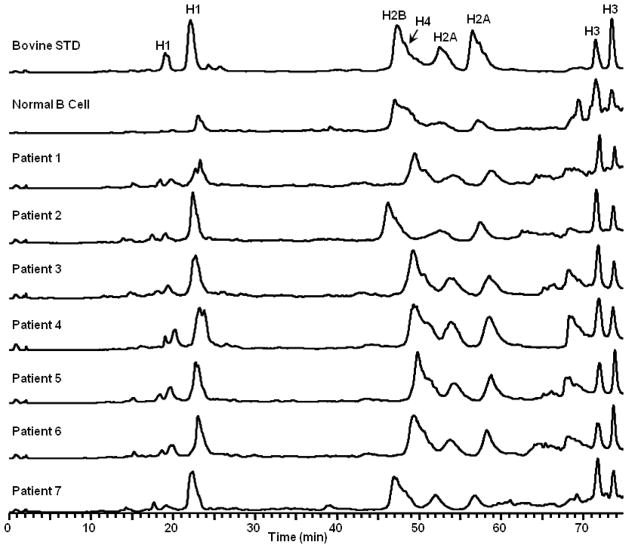
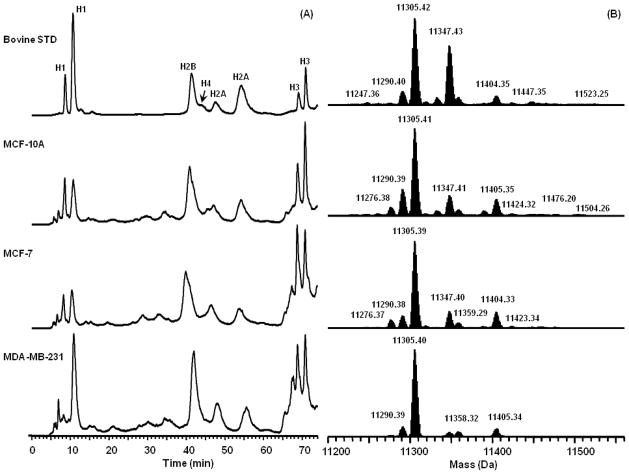
Figure 6 and 7A show the chromatograms of histones extracted from normal B cells, primary CLL patients’ B cells, and the human breast cancer cell lines. The elution order of histones for every sample is same as that of bovine histones, H1 for peak 1 and 2, H2B for peak 3, H4 for peak 4, H2A for peak 5 and 6, H3 for peak 7 and 8. Comparing the chromatograms, for the same species of histone from different patients or different breast cancer cell lines, the retention time is similar to each other, as is the resolution of adjacent peaks.
Figure 6.
Capillary LC-MS chromatograms of bovine histone standard, and histones extracted from B cells (one normal volunteer and seven CLL patients), 0.5% formic acid, 5 μL/min, C8 column, 0.3 mm × 150 mm, 5 μm, 300 Å. Data were collected on an LTQ Orbitrap XL.
Figure 7.
(A) Capillary LC-MS chromatograms of bovine histone standard, and histones extracted from three human breast cancer cell lines, 0.5% formic acid, 5 μL/min, C8 column, 0.3 mm × 150 mm, 5 μm, 300 Å. Data were collected on an LCQ DecaXP. (B) Reconstructed mass spectra of H4 from Figure 9A using the Xtract deconvolution software (Thermo FisherScientific, San Jose, CA). Data were collected on an LTQ Orbitrap XL.
To demonstrate the potential of the approach to determine changes in histone isoform distributions, the representative mass spectra of histone H4 in the bovine calf thymus and breast cancer cells are shown in Figure 7B. Note that in these deconvoluted spectra there are no adducts from TFA. Thus the assignment of isoform mass is straightforward with a higher potential for automation. H4 is unique compared to H2A, H2B and H3. Several variants of these histones are known whereas no sequence variants for H4 have been reported (Table S1). Therefore, the analysis of H4 mass spectra is not complicated by the existence of its variants and only related to its PTMs [7]. Following this logic the highly abundant peak observed at 11,305 Da is due predominantly to the dimethylation (Me2) and N-terminal acetylation (NAc) of H4 (Figure 7B). The second most abundant peak, 11,347 Da is 42 Da higher in mass and characteristic of additional acetylation upon the H4 N-terminal tail. Other minor peaks at 11,276 Da and 11,290 Da corresponded to the H4 isoforms with NAc and NAc + Me (monomethylation) respectively. This interpretation of the data is consistent with previous reports that assigned 11,305 Da to NAc + K20Me2, 11,347 Da to NAc + K16Ac + K20Me2 [26, 27]. It is important to note that with additional fractionation, middle-down and 2D LC-MS methods can detect greater numbers of isoforms [28–33]. However, the current approach is designed to maximize the amount of sample information whilst minimizing the upfront sample preparation. As such it is an excellent tool for profiling samples obtained from limited human tissues.
The data in Figure 7B demonstrate the feasibility of LC-MS profiling to reveal histone isoform differences using our approach. We observed distinct differences in the distribution of H4 isoforms between the MCF-10A/MCF-7 and MDA-MB-231 cells. These results are consistent with other observations that suggest loss of H4 (K16Ac) is associated with more aggressive tumors [34]. It has been long known that global changes in histone PTMs have prognostic significance in many different cancers [35]. For example, the reduction in H4 (K16Ac) and H4 (K20Me2) appears to be an early event that progresses throughout tumor development. Both H4 (K20Me2) and H4 (K16Ac) appear to be involved in DNA damage control and the loss of these PTMs has been considered as a near universal epigenetic marker for cancer [34]. In addition, cells with reduced H4 (K16Ac) demonstrate an increase in genomic instability that appears similar and/or linked to the gH2AX damage response, suggesting a role in facilitating mutations and chromosomal rearrangements that are a fundamental cause of cancer [36]. Taken as a whole, this work displays the potential of TFA-free separation to reveal histone patterns in human cancers.
CONCLUSION
A TFA-free histone separation method was developed, optimized using bovine histone standard and further applied to human cancer samples. Gradient program and flow rate were optimized on a capillary column and a nanoscale column respectively. Formic acid (0.1%, 0.2%, 0.4%, 0.5%, and 1%), and acetic acid (0.5% and 1%) were evaluated by comparing sensitivity, resolution, and peak capacity. Formic acid (0.5%) gave the best separation performance and quality of MS data. Capillary separations of protein standards, and histones extracted from primary CLL cells and breast cancer cells were demonstrated. TFA-free capillary and nanoscale separations bring two advantages to LC-MS analysis of proteins. Firstly, less sample is consumed and secondly, elimination of TFA adducts simplifies data analysis.
Supplementary Material
Acknowledgments
The study was funded by The Ohio State University, National Institutes of Health CA107106 and CA101956, Leukemia and Lymphoma Society, and AACR V-Foundation.
References
- 1.Henry KW, Berger SL. Trans-tail histone modifications: wedge or bridge? Nat Struct Biol. 2002;9:565–566. doi: 10.1038/nsb0802-565. [DOI] [PubMed] [Google Scholar]
- 2.Inagaki S, Nakamura K, Morikami A. A link among DNA replication, recombination, and gene expression revealed by genetic and genomic analysis of TEBICHI gene of Arabidopsis thaliana. PLoS Genet. 2009;5:e1000613. doi: 10.1371/journal.pgen.1000613. [DOI] [PMC free article] [PubMed] [Google Scholar]
- 3.Edmondson DG, Davie JK, Zhou J, Mirnikjoo B, et al. Site-specific loss of acetylation upon phosphorylation of histone H3. J Biol Chem. 2002;277:29496–29502. doi: 10.1074/jbc.M200651200. [DOI] [PubMed] [Google Scholar]
- 4.Lo WS, Trievel RC, Rojas JR, Duggan L, et al. Phosphorylation of serine 10 in histone H3 is functionally linked in vitro and in vivo to Gcn5-mediated acetylation at lysine 14. Mol Cell. 2000;5:917–926. doi: 10.1016/s1097-2765(00)80257-9. [DOI] [PubMed] [Google Scholar]
- 5.Davie JK, Edmondson DG, Coco CB, Dent SY. Tup1-Ssn6 interacts with multiple class I histone deacetylases in vivo. J Biol Chem. 2003;278:50158–50162. doi: 10.1074/jbc.M309753200. [DOI] [PubMed] [Google Scholar]
- 6.Zhang L, Freitas MA, Wickham J, Parthun MR, et al. Differential expression of histone post-translational modifications in acute myeloid and chronic lymphocytic leukemia determined by high-pressure liquid chromatography and mass spectrometry. J Am Soc Mass Spectrom. 2004;15:77–86. doi: 10.1016/j.jasms.2003.10.001. [DOI] [PubMed] [Google Scholar]
- 7.Su X, Jacob NK, Amunugama R, Lucas DM, et al. Liquid chromatography mass spectrometry profiling of histones. J Chromatogr B Analyt Technol Biomed Life Sci. 2007;850:440–454. doi: 10.1016/j.jchromb.2006.12.037. [DOI] [PMC free article] [PubMed] [Google Scholar]
- 8.Zhang K, Tang H. Analysis of core histones by liquid chromatography-mass spectrometry and peptide mapping. J Chromatogr B Analyt Technol Biomed Life Sci. 2003;783:173–179. doi: 10.1016/s1570-0232(02)00631-1. [DOI] [PubMed] [Google Scholar]
- 9.Bonenfant D, Coulot M, Towbin H, Schindler P, van Oostrum J. Characterization of histone H2A and H2B variants and their post-translational modifications by mass spectrometry. Mol Cell Proteomics. 2006;5:541–552. doi: 10.1074/mcp.M500288-MCP200. [DOI] [PubMed] [Google Scholar]
- 10.Apffel A, Fischer S, Goldberg G, Goodley PC, Kuhlmann FE. Enhanced sensitivity for peptide mapping with electrospray liquid chromatography-mass spectrometry in the presence of signal suppression due to trifluoroacetic acid-containing mobile phases. J Chromatogr A. 1995;712:177–190. doi: 10.1016/0021-9673(95)00175-m. [DOI] [PubMed] [Google Scholar]
- 11.Eshraghi J, Chowdhury SK. Factors affecting electrospray ionization of effluents containing trifluoroacetic acid for high-performance liquid chromatography/mass spectrometry. Analytical Chemistry. 1993;65:3528–3533. doi: 10.1021/ac00071a035. [DOI] [PubMed] [Google Scholar]
- 12.Duchateau ALL, Munsters BHM, Kwakkenbos GTC, Van Leuken RGJ. Selection of buffers and of an ion-pairing agent for thermospray liquid chromatographic--mass spectrometric analysis of ionic compounds. Journal of Chromatography A. 1991;552:605–612. [Google Scholar]
- 13.Clarke NJ, Crow FW, Younkin S, Naylor S. Analysis of in vivo-derived amyloid-beta polypeptides by on-line two-dimensional chromatography-mass spectrometry. Anal Biochem. 2001;298:32–39. doi: 10.1006/abio.2001.5357. [DOI] [PubMed] [Google Scholar]
- 14.Chong BE, Yan F, Lubman DM, Miller FR. Chromatofocusing nonporous reversed-phase high-performance liquid chromatography/electrospray ionization time-of-flight mass spectrometry of proteins from human breast cancer whole cell lysates: a novel two-dimensional liquid chromatography/mass spectrometry method. Rapid Commun Mass Spectrom. 2001;15:291–296. doi: 10.1002/rcm.227. [DOI] [PubMed] [Google Scholar]
- 15.Garcia MC. The effect of the mobile phase additives on sensitivity in the analysis of peptides and proteins by high-performance liquid chromatography-electrospray mass spectrometry. J Chromatogr B Analyt Technol Biomed Life Sci. 2005;825:111–123. doi: 10.1016/j.jchromb.2005.03.041. [DOI] [PubMed] [Google Scholar]
- 16.Cheson BD, Bennett JM, Grever M, Kay N, et al. National Cancer Institute-sponsored Working Group guidelines for chronic lymphocytic leukemia: revised guidelines for diagnosis and treatment. Blood. 1996;87:4990–4997. [PubMed] [Google Scholar]
- 17.Debnath J, Muthuswamy SK, Brugge JS. Morphogenesis and oncogenesis of MCF-10A mammary epithelial acini grown in three-dimensional basement membrane cultures. Methods. 2003;30:256–268. doi: 10.1016/s1046-2023(03)00032-x. [DOI] [PubMed] [Google Scholar]
- 18.Sures I, Gallwitz D. Histone-specific acetyltransferases from calf thymus. Isolation, properties, and substrate specificity of three different enzymes. Biochemistry. 1980;19:943–951. doi: 10.1021/bi00546a019. [DOI] [PubMed] [Google Scholar]
- 19.Chadee DN, Hendzel MJ, Tylipski CP, Allis CD, et al. Increased Ser-10 phosphorylation of histone H3 in mitogen-stimulated and oncogene-transformed mouse fibroblasts. J Biol Chem. 1999;274:24914–24920. doi: 10.1074/jbc.274.35.24914. [DOI] [PubMed] [Google Scholar]
- 20.Garcia MC, Hogenboom AC, Zappey H, Irth H. Effect of the mobile phase composition on the separation and detection of intact proteins by reversed-phase liquid chromatography-electrospray mass spectrometry. J Chromatogr A. 2002;957:187–199. doi: 10.1016/s0021-9673(02)00345-x. [DOI] [PubMed] [Google Scholar]
- 21.Nugent KD, Burton WG, Slattery TK, Johnson BF, Snyder LR. Separation of proteins by reversed-phase high-performance liquid chromatography. II. Optimizing sample pretreatment and mobile phase conditions. J Chromatogr. 1988;443:381–397. doi: 10.1016/s0021-9673(00)94809-x. [DOI] [PubMed] [Google Scholar]
- 22.Kastner M. Protein liquid chromatography. Elsevier; Amsterdam; New York: 2000. [Google Scholar]
- 23.McCalley DV. Effect of buffer on peak shape of peptides in reversed-phase high performance liquid chromatography. J Chromatogr A. 2004;1038:77–84. doi: 10.1016/j.chroma.2004.03.038. [DOI] [PubMed] [Google Scholar]
- 24.Su X, Lucas DM, Zhang L, Xu H, et al. Validation of an LC-MS based approach for profiling histones in chronic lymphocytic leukemia. Proteomics. 2009;9:1197–1206. doi: 10.1002/pmic.200800333. [DOI] [PMC free article] [PubMed] [Google Scholar]
- 25.Krokhin OV. Sequence-specific retention calculator. Algorithm for peptide retention prediction in ion-pair RP-HPLC: application to 300- and 100-A pore size C18 sorbents. Anal Chem. 2006;78:7785–7795. doi: 10.1021/ac060777w. [DOI] [PubMed] [Google Scholar]
- 26.Ren C, Zhang L, Freitas MA, Ghoshal K, et al. Peptide mass mapping of acetylated isoforms of histone H4 from mouse lymphosarcoma cells treated with histone deacetylase (HDACs) inhibitors. J Am Soc Mass Spectrom. 2005;16:1641–1653. doi: 10.1016/j.jasms.2005.06.001. [DOI] [PMC free article] [PubMed] [Google Scholar]
- 27.Zhang K, Williams KE, Huang L, Yau P, et al. Histone acetylation and deacetylation: identification of acetylation and methylation sites of HeLa histone H4 by mass spectrometry. Mol Cell Proteomics. 2002;1:500–508. doi: 10.1074/mcp.m200031-mcp200. [DOI] [PubMed] [Google Scholar]
- 28.Garcia BA. Mass spectrometric analysis of histone variants and post-translational modifications. Front Biosci (Schol Ed) 2009;1:142–153. doi: 10.2741/S14. [DOI] [PubMed] [Google Scholar]
- 29.Zee BM, Levin RS, Dimaggio PA, Garcia BA. Global turnover of histone post-translational modifications and variants in human cells. Epigenetics Chromatin. 3:22. doi: 10.1186/1756-8935-3-22. [DOI] [PMC free article] [PubMed] [Google Scholar]
- 30.Phanstiel D, Brumbaugh J, Berggren WT, Conard K, et al. Mass spectrometry identifies and quantifies 74 unique histone H4 isoforms in differentiating human embryonic stem cells. Proc Natl Acad Sci U S A. 2008;105:4093–4098. doi: 10.1073/pnas.0710515105. [DOI] [PMC free article] [PubMed] [Google Scholar]
- 31.Shechter D, Nicklay JJ, Chitta RK, Shabanowitz J, et al. Analysis of histones in Xenopus laevis. I. A distinct index of enriched variants and modifications exists in each cell type and is remodeled during developmental transitions. J Biol Chem. 2009;284:1064–1074. doi: 10.1074/jbc.M807273200. [DOI] [PMC free article] [PubMed] [Google Scholar]
- 32.Nicklay JJ, Shechter D, Chitta RK, Garcia BA, et al. Analysis of histones in Xenopus laevis. II. mass spectrometry reveals an index of cell type-specific modifications on H3 and H4. J Biol Chem. 2009;284:1075–1085. doi: 10.1074/jbc.M807274200. [DOI] [PMC free article] [PubMed] [Google Scholar]
- 33.Su X, Jacob NK, Amunugama R, Hsu PH, et al. Enrichment and characterization of histones by two-dimensional hydroxyapatite/reversed-phase liquid chromatography-mass spectrometry. Anal Biochem. 2009;388:47–55. doi: 10.1016/j.ab.2009.01.033. [DOI] [PMC free article] [PubMed] [Google Scholar]
- 34.Fraga MF, Ballestar E, Villar-Garea A, Boix-Chornet M, et al. Loss of acetylation at Lys16 and trimethylation at Lys20 of histone H4 is a common hallmark of human cancer. Nat Genet. 2005;37:391–400. doi: 10.1038/ng1531. [DOI] [PubMed] [Google Scholar]
- 35.Lennartsson A, Ekwall K. Histone modification patterns and epigenetic codes. Biochim Biophys Acta. 2009 doi: 10.1016/j.bbagen.2008.12.006. [DOI] [PubMed] [Google Scholar]
- 36.Gupta A, Guerin-Peyrou TG, Sharma GG, Park C, et al. The mammalian ortholog of Drosophila MOF that acetylates histone H4 lysine 16 is essential for embryogenesis and oncogenesis. Mol Cell Biol. 2008;28:397–409. doi: 10.1128/MCB.01045-07. [DOI] [PMC free article] [PubMed] [Google Scholar]
Associated Data
This section collects any data citations, data availability statements, or supplementary materials included in this article.


