

Summary
The discovery and engineering of novel fluorescent proteins (FPs) from diverse organisms is yielding fluorophores with exceptional characteristics for live-cell imaging. In particular, the development of FPs for fluorescence (or Förster) resonance energy transfer (FRET) microscopy is providing important tools for monitoring dynamic protein interactions inside living cells. The increased interest in FRET microscopy has driven the development of many different methods to measure FRET. However, the interpretation of FRET measurements is complicated by several factors including the high fluorescence background, the potential for photoconversion artifacts, and the relatively low dynamic range afforded by this technique. Here, we describe the advantages and disadvantages of four methods commonly used in FRET microscopy. We then discuss the selection of FPs for the different FRET methods, identifying the most useful FP candidates for FRET microscopy. The recent success in expanding the FP color palette offers the opportunity to explore new FRET pairs.
Keywords: fluorescent protein, fluorescence resonance energy transfer (FRET), fluorescence lifetime imaging microscopy (FLIM), acceptor photobleaching, spectral imaging
Introduction
The cloning of the green fluorescent protein (GFP) from the jellyfish Aequorea victoria [1] allowed, for the first time, genetically encoded fluorescence labeling inside living cells and organisms. With the demonstration that GFP still fluoresced when produced in other organisms [2], many investigators recognized the astonishing potential of this unique molecule as a tool for studies in cell biology, medicine, and physiology. From the outset, the fundamental goal of research efforts was to develop the genetically encoded FPs into noninvasive reporters of biological events. For example, Roger Tsien was particularly interested in developing a genetically encoded sensor for cyclic AMP (cAMP)-mediated activities. An early 1990's collaboration with Susan Tayor had led to the development of a sensor of cAMP activation that exploited fluorescence (or Förster) resonance energy transfer (FRET) between organic dyes labeling the catalytic and regulatory subunits of its cellular binding protein, the cAMP-dependent protein kinase A (PKA) [3]. The technical challenges and limitations of the covalent labeling and cellular injection approach, however, drove Roger Tsien to look to the genetically encoded Aequorea GFP as an alternative to the organic dyes [4].
The use of GFP to develop probes for FRET-based assays, however, would require significant improvements in its characteristics, as well as the generation of new colors. Thus, many laboratories embarked on mutagenesis studies to “fine-tune” the spectral characteristics of Aequorea GFP. In the years since the cloning of Aequorea GFP, it has been engineered to yield new FPs emitting light from the blue to yellowish-green range of the visible spectrum [5–9]. Additionally, in the late 1990's many other marine organisms were identified that produce proteins with amino acid similarity to the Aequorea GFP, sharing the same 11-strand β-barrel fold with a central α-helical segment containing a chromophore [10–13]. Some of these GFP-like proteins have been cloned and engineered for live-cell imaging applications, extending the fluorescence palette into the deep red spectrum [14–16; reviewed in 17]. The ability to produce proteins of interest that are labeled with FPs of different colors inside living cells and organisms has revolutionized studies of cell biology. These new FPs expand the repertoire of applications from multi-color imaging of protein co-localization and behavior inside living cells, to the detection of changes in intracellular activities. It is their use in live-cell FRET microscopy, however, that has generated the most interest [5, 18–21].
Here, we review the fundamentals of FRET microscopy. We then discuss the various methods that have proven to be reliable for measuring protein interactions by FRET microscopy, highlighting the advantages and limitations of each method. Finally, we discuss the most useful FP candidates for FRET microscopy.
FRET microscopy: How it works
FRET is a process by which excited-state energy is transferred directly from one fluorophore (the “donor”) to other nearby molecules (the “acceptors”) through near-field electromagnetic dipole interactions (Fig. 1A). There are three basic requirements for the efficient transfer of energy from the donor fluorophore to the acceptor [22–24]. The requirements for efficient energy transfer, described in Box 1, are that the donor and acceptor probes must be in close proximity, they must have a favorable dipole-dipole alignment, and they must share significant spectral overlap. When these basic requirements for energy transfer are met, the quantification of FRET signals in microscopic images can provide Ångstrom-scale measurements of the spatial relationship between the fluorophores labeling proteins inside living cells.
Figure 1.

A: Cartoon illustrating FRET between green and red FPs fused to interacting DNA-binding proteins. Energy transfer can only occur when the FPs are positioned close to one another by the interactions of the proteins they are fused to. The excitation of the green FP donor (cyan arrow) drives it to the excited-state, and that energy can be transferred directly to the nearby red FP acceptor by FRET. This results in quenching of the donor emission (green arrow) and sensitized emission (orange arrow) from the acceptor. B: The distance dependence for efficient FRET. The Förster equation (Box 1) was used to determine the change in FRET efficiency (EFRET) as a function of the separation distance between the FPs. The shaded region shows the range of 0.5 R0 to 1.5 R0 over which FRET can be accurately measured. C: The excitation and emission spectra for the Cerulean (donor) and Venus (acceptor) showing the spectral overlap between the donor emission and acceptor excitation (shaded region). The dashed boxes indicate the donor and FRET detection channels, the arrow indicates the direct acceptor excitation at the donor excitation wavelength, and the hatching shows donor SBT into the acceptor channel.
The favorable characteristics of the FPs for FRET-based microscopy led to a dramatic increase in the use of this technique [26]. The increased interest in this approach has also driven the development of many different methods to measure FRET [27,28]. The most frequently used approaches are broadly classified into four distinct categories: spectral bleedthrough correction, spectral imaging, acceptor photobleaching, and time-resolved fluorescence. Each of these methods has distinct advantages and disadvantages, and as with any highly technical approach, the interpretation of the experimental results can be problematic [29]. Therefore, often more than one technique is required to definitively demonstrate protein interactions using FRET microscopy.
Spectral bleed-through correction: Methods to remove acceptor/donor crosstalk
When energy is transferred from the excited-state donor to nearby acceptor molecules, the donor emission is quenched, and there is sensitized emission from the acceptors (Fig. 1A). The most common methods used to detect FRET involve the measurement of the sensitized emission from the acceptor. The basic approach is to optimally excite the donor fluorophore population and then measure emission in the acceptor or FRET channel (see Fig. 1C). The signal in the acceptor channel contains the sensitized emission resulting from FRET, but it also contains the fluorescence crosstalk from the donor and acceptor fluorophores. This background signal, called spectral bleed-through (SBT), results from the direct excitation of the acceptor by the donor excitation wavelengths (arrow, Fig. 1C), as well as the donor emission signal that is detected in the acceptor emission channel (hatching, Fig. 1C). The accurate measurement of FRET signals requires correction methods that define and remove these different SBT components [28,30].
The strength of this approach is that many computer algorithms have been developed to define and remove the SBT background, allowing the accurate quantification of FRET signals. These algorithms are often included with the analysis software provided by microscope companies. With careful selection of excitation sources, filters, and dichroic mirrors, the SBT correction method is compatible with most imaging approaches. It can be challenging, however, to combine SBT correction methods with two-photon excitation (2PE) microscopy because of the broad two-photon absorption spectra for the FPs [31]. Fortunately, some of the new orange and red FPs have 2PE absorption minima that overlap with the 2PE absorption of some of the blue or green donor FPs. Importantly, the longer wavelength excitation used by 2PE microscopy has low tissue absorption while generating minimal autofluorescence, allowing deep tissue imaging [31]. The primary weakness of the SBT correction approach is that it relies on measurements from separate control samples containing only the donor or acceptor FPs to estimate the SBT components. Therefore, the method is very sensitive to the quality of data obtained from the control samples [30].
Spectral imaging methods
Spectral imaging microscopy acquires spatial (x,y) images sampled over a broad range of emission wavelengths, generating what is termed a “lambda” (λ) stack [32,33]. The resulting λ stack allows the analysis of spectral characteristics of the fluorescence signal at each spatial pixel location in the image. The spectral imaging methods can be ideal for measuring FRET in living specimens. The specimen is illuminated at the donor excitation wavelength, and the combined emission signals from both donors and acceptors are collected across the spectral range. The emission signal from the donor can be removed by linear unmixing, using a reference spectrum obtained from specimens producing only the donor fluorophore. The SBT signal resulting from direct excitation of the acceptor, however, has the same spectral characteristics as the sensitized acceptor emission resulting from FRET. Here, the SBT correction methods (described above) can be applied, allowing the pixel-by-pixel removal of the acceptor SBT signal. Computer algorithms have been developed for the spectral FRET approach [34].
The strength of spectral imaging FRET is that it allows both the quenched donor signal and the sensitized acceptor emission to be measured simultaneously (Fig. 2A). Thus, the FRET signal from the acceptor is instantly confirmed by observing the quenching of the donor signal. Furthermore, the acquisition of the λ stacks for spectral measurements can be rapid (seconds), so dynamic changes in FRET signals can be monitored over relatively short time frames. The weakness of the approach is that, like the SBT correction methods, it relies on measurements from separate control cells that produce the acceptor alone to obtain accurate corrections to quantify FRET.
Figure 2.

Spectral imaging of a cell producing the mTFP1-5aa-Venus fusion protein. A: The cell was illuminated at the donor excitation wavelength and spectral measurements were acquired from the ROI indicated by the red box; the calibration bar indicates 10 μm. The linked Venus fluorophore was then photobleached using the 514 nm laser line in the ROI indicated by the yellow box. This resulted in more than a 70% decrease in the Venus signal. B: The spectral measurements were then reacquired under identical conditions to the first from the same ROI (red box), and changes in the donor signal were measured. The dashed line indicates the gray level intensity of the donor signal before A) and after B) acceptor photobleaching [with permission from 59].
Methods that detect donor quenching: Acceptor photobleaching or photoactivation
A hallmark of energy transfer is the quenching of the donor emission signal (Fig. 1A). Methods that detect the quenched state of the donor require measurements only from the donor channel, and are not generally affected by SBT artifacts (see Fig. 1C). Ideally, the measurement of the intensity of the same donor fluorophore population in the absence (ID) and in the presence (IDA) of acceptor molecules can directly yield the energy transfer efficiency:
In principle, the measurement of these two populations of donor fluorophores can be achieved using acceptor photobleaching (pb) FRET microscopy [35–37]. The pbFRET approach first measures the quenched donor population (IDA) in a specimen. The acceptor fluorophores are then intentionally photobleached, removing them from the FRET process. This results in the dequenching of the donor molecules involved in FRET, leading to increased fluorescence emission from the donors (compare Figs 2A,B).
The strength of the pbFRET approach is that the same specimen is used to determine the quenched and dequenched donor signals, so the technique can be very accurate. Furthermore, the approach can reveal regional differences in the dequenched donor signal within individual cells, corresponding to areas with varying FRET efficiency. The weakness of the approach, however, is that it usually takes a significant amount of time to photobleach the acceptor fluorophores and changes in protein localization can occur over relatively short periods, leading to temporal artifacts in the pbFRET image. In addition, some fluorophores are known to photoconvert to other spectral forms during photobleaching, which can lead to an overestimation of the donor dequenching [38]. Finally, since photobleaching of the acceptor fluorophore is irreversible, the pbFRET approach is an end-point assay that is not amenable to dynamic measurements. Importantly, pbFRET does provide a method to verify FRET measurements made using other techniques (Fig. 2B).
A different approach takes advantage of the photoactivatable GFP (PA-GFP) as a FRET acceptor. PA-GFP can be switched from a dark state to a bright fluorescent state by brief, intense illumination at 405 nm [39]. The photoquenching (PQ) FRET technique uses PA-GFP as the FRET acceptor for a CFP. In the dark state PA-GFP cannot act as a FRET acceptor, so the CFP fluorophores are not quenched. Upon photoactivation PA-GFP becomes available for energy transfer and the local population of CFP can be quenched if the fluorophores labeling the proteins are in close proximity. The strength of this method is that the dynamics of the quenching can be monitored over time, as can the diffusion of the activated acceptor fluorophores. Thus, the PQFRET assay can provide direct measurements of protein mobility, and interactions in living cells [40]. The weakness of PQFRET is that it is necessary to achieve a large excess of the PA-GFP-labeled protein, and the method is very sensitive to the efficiency of the photoactivation process.
An alternative method: Time-resolved measurements
An alternative method that also measures the quenching of the donor by the acceptor involves detecting changes in the donor fluorescence lifetime [41]. The fluorescence lifetime is the average time a molecule spends in the excited-state before returning to the ground state, typically accompanied by the emission of a photon (the fluorescence pathway, kf; see Fig. 3). The fluorescence lifetime is an intrinsic property of a fluorophore, and most probes used in biological studies have lifetimes ranging between about one to about ten nanoseconds (ns). Importantly, processes that affect the excited-state, such as non-fluorescence quenching pathways (knf), change the fluorescence lifetime (Fig. 3). The fluorescence lifetime (τ) is related to the rate of the fluorescence and non-fluorescence pathways:
Thus, the lifetime carries information about events in the local microenvironment of the probe that affect the excited-state photophysical processes.
Figure 3.
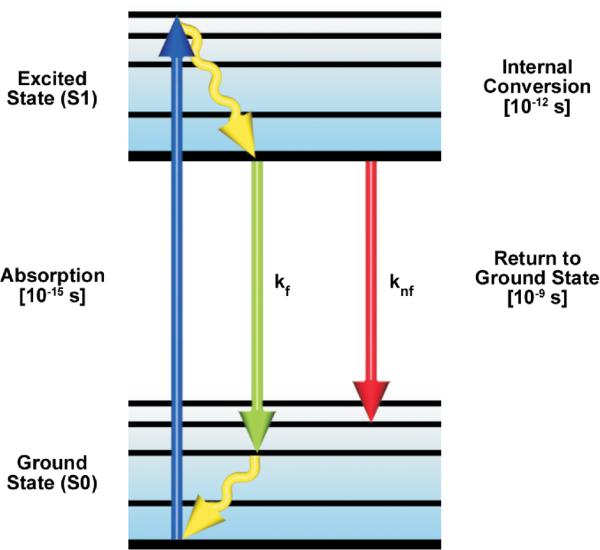
A simplified Perrin-Jablonski energy level diagram for a fluorescent molecule. The arrows represent absorption of excitation photon energy causing the transition from the lowest vibrational levels of the ground state (S0) to the excited state (S1). Thermal energy is lost by internal conversion and the transition from the excited state to the ground state is always from the lowest level of S1. The de-excitation transitions can occur by the emissive (kf) pathway or by other competing non-emissive (knf) pathways.
Because energy transfer is a quenching process that depopulates the excited state of the donor fluorophore, the donor fluorescence lifetime is shortened by FRET. Fluorescence Lifetime Imaging Microscopy (FLIM) maps the spatial distribution of fluorescent probe lifetimes inside living cells, and can accurately measure the shorter donor lifetimes that result from FRET [41–44]. Since these are measurements of time, they are independent of variations in the probe concentration, excitation intensity, and other factors that typically limit steady-state intensity-based measurements.
FLIM: How it works
The first measurements of the nanosecond decay of fluorescence using optical microscopy were conducted in 1959 [45]. The FLIM methodologies have evolved significantly in recent years, and now encompass biological, biomedical, and clinical research applications [41]. FLIM techniques are broadly subdivided into the time domain (TD) and the frequency domain (FD) methods. The physics underlying these two different approaches is identical - only the analysis of the measurements differs [46].
The TD method uses a pulsed-light source to excite the specimen. For probes with nanosecond lifetimes, femtosecond-to-picosecond pulse durations are used (Fig. 4A). A high-speed detector is synchronized to the excitation source and is opened at varying times relative to the pulse. The emission photons from the specimen are accumulated at the different time points, and are used to generate the fluorescence decay profile, providing an estimate of the fluorescence lifetime. In contrast, the FD method uses a light source that is modulated at high radio frequencies to excite the fluorophores (Fig. 4B). The fundamental modulation frequency is chosen depending on the lifetime of the fluorophores and is usually between 20–140 megahertz for the measurement of nanosecond decays. The emission signal from the specimen is then analyzed for changes in phase and amplitude relative to the excitation source, and these are used to extract the fluorescence lifetime of the fluorophore.
Figure 4.

The Time Domain (TD) and Frequency-domain (FD) FLIM Methods.
A: TD FLIM requires a pulsed excitation source with a femtosecond pulse width. The pulsed laser is coupled to the scanning system of the microscope. The photons emitted from the sample are recorded by a fast detector, which is connected to a time-correlated single photon counting (TCSPC) device. The TCSPC records the arrival time each photon relative to the excitation pulse, and a `photon counts' histogram is built for each pixel of an image. The fluorescence lifetime, determined as the time require for the fluorescence to decay to 37% of its initial intensity, is estimated by fitting the corresponding decay data with either single- or multi-exponential models. B: The excitation source for the FD FLIM system is a diode laser that is modulated at high radio frequencies. The emission signals from the specimen are routed to the detector, and the phase delays (Φ) and modulation ratio (M = AC/DC) of the emission (Em) relative to the excitation (Ex) are used to estimate the fluorescence lifetime.
The strength of FLIM for detecting FRET is that measurements are made in the donor channel, and are usually not affected by SBT background signals, although care in selecting the donor channel emission bandwidth is necessary to avoid the detection of acceptor emission (see Fig. 1C). Since the fluorescence lifetime of a fluorophore is sensitive to its environment, FLIM can be a good choice for visualizing signal changes from probes that report pH, ion concentration, or post-translational modifications. However, because the fluorescence lifetime is sensitive to probe environment, the fluorescence lifetime may change unpredictably for probes in fixed specimens, so FLIM is usually limited to live specimens.
It is critical to identify the sources of noise in FRET-FLIM measurements to determine the reliability of the data analysis. For instance, a donor fluorophore whose intrinsic lifetime has multiple components may not be suitable for FLIM-FRET, since it will complicate the data analysis. Although the analysis of FLIM data has become routine with the advanced software that is available, an understanding of the physics that underlies the changes in fluorescence lifetime is necessary for processing the FLIM data and interpreting the results. Finally, the acquisition of FRET-FLIM data is typically slow compared to the other techniques described above. For example, acquiring sufficient photon counts to assign lifetimes using the FD method may require 30 seconds or more, which limits its application for monitoring dynamic events. As the technology improves, it is expected that the FLIM data acquisition time will decrease [47].
FPs for FRET imaging: Optimized FPs from Aequorea
Nearly all the FPs discovered to date show a strong tendency to self-associate into dimers, tetramers, or oligomers [48]. This tendency to self-associate, although weak, was also observed for the Aequorea FPs, and a dimer interface was identified in the crystal structure of GFP [49]. Critically, the replacement of the hydrophobic residues in the dimer interface of the Aequorea FPs with positively charged residues eliminates the dimer formation without changing the spectral characteristics [50,51]. The most effective mutation to disrupt the dimer interface in the Aequorea proteins is the A206K substitution, where the hydrophilic lysine residue replaces the non-polar amino acid alanine. The addition of the “monomerizing” (m) A206K mutation to any of the Aequorea FPs used in FRET-based studies is highly recommended, since it overcomes possible artifacts resulting from the interactions between the probes themselves.
There are optimized FPs derived from the Aequorea GFP that are most often used for FRET-based imaging applications. Many early FRET studies relied on the Aequorea GFP derived blue FP (BFP), used in combination with GFP derivatives [5]. Recent mutagenesis strategies have yielded new BFP variants with much higher quantum yields and improved photostabilities. The EBFP2 variant (see Table 1) is currently the brightest and most stable of the blue FPs, and has been shown to be an excellent donor for FRET studies [9]. The problem of near-UV excitation of the BFPs can be overcome using 2PE microscopy. The cyan color variant, mCerulean CFP [8], used in combination with either the mVenus [7], or mCitrine [52] YFP variants are among the most popular FRET pairings. The mCerulean was recently engineered further to improve its brightness and photostability, yielding variants named mTurquoise [53] and mCerulean3 [54] (Table 1). These variants show monoexponential decay kinetics, making them improved donors for FLIM-FRET studies [54,55].
Table 1.
The properties of selected FPs and their use as probes for FRET microscopy. The peak excitation (Ex) and emission (Em) wavelengths, molar extinction coefficient (EC), quantum yield (QY), and relative brightness are listed.
| Protein (Acronym) | Ex (nm) | Em (nm) | EC × 10−3 M−1 cm−1 | QY | Relative Brightness (% of EGFP)a | Use as FRET probe | Reference |
|---|---|---|---|---|---|---|---|
| Aequorea-based FPs | |||||||
| EBFP2 | 383 | 448 | 32.0 | 0.56 | 53 | Donor to GFP/YFP | 9 |
| mCerulean3 | 433 | 475 | 40.0 | 0.87 | 103 | Donor to YFP | 54 |
| mTurquoise | 435 | 477 | 35.0 | 0.51 | 53 | Donor to YFP | 53 |
| EGFP | 488 | 507 | 56.0 | 0.60 | 100 | Donor to OFP, RFP | 5 |
| mVenus | 515 | 528 | 92.2 | 0.57 | 156 | Acceptor for CFP, Donor to RFP | 7 |
| mCitrine | 516 | 529 | 77.0 | 0.76 | 174 | Acceptor for CFP | 52 |
| T-Sapphire | 399 | 511 | 44.0 | 0.60 | 79 | Long Stokes shift donor | 56 |
| mAmetrine | 406 | 526 | 45.0 | 0.58 | 78 | Long Stokes shift donor | 57 |
| REACh | 515 | 528 | 92.2 | 0.04 | 1 | Strong absorber, weak emitter Acceptor for FLIM studies | 79,80 |
| Coral FPs | |||||||
| Midoriishi Cyan | 472 | 495 | 27.3 | 0.90 | 73 | Donor to mKO | 15 |
| mTFP1 | 462 | 492 | 64.0 | 0.85 | 162 | Donor to YFP, OFP, RFP | 58 |
| Kusabira Orange2 | 551 | 565 | 63.8 | 0.62 | 118 | Acceptor for CFP | 73 |
| mCherry | 587 | 610 | 72.0 | 0.22 | 47 | Acceptor for GFP | 67 |
| TagRFP-T | 555 | 584 | 81.0 | 0.41 | 99 | Acceptor for GFP | 72 |
| mRuby | 558 | 605 | 112.0 | 0.35 | 117 | Acceptor for GFP | 78 |
EC × QY/EGFP
The mutagenesis of Aequorea GFP also yielded FPs with an exceptionally large Stokes shift, which refers to the separation between the peak excitation and peak emission wavelengths. For example, the Sapphire variant of GFP resulted from the substitution of the isoleucine for threonine at the β-barrel position 203 (T203I), producing a protein with a single absorption peak at 399 nm [5, 56]. A similar long Stokes shift variant of Aequorea GFP, named mAmetrine [57], was developed using directed evolution to select a bright yellow fluorescing protein that retained the violet excitation. These FPs with large Stokes shift can be useful for FRET studies, since it allows the selection of FRET pairs with decreased SBT (described above). Importantly, because of their violet excitation and long Stokes shift, it is possible use these FPs in FRET-based assays that include other fluorescent markers [57].
The cyan and green FPs from corals
Many of the new GFP-like proteins discovered in corals share significant spectral overlap, providing the opportunity to develop new FRET probes. However, it is important to emphasize that the choice of the best FP pairs for FRET-based studies is often not obvious from their spectral and photophysical characteristics alone [44]. With regard to their use as FRET probes, there are shortcomings to many recently developed coral FPs, and only a few of the coral FPs have proven useful for this application.
A cyan FP was isolated from an Acropara stony coral species [15] that is called Midoriishi Cyan (abbreviated MiCy). Unlike the Aequorea ECFP variant, which has a tryptophan residue in the second position of the chromophore (T66W), MiCy contains a tyrosine residue in that position, which is typical of the GFPs. This attribute shifts the absorption and emission spectra towards the green (longer wavelengths), and MiCy FP is the most green-shifted of the cyan spectral class (Table 1). MiCy was proven to be useful as the donor in a novel FRET combination with the monomeric Kusabira Orange FP (described below). Moreover, MiCy has a single exponential decay with an average lifetime of 3.4 ns, making it a potentially useful probe for FRET measurements by FLIM. On the downside, MiCy is much dimmer and less photostable than Kusabira Orange.
Another useful cyan-colored FP was isolated from the coral Clavularia, and engineered by directed evolution to generate a monomeric teal-colored FP, called mTFP1, with remarkable brightness [58]. Similar to MiCy, mTFP1 also has a tyrosine residue at the central chromophore position, shifting both the excitation and emission spectra to the more green wavelengths when compared to CFP (Table 1). mTFP1 has a high intrinsic brightness, similar to the brightest of the Aequorea FPs, and displays a relatively narrow emission spectrum that strongly overlaps the excitation spectrum of the yellow and orange FPs. mTFP1 is an excellent donor fluorophore for FRET studies using the Venus YFP, and its single component lifetime decay (2.8 ns) makes it a useful probe for FRET measurements by FLIM [see 59,60].
The orange and red FPs from corals
The cloning and engineering of orange (OFP) and red FPs (RFP) provide the opportunity for the development of new FRET probe combinations with spectral profiles in the longer visible and near-infrared wavelength regions. This is important since there is reduced autofluorescence background from cells and tissues illuminated at wavelengths exceeding 550 nm. Moreover, living specimens are more tolerant of illumination with longer wavelength light, allowing imaging for extended time periods [61].
The first widely available coral FP was isolated from the mushroom anemone Discosoma striata [62]. The so-called DsRed FP has a peak absorbance at 558 nm, and a maximum emission at 583 nm, providing the first FP emitting in the orange-red spectral region. In its original form, DsRed is not well suited for live cell imaging applications because it matures slowly into an obligate tetramer, generating a green intermediate as it develops [63]. These problems were overcome using both random and site-directed mutagenesis strategies [64], leading to the development of the first monomeric RFP, mRFP1 [65]. Continued directed evolution of mRFP1 has yielded a variety of FPs with interesting characteristics, including the mCherry - a rapid maturing and bright monomeric RFP (Table 1) [66–68]. Because they share an excellent spectral overlap, EGFP and mCherry have been used for FRET-based imaging studies [69–71].
The directed evolution of mRFP1 also yielded several new orange FPs [67,68]. Because of their significant spectral overlap with both the commonly used cyan and green FPs, as well as the red FPs, the orange FPs provide potential alternative fluorophores for FRET studies. A monomeric orange FP was also isolated in the directed evolution screens of mRFP1 [67], and further directed evolution to improve photostability resulted in mOrange2 [72]. However, the mOrange proteins exhibit a strong tendency for photoconversion to deep red-emitting proteins, and this greatly limits their utility for FRET-based measurements [38].
Another orange FP was isolated from the mushroom coral Fungia concinna, and was engineered into a monomer named Kusabira orange (mKO) [15]. The mKO FP is a bright, photostable variant that has proven useful for FRET assays (see Table 1). A fast-folding version containing eight additional mutations, named mKO2, has improved characteristics for live cell imaging [73]. Under laser excitation, mKO FP is much less susceptible to photoconversion than the mOrange variants [38]. As was mentioned above, mKO was developed as a FRET acceptor for MiCy [15], but has also proved useful in FRET imaging studies with other donor probes [74,75].
Several bright RFPs have also been developed that will potentially allow the generation of FRET probes with long-wavelength spectral characteristics. For instance, TagRFP was engineered from a protein isolated from the sea anemone Entacmaea quadricolor [76], and is among the brightest of the monomeric RFPs currently available. Directed evolution was used to select for more photostable variants of TagRFP, and a single mutation (S158T) was identified that increases the photostability almost 10-fold [72]. The resulting FP, named TagRFP-T, has spectral properties similar to the parent and is among the most photostable of the FPs yet discovered (Table 1). TagRFP has been successfully used as an acceptor for FRET studies [77].
Another potentially useful RFP, also isolated from Entacmaea quadricolor, was engineered to a bright, monomeric RFP named mRuby. The mRuby FP variant contains 29 mutations relative to the parent, and is one of the brightest monomeric red FPs yet developed (Table 1). The spectral characteristics of mRuby are similar to mCherry, although it is less photostable than mCherry [17,78]. mRuby has proven to be an effective fusion partner for many different cellular proteins.
Fluorophore pairs for FRET-FLIM
Sensitized acceptor emission measurements (SBT correction and spectral FRET, described above) are best suited for fluorophores with a high quantum yield, and most of the red FPs have relatively low intrinsic brightness (Table 1). Importantly, the acceptor quantum yield is irrelevant when FLIM is used to detect the lifetime of the donor. Indeed, for FLIM, an acceptor probe with optimal spectral overlap and high extinction coefficient, but low quantum yield, will decrease the possibility of acceptor back-bleedthrough that would be detected in the donor channel. In this regard some FPs that have not been particularly useful for intensity-based FRET measurements have turned out to be most useful for FRET-FLIM studies.
The donor fluorophore used for FRET-FLIM should have mono-exponential decay kinetics to allow unambiguous assignment of the quenched donor lifetime. In this regard, the complex decay kinetics of the original cyan FP, ECFP, is problematic for lifetime analysis [69,70]. The newer cyan and teal FPs (mCerulean3, mTurquoise, mTFP1, described above) have predominately monoexponential fluorescence decay, and are the preferred donors in this spectral class (Table 1).
The Aequorea GFP also has advantages as a donor fluorophore in FRET-FLIM studies. The enhanced GFP (EGFP) has a higher intrinsic brightness than most of the improved Cerulean variants (Table 1), and its emission decay is monoexponential [69,70]. Furthermore, the spectral overlap with the RFPs, including mCherry and TagRFP (Table 1), makes EGFP most useful for FRET-FLIM studies [69,70,76,77]. However, increasing the spectral overlap even more could potentially improve the detection of FRET by measurement of the donor lifetime.
Recently, novel YFPs have been developed that have a high absorbance coefficient, but have extremely low quantum yield. This class of chromophore, called resonance energy-accepting chromoproteins (REACh; see Table 1), permits the optimal use of GFP as a donor for FRET-FLIM [79,80]. Their very low quantum yield overcomes the problem of acceptor back-bleedthrough emission into the donor channel. This allows the use of filters with a wider donor spectral window to collect optimally the donor signal. The measurement of a quenched fluorescence lifetime for EGFP in the presence of proteins tagged with REACh probes will reflect the population of interacting proteins [79]. What is more, the absence of fluorescence from REACh probes means that the spectral window normally occupied by the acceptor is available for the detection of another probe. This opens the possibility of correlating the protein-protein interactions detected by FRET with the behavior of another labeled protein expressed inside the same living cells [79,80].
Conclusions
The favorable spectral characteristics of the genetically encoded FPs have led to a dramatic increase in the use of FRET-based microscopy as a tool for the investigation of cellular biochemical networks. The quantification of FRET signals using the spectral bleedthrough correction and acceptor photobleaching methods described here can be achieved using most fluorescence microscope systems, whereas spectral imaging and FLIM require more specialized equipment. Here, we have described advantages and disadvantages of each of the FRET microscopy methods, underscoring why the interpretation of FRET measurements requires caution [29].
The choice of the best FP pairs for FRET-based studies is not always obvious from the comparison of their spectral and photophysical characteristics [44]. Of the many genetically encoded FPs currently available, the cyan and yellow variants remain among the best candidates for high-resolution imaging of FRET in live cells. Several bright, photostable orange and red FPs have recently become available that will potentially allow the development of FRET probes with long-wavelength spectral characteristics. Although the low intrinsic brightness of the RFPs has limited their use for sensitized acceptor emission measurements, they have proven useful for FLIM-FRET measurements.
One area for which the improvement of FPs for FRET is especially important is the evolution of highly sensitive biosensor probes. The biosensor probes incorporate a biologically active linker peptide to separate the donor and acceptor fluorophores. The post-translational modification of the linker, or the binding of a substrate, can induce a change in the linker conformation, changing the spatial relationship of the donor and acceptor FPs [81]. This results in a change in the FRET signal that can be measured using the methods described here. The development of biosensors with the new FPs is yielding probes that can be used in different spectral windows, such as the pairing of Ametrine with orange or red FPs [57]. Improved FRET-based biosensors have tremendous potential for the development of rapid large-scale screening assays for the discovery of novel pharmaceuticals and the development of therapeutic strategies [82].
Box 1 The requirements for FRET.
Separation distance
since energy transfer involves electromagnetic dipolar interactions, the efficiency of energy transfer (EFRET) varies as the inverse of the sixth power of the distance that separates the fluorophores. This is described by the Förster equation:
where R0 is the Förster distance, the separation distance between donor and acceptor at which the efficiency of energy transfer is 50%. Because of the sixth power relationship, the FRET efficiency decreases sharply with increasing separation distances (shaded area, Fig. 1B), and is limited to distances of less than 1.8 times R0, or approximately 100Å.
Angular dependence
the efficient transfer of energy requires a favorable alignment of the electromagnetic dipoles of the donor emission and acceptor absorption. The angular dependence of the dipole interaction is described by the orientation factor, κ2. Depending on the relative orientation of the donor and acceptor dipoles the value for κ2 can range from 0 to 4 [25]. It is difficult, however, to determine κ2 in most experimental systems. Fortunately, for many biological applications, where proteins labeled with the donor and acceptor fluorophores freely diffuse within cellular compartments and adopt a variety of conformations, the orientations of the FP tags randomize over the time-scales of the measurements. Under these conditions, κ2 is often assumed to be two-thirds (2/3), which reflects the random orientations of the probes.
Spectral overlap
the fluorophores must share a strong overlap between the donor emission spectrum and the absorption spectrum of the acceptor. The cyan (CFP) and yellow (YFP) FPs are most often used for FRET-based imaging studies because they share a significant spectral overlap (shaded area, Fig. 1C). However, the significant spectral overlap, which is necessary for FRET, also generates background fluorescence that is detected in the acceptor emission (FRET) channel. This results from the direct excitation of the acceptor by the donor excitation wavelengths (arrow, Fig. 1C), and the donor emission signal that bleeds into the FRET detection channel (hatching, Fig. 1C).
Acknowledgments
The authors thank Drs. Yuansheng Sun, Ammasi Periasamy, and Amanda Siegel for many useful comments. This work was supported by NIH 2RO1DK43701 (RND).
References
- 1.Prasher DC, Eckenrode VK, Ward WW, Prendergast FG, et al. Primary structure of the Aequorea victoria green-fluorescent protein. Gene. 1992;111:229–33. doi: 10.1016/0378-1119(92)90691-h. [DOI] [PubMed] [Google Scholar]
- 2.Chalfie M, Tu Y, Euskirchen G, Ward WW, et al. Green fluorescent protein as a marker for gene expression. Science. 1994;263:802–5. doi: 10.1126/science.8303295. [DOI] [PubMed] [Google Scholar]
- 3.Adams SR, Harootunian AT, Buechler YJ, Taylor SS, et al. Fluorescence ratio imaging of cyclic AMP in single cells. Nature. 1991;349:694–7. doi: 10.1038/349694a0. [DOI] [PubMed] [Google Scholar]
- 4.Tsien RY. The 2009 Lindau Nobel Laureate Meeting: Roger Y. Tsien, Chemistry 2008. J Vis Exp. 2010 doi: 10.3791/1575. [DOI] [PMC free article] [PubMed] [Google Scholar]
- 5.Tsien RY. The green fluorescent protein. Annu Rev Biochem. 1998;67:509–44. doi: 10.1146/annurev.biochem.67.1.509. [DOI] [PubMed] [Google Scholar]
- 6.Cubitt AB, Woollenweber LA, Heim R. Understanding structure-function relationships in the Aequorea victoria green fluorescent protein. Methods Cell Biol. 1999;58:19–30. doi: 10.1016/s0091-679x(08)61946-9. [DOI] [PubMed] [Google Scholar]
- 7.Nagai T, Ibata K, Park ES, Kubota M, et al. A variant of yellow fluorescent protein with fast and efficient maturation for cell-biological applications. Nat Biotechnol. 2002;20:87–90. doi: 10.1038/nbt0102-87. [DOI] [PubMed] [Google Scholar]
- 8.Rizzo MA, Springer GH, Granada B, Piston DW. An improved cyan fluorescent protein variant useful for FRET. Nat Biotechnol. 2004;22:445–9. doi: 10.1038/nbt945. [DOI] [PubMed] [Google Scholar]
- 9.Ai HW, Shaner NC, Cheng Z, Tsien RY, et al. Exploration of new chromophore structures leads to the identification of improved blue fluorescent proteins. Biochemistry. 2007;46:5904–10. doi: 10.1021/bi700199g. [DOI] [PubMed] [Google Scholar]
- 10.Matz MV, Lukyanov KA, Lukyanov SA. Family of the green fluorescent protein: journey to the end of the rainbow. Bioessays. 2002;24:953–9. doi: 10.1002/bies.10154. [DOI] [PubMed] [Google Scholar]
- 11.Labas YA, Gurskaya NG, Yanushevich YG, Fradkov AF, et al. Diversity and evolution of the green fluorescent protein family. Proc Natl Acad Sci U S A. 2002;99:4256–61. doi: 10.1073/pnas.062552299. [DOI] [PMC free article] [PubMed] [Google Scholar]
- 12.Shagin DA, Barsova EV, Yanushevich YG, Fradkov AF, et al. GFP-like proteins as ubiquitous metazoan superfamily: evolution of functional features and structural complexity. Mol Biol Evol. 2004;21:841–50. doi: 10.1093/molbev/msh079. [DOI] [PubMed] [Google Scholar]
- 13.Pakhomov AA, Martynov VI. GFP family: structural insights into spectral tuning. Chem Biol. 2008;15:755–64. doi: 10.1016/j.chembiol.2008.07.009. [DOI] [PubMed] [Google Scholar]
- 14.Matz MV, Fradkov AF, Labas YA, Savitsky AP, et al. Fluorescent proteins from nonbioluminescent Anthozoa species. Nat Biotechnol. 1999;17:969–73. doi: 10.1038/13657. [DOI] [PubMed] [Google Scholar]
- 15.Karasawa S, Araki T, Nagai T, Mizuno H, et al. Cyan-emitting and orange-emitting fluorescent proteins as a donor/acceptor pair for fluorescence resonance energy transfer. Biochem J. 2004;381:307–12. doi: 10.1042/BJ20040321. [DOI] [PMC free article] [PubMed] [Google Scholar]
- 16.Shcherbo D, Merzlyak EM, Chepurnykh TV, Fradkov AF, et al. Bright far-red fluorescent protein for whole-body imaging. Nat Methods. 2007;4:741–6. doi: 10.1038/nmeth1083. [DOI] [PubMed] [Google Scholar]
- 17.Day RN, Davidson MW. The fluorescent protein palette: tools for cellular imaging. Chem Soc Rev. 2009;38:2887–921. doi: 10.1039/b901966a. [DOI] [PMC free article] [PubMed] [Google Scholar]
- 18.Lippincott-Schwartz J, Snapp E, Kenworthy A. Studying protein dynamics in living cells. Nat Rev Mol Cell Biol. 2001;2:444–56. doi: 10.1038/35073068. [DOI] [PubMed] [Google Scholar]
- 19.Zhang J, Campbell RE, Ting AY, Tsien RY. Creating new fluorescent probes for cell biology. Nat Rev Mol Cell Biol. 2002;3:906–18. doi: 10.1038/nrm976. [DOI] [PubMed] [Google Scholar]
- 20.Giepmans BN, Adams SR, Ellisman MH, Tsien RY. The fluorescent toolbox for assessing protein location and function. Science. 2006;312:217–24. doi: 10.1126/science.1124618. [DOI] [PubMed] [Google Scholar]
- 21.Shaner NC, Patterson GH, Davidson MW. Advances in fluorescent protein technology. J Cell Sci. 2007;120:4247–60. doi: 10.1242/jcs.005801. [DOI] [PubMed] [Google Scholar]
- 22.Förster T. Delocalized excitation and excitation transfer. In: Sinanoglu O, editor. Modern Quantum Chemistry. Vol. 3. New York; Academic Press: 1965. pp. 93–137. [Google Scholar]
- 23.Stryer L. Fluorescence energy transfer as a spectroscopic ruler. Annu Rev Biochem. 1978;47:819–46. doi: 10.1146/annurev.bi.47.070178.004131. [DOI] [PubMed] [Google Scholar]
- 24.Lakowicz JR. Principles of fluorescence spectroscopy. xxvi. Springer; New York: 2006. p. 954. [Google Scholar]
- 25.Gryczynski Z, Gryczynski I, Lakowicz JR. Basics of Fluorescence and FRET. In: Periasamy A, Day RN, editors. Molecular Imaging: FRET Microscopy and Spectroscopy. Oxford University Press; New York: 2005. pp. 21–56. [Google Scholar]
- 26.Sun Y, Wallrabe H, Seo SA, Periasamy A. FRET microscopy in 2010: the legacy of Theodor Forster on the 100th anniversary of his birth. Chemphyschem. 2011;12:462–74. doi: 10.1002/cphc.201000664. [DOI] [PMC free article] [PubMed] [Google Scholar]
- 27.Jares-Erijman EA, Jovin TM. FRET imaging. Nat Biotechnol. 2003;21:1387–95. doi: 10.1038/nbt896. [DOI] [PubMed] [Google Scholar]
- 28.Periasamy A, Day RN. Molecular imaging: FRET microscopy and spectroscopy. The American Physiological Society methods in physiology series. 2005;xv:312. [Google Scholar]
- 29.Vogel SS, Thaler C, Koushik SV. Fanciful FRET. Sci STKE. 2006;2006:re2. doi: 10.1126/stke.3312006re2. [DOI] [PubMed] [Google Scholar]
- 30.Berney C, Danuser G. FRET or no FRET: a quantitative comparison. Biophys J. 2003;84:3992–4010. doi: 10.1016/S0006-3495(03)75126-1. [DOI] [PMC free article] [PubMed] [Google Scholar]
- 31.Drobizhev M, Makarov NS, Tillo SE, Hughes TE, et al. Two-photon absorption properties of fluorescent proteins. Nat Methods. 2011;8:393–9. doi: 10.1038/nmeth.1596. [DOI] [PMC free article] [PubMed] [Google Scholar]
- 32.Dickinson ME, Bearman G, Tille S, Lansford R, et al. Multi-spectral imaging and linear unmixing add a whole new dimension to laser scanning fluorescence microscopy. Biotechniques. 2001;31:1272, 4–6, 8. doi: 10.2144/01316bt01. [DOI] [PubMed] [Google Scholar]
- 33.Zimmermann T, Rietdorf J, Pepperkok R. Spectral imaging and its applications in live cell microscopy. FEBS Lett. 2003;546:87–92. doi: 10.1016/s0014-5793(03)00521-0. [DOI] [PubMed] [Google Scholar]
- 34.Chen Y, Mauldin JP, Day RN, Periasamy A. Characterization of spectral FRET imaging microscopy for monitoring nuclear protein interactions. J Microsc. 2007;228:139–52. doi: 10.1111/j.1365-2818.2007.01838.x. [DOI] [PMC free article] [PubMed] [Google Scholar]
- 35.Bastiaens PI, Majoul IV, Verveer PJ, Soling HD, et al. Imaging the intracellular trafficking and state of the AB5 quaternary structure of cholera toxin. EMBO J. 1996;15:4246–53. [PMC free article] [PubMed] [Google Scholar]
- 36.Day RN, Periasamy A, Schaufele F. Fluorescence resonance energy transfer microscopy of localized protein interactions in the living cell nucleus. Methods. 2001;25:4–18. doi: 10.1006/meth.2001.1211. [DOI] [PubMed] [Google Scholar]
- 37.Kenworthy AK. Imaging protein-protein interactions using fluorescence resonance energy transfer microscopy. Methods. 2001;24:289–96. doi: 10.1006/meth.2001.1189. [DOI] [PubMed] [Google Scholar]
- 38.Kremers GJ, Hazelwood KL, Murphy CS, Davidson MW, et al. Photoconversion in orange and red fluorescent proteins. Nat Methods. 2009;6:355–8. doi: 10.1038/nmeth.1319. [DOI] [PMC free article] [PubMed] [Google Scholar]
- 39.Patterson GH, Lippincott-Schwartz J. A photoactivatable GFP for selective photolabeling of proteins and cells. Science. 2002;297:1873–7. doi: 10.1126/science.1074952. [DOI] [PubMed] [Google Scholar]
- 40.Demarco IA, Periasamy A, Booker CF, Day RN. Monitoring dynamic protein interactions with photoquenching FRET. Nat Methods. 2006;3:519–24. doi: 10.1038/nmeth889. [DOI] [PMC free article] [PubMed] [Google Scholar]
- 41.Periasamy A, Clegg RM. FLIM microscopy in biology and medicine. xxix. CRC Press; Boca Raton: 2010. p. 407.p. 32. of plates. [Google Scholar]
- 42.Bastiaens PI, Squire A. Fluorescence lifetime imaging microscopy: spatial resolution of biochemical processes in the cell. Trends Cell Biol. 1999;9:48–52. doi: 10.1016/s0962-8924(98)01410-x. [DOI] [PubMed] [Google Scholar]
- 43.Yasuda R. Imaging spatiotemporal dynamics of neuronal signaling using fluorescence resonance energy transfer and fluorescence lifetime imaging microscopy. Curr Opin Neurobiol. 2006;16:551–61. doi: 10.1016/j.conb.2006.08.012. [DOI] [PubMed] [Google Scholar]
- 44.Piston DW, Kremers GJ. Fluorescent protein FRET: the good, the bad and the ugly. Trends Biochem Sci. 2007;32:407–14. doi: 10.1016/j.tibs.2007.08.003. [DOI] [PubMed] [Google Scholar]
- 45.Venetta BD. Microscope Phase Fluorometer for Determining the Fluorescence Lifetimes of Fluorochromes. Review of Scientific Instruments. 1959;30:450–457. [Google Scholar]
- 46.Clegg RM. Fluorescence Lifetime-Resolved Imaging What, Why, How - A Prologue. In: Periasamy A, Clegg RM, editors. FLIM microscopy in biology and medicine. CRC Press; London: 2010. pp. 3–34. [Google Scholar]
- 47.Buranachai C, Kamiyama D, Chiba A, Williams BD, et al. Rapid frequency-domain FLIM spinning disk confocal microscope: lifetime resolution, image improvement and wavelet analysis. J Fluoresc. 2008;18:929–42. doi: 10.1007/s10895-008-0332-3. [DOI] [PubMed] [Google Scholar]
- 48.Verkhusha VV, Lukyanov KA. The molecular properties and applications of Anthozoa fluorescent proteins and chromoproteins. Nat Biotechnol. 2004;22:289–96. doi: 10.1038/nbt943. [DOI] [PubMed] [Google Scholar]
- 49.Yang F, Moss LG, Phillips GN., Jr. The molecular structure of green fluorescent protein. Nat Biotechnol. 1996;14:1246–51. doi: 10.1038/nbt1096-1246. [DOI] [PubMed] [Google Scholar]
- 50.Zacharias DA, Violin JD, Newton AC, Tsien RY. Partitioning of lipid-modified monomeric GFPs into membrane microdomains of live cells. Science. 2002;296:913–6. doi: 10.1126/science.1068539. [DOI] [PubMed] [Google Scholar]
- 51.Zhang J, Campbell RE, Ting AY, Tsien RY. Creating new fluorescent probes for cell biology. Nat Rev Mol Cell Biol. 2002;3:906–18. doi: 10.1038/nrm976. [DOI] [PubMed] [Google Scholar]
- 52.Griesbeck O, Baird GS, Campbell RE, Zacharias DA, et al. Reducing the environmental sensitivity of yellow fluorescent protein. Mechanism and applications. J Biol Chem. 2001;276:29188–94. doi: 10.1074/jbc.M102815200. [DOI] [PubMed] [Google Scholar]
- 53.Goedhart J, van Weeren L, Hink MA, Vischer NO, et al. Bright cyan fluorescent protein variants identified by fluorescence lifetime screening. Nat Methods. 2010;7:137–9. doi: 10.1038/nmeth.1415. [DOI] [PubMed] [Google Scholar]
- 54.Markwardt ML, Kremers GJ, Kraft CA, Ray K, et al. An improved cerulean fluorescent protein with enhanced brightness and reduced reversible photoswitching. PLoS One. 2011;6:e17896. doi: 10.1371/journal.pone.0017896. [DOI] [PMC free article] [PubMed] [Google Scholar]
- 55.Klarenbeek JB, Goedhart J, Hink MA, Gadella TW, et al. A mTurquoise-Based cAMP Sensor for Both FLIM and Ratiometric Read-Out Has Improved Dynamic Range. PLoS One. 2011;6:e19170. doi: 10.1371/journal.pone.0019170. [DOI] [PMC free article] [PubMed] [Google Scholar]
- 56.Zapata-Hommer O, Griesbeck O. Efficiently folding and circularly permuted variants of the Sapphire mutant of GFP. BMC Biotechnol. 2003;3:5. doi: 10.1186/1472-6750-3-5. [DOI] [PMC free article] [PubMed] [Google Scholar]
- 57.Ai HW, Hazelwood KL, Davidson MW, Campbell RE. Fluorescent protein FRET pairs for ratiometric imaging of dual biosensors. Nat Methods. 2008;5:401–3. doi: 10.1038/nmeth.1207. [DOI] [PubMed] [Google Scholar]
- 58.Ai HW, Henderson JN, Remington SJ, Campbell RE. Directed evolution of a monomeric, bright and photostable version of Clavularia cyan fluorescent protein: structural characterization and applications in fluorescence imaging. Biochem J. 2006;400:531–40. doi: 10.1042/BJ20060874. [DOI] [PMC free article] [PubMed] [Google Scholar]
- 59.Day RN, Booker CF, Periasamy A. Characterization of an improved donor fluorescent protein for Forster resonance energy transfer microscopy. J Biomed Opt. 2008;13:031203. doi: 10.1117/1.2939094. [DOI] [PMC free article] [PubMed] [Google Scholar]
- 60.Padilla-Parra S, Auduge N, Lalucque H, Mevel JC, et al. Quantitative comparison of different fluorescent protein couples for fast FRET-FLIM acquisition. Biophys J. 2009;97:2368–76. doi: 10.1016/j.bpj.2009.07.044. [DOI] [PMC free article] [PubMed] [Google Scholar]
- 61.Shcherbo D, Murphy CS, Ermakova GV, Solovieva EA, et al. Far-red fluorescent tags for protein imaging in living tissues. Biochem J. 2009;418:567–74. doi: 10.1042/BJ20081949. [DOI] [PMC free article] [PubMed] [Google Scholar]
- 62.Matz MV, Fradkov AF, Labas YA, Savitsky AP, et al. Fluorescent proteins from nonbioluminescent Anthozoa species. Nat Biotechnol. 1999;17:969–73. doi: 10.1038/13657. [DOI] [PubMed] [Google Scholar]
- 63.Baird GS, Zacharias DA, Tsien RY. Biochemistry, mutagenesis, and oligomerization of DsRed, a red fluorescent protein from coral. Proc Natl Acad Sci U S A. 2000;97:11984–9. doi: 10.1073/pnas.97.22.11984. [DOI] [PMC free article] [PubMed] [Google Scholar]
- 64.Bevis BJ, Glick BS. Rapidly maturing variants of the Discosoma red fluorescent protein (DsRed) Nat Biotechnol. 2002;20:83–7. doi: 10.1038/nbt0102-83. [DOI] [PubMed] [Google Scholar]
- 65.Campbell RE, Tour O, Palmer AE, Steinbach PA, et al. A monomeric red fluorescent protein. Proc Natl Acad Sci U S A. 2002;99:7877–82. doi: 10.1073/pnas.082243699. [DOI] [PMC free article] [PubMed] [Google Scholar]
- 66.Wang L, Jackson WC, Steinbach PA, Tsien RY. Evolution of new nonantibody proteins via iterative somatic hypermutation. Proc Natl Acad Sci U S A. 2004;101:16745–9. doi: 10.1073/pnas.0407752101. [DOI] [PMC free article] [PubMed] [Google Scholar]
- 67.Shaner NC, Campbell RE, Steinbach PA, Giepmans BN, et al. Improved monomeric red, orange and yellow fluorescent proteins derived from Discosoma sp. red fluorescent protein. Nat Biotechnol. 2004;22:1567–72. doi: 10.1038/nbt1037. [DOI] [PubMed] [Google Scholar]
- 68.Shaner NC, Steinbach PA, Tsien RY. A guide to choosing fluorescent proteins. Nat Methods. 2005;2:905–9. doi: 10.1038/nmeth819. [DOI] [PubMed] [Google Scholar]
- 69.Peter M, Ameer-Beg SM, Hughes MK, Keppler MD, et al. Multiphoton-FLIM quantification of the EGFP-mRFP1 FRET pair for localization of membrane receptor-kinase interactions. Biophys J. 2005;88:1224–37. doi: 10.1529/biophysj.104.050153. [DOI] [PMC free article] [PubMed] [Google Scholar]
- 70.Tramier M, Zahid M, Mevel JC, Masse MJ, et al. Sensitivity of CFP/YFP and GFP/mCherry pairs to donor photobleaching on FRET determination by fluorescence lifetime imaging microscopy in living cells. Microsc Res Tech. 2006;69:933–9. doi: 10.1002/jemt.20370. [DOI] [PubMed] [Google Scholar]
- 71.Yasuda R, Harvey CD, Zhong H, Sobczyk A, et al. Supersensitive Ras activation in dendrites and spines revealed by two-photon fluorescence lifetime imaging. Nat Neurosci. 2006;9:283–91. doi: 10.1038/nn1635. [DOI] [PubMed] [Google Scholar]
- 72.Shaner NC, Lin MZ, McKeown MR, Steinbach PA, et al. Improving the photostability of bright monomeric orange and red fluorescent proteins. Nat Methods. 2008;5:545–51. doi: 10.1038/nmeth.1209. [DOI] [PMC free article] [PubMed] [Google Scholar]
- 73.Sakaue-Sawano A, Kurokawa H, Morimura T, Hanyu A, et al. Visualizing spatiotemporal dynamics of multicellular cell-cycle progression. Cell. 2008;132:487–98. doi: 10.1016/j.cell.2007.12.033. [DOI] [PubMed] [Google Scholar]
- 74.Goedhart J, Vermeer JE, Adjobo-Hermans MJ, van Weeren L, et al. Sensitive detection of p65 homodimers using red-shifted and fluorescent protein-based FRET couples. PLoS One. 2007;2:e1011. doi: 10.1371/journal.pone.0001011. [DOI] [PMC free article] [PubMed] [Google Scholar]
- 75.Sun Y, Booker CF, Kumari S, Day RN, et al. Characterization of an orange acceptor fluorescent protein for sensitized spectral fluorescence resonance energy transfer microscopy using a white-light laser. J Biomed Opt. 2009;14:054009. doi: 10.1117/1.3227036. [DOI] [PMC free article] [PubMed] [Google Scholar]
- 76.Merzlyak EM, Goedhart J, Shcherbo D, Bulina ME, et al. Bright monomeric red fluorescent protein with an extended fluorescence lifetime. Nat Methods. 2007;4:555–7. doi: 10.1038/nmeth1062. [DOI] [PubMed] [Google Scholar]
- 77.Shcherbo D, Souslova EA, Goedhart J, Chepurnykh TV, et al. Practical and reliable FRET/FLIM pair of fluorescent proteins. BMC Biotechnol. 2009;9:24. doi: 10.1186/1472-6750-9-24. [DOI] [PMC free article] [PubMed] [Google Scholar]
- 78.Kredel S, Oswald F, Nienhaus K, Deuschle K, et al. mRuby, a bright monomeric red fluorescent protein for labeling of subcellular structures. PLoS ONE. 2009;4:e4391. doi: 10.1371/journal.pone.0004391. [DOI] [PMC free article] [PubMed] [Google Scholar]
- 79.Ganesan S, Ameer-Beg SM, Ng TT, Vojnovic B, et al. A dark yellow fluorescent protein (YFP)-based Resonance Energy-Accepting Chromoprotein (REACh) for Forster resonance energy transfer with GFP. Proc Natl Acad Sci U S A. 2006;103:4089–94. doi: 10.1073/pnas.0509922103. [DOI] [PMC free article] [PubMed] [Google Scholar]
- 80.Murakoshi H, Lee SJ, Yasuda R. Highly sensitive and quantitative FRET-FLIM imaging in single dendritic spines using improved non-radiative YFP. Brain Cell Biol. 2008;36:31–42. doi: 10.1007/s11068-008-9024-9. [DOI] [PMC free article] [PubMed] [Google Scholar]
- 81.DiPilato LM, Zhang J. Fluorescent protein-based biosensors: resolving spatiotemporal dynamics of signaling. Curr Opin Chem Biol. 2010;14:37–42. doi: 10.1016/j.cbpa.2009.10.012. [DOI] [PMC free article] [PubMed] [Google Scholar]
- 82.You X, Nguyen AW, Jabaiah A, Sheff MA, et al. Intracellular protein interaction mapping with FRET hybrids. Proc Natl Acad Sci U S A. 2006;103:18458–63. doi: 10.1073/pnas.0605422103. [DOI] [PMC free article] [PubMed] [Google Scholar]