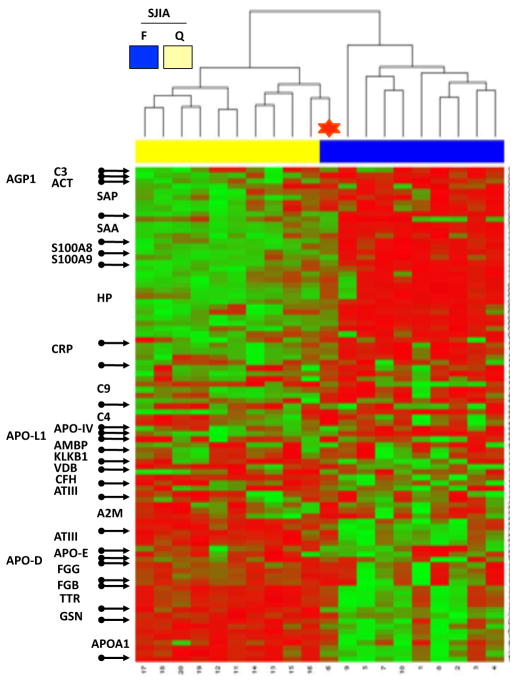
Figure 1.
Heatmap display of unsupervised hierarchical clustering of the relative protein abundance (normalized volume data, low-green and high-red) in paired SJIA F/Q plasma samples. The rows of heatmap represent the 89 gel spots derived from 26 different proteins (labeled with SwissProt protein names at the left of the heatmap) with each column of that row representing a different sample from subjects with SJIA flare (blue) and SJIA quiescence (yellow). The SJIA F sample, clustered with the SJIA Q branch, is labeled with a red star.

