Figure 2.
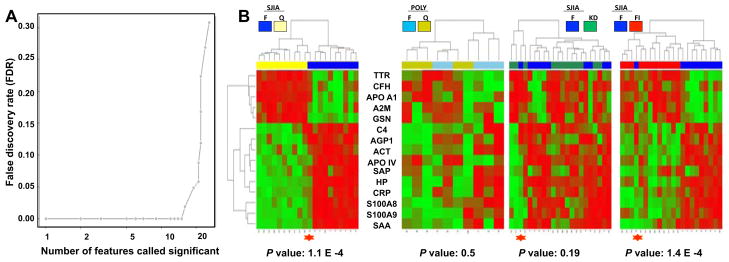
Construction of robust SJIA flare panel. A. False discovery rate (FDR) analysis of the 26 proteins discriminating SJIA F and Q. X-Y plot of FDR as a function of the number of proteins called significant. B. Heatmap display of unsupervised clustering analyses of expression of the top 15 proteins, ranked by the nearest shrunken centroid algorithm (NSC), in SJIA F/Q, Poly JIA F/Q, SJIA F/KD, SJIA F/FI samples. The misclassified SJIA F sample (Figure 1) is labeled with a red star in each heatmap.

