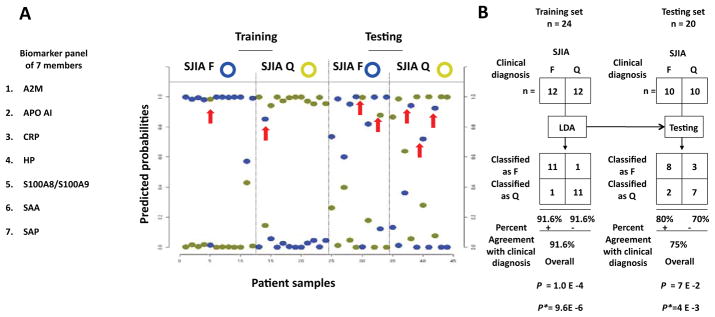
Figure 4.
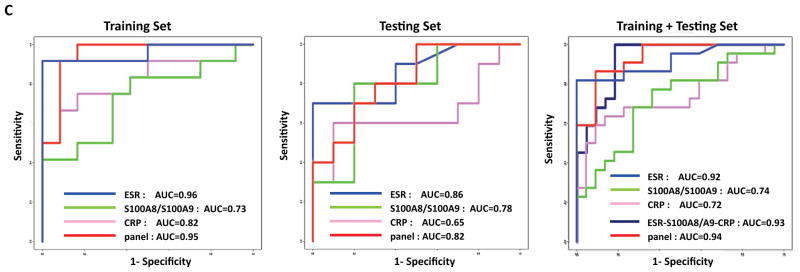
Linear discriminant analysis of the ELISA-based SJIA flare biomarker panel differentiating SJIA F from Q samples. A. SJIA flare biomarker panel of 7 ELISA assays. Linear discriminant analysis (LDA) was performed with training data from SJIA F (n=17) and Q (n=17) samples evaluated with the biomarker panel. Estimated probabilities for the training (left) and test data (right) are plotted. Samples are partitioned by the true class (upper) and predicted class (lower). The maximum estimated probability for each of the wrongly assigned samples is marked with a red arrow. The trained LDA model was tested using an independent data set from SJIA F (n=10) and Q (n=10) samples. B. The classification results from training and test sets are shown as 2×2 contingency tables. Fisher exact test was used to measure P values of the 2×2 tables with (upper) and without (lower) confounding F samples. C. ROC analyses, using training, test or combined training and testing data sets, to compare the SJIA F and Q classification performance by either ESR, S100A8/S100A9, CRP, the panel of ESR-S100A8/A9-CRP, or SJIA flare ELISA panel, respectively.


