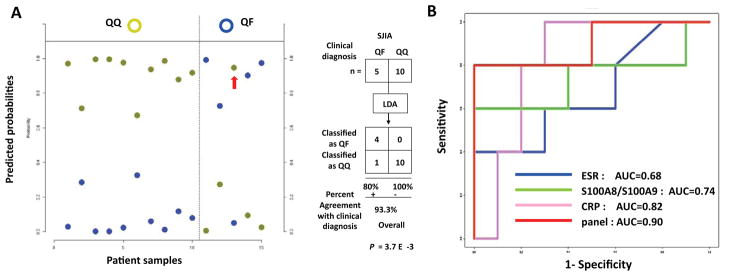
Figure 6.
Linear discriminant analysis of the ELISA-based SJIA flare biomarker panel in detection of impending SJIA flare. QF: 10 SJIA quiescent samples drawn within 2–9 weeks of a clinical flare; QQ: 10 SJIA quiescent controls who remained in quiescence for 6 months after the sample was drawn. A. Estimated probabilities for the training (left) and test data (right). Samples are partitioned by the true class (upper) and predicted class (lower). The maximum estimated probability for each of the wrongly assigned samples is marked with a red arrow. SJIA QQ and QF samples were used as training set to develop a binary classifier. The classification results are shown as a 2×2 contingency table, comparing SJIA QF to QQ. Fisher exact test was used to measure the P value of the 2×2 table. B. ROC analyses, using training data sets to compare the SJIA F and Q classification performance by ESR, S100A8/S100A9, CRP or SJIA flare panel.

