

Abstract
A greater understanding of the function of the human immune system at the single-cell level in healthy individuals is critical for discerning aberrant cellular behavior that occurs in settings such as autoimmunity, immunosenescence, and cancer. To achieve this goal, a systems-level approach capable of capturing the response of the interdependent immune cell types to external stimuli is required. In this study, an extensive characterization of signaling responses in multiple immune cell subpopulations within PBMCs from a cohort of 60 healthy donors was performed using single-cell network profiling (SCNP). SCNP is a multiparametric flow cytometry-based approach that enables the simultaneous measurement of basal and evoked signaling in multiple cell subsets within heterogeneous populations. In addition to establishing the interindividual degree of variation within a broad panel of immune signaling responses, the possible association of any observed variation with demographic variables including age and race was investigated. Using half of the donors as a training set, multiple age- and race-associated variations in signaling responses in discrete cell subsets were identified, and several were subsequently confirmed in the remaining samples (test set). Such associations may provide insight into age-related immune alterations associated with high infection rates and diminished protection following vaccination and into the basis for ethnic differences in autoimmune disease incidence and treatment response. SCNP allowed for the generation of a functional map of healthy immune cell signaling responses that can provide clinically relevant information regarding both the mechanisms underlying immune pathological conditions and the selection and effect of therapeutics.
A systems-level approach is required to provide a comprehensive understanding of how the function of the human immune system arises from the interactions among numerous interconnected components, pathways, and cell types. Reductionist approaches that analyze individual components within the immune system have dominated in the past several decades primarily due to technological limitations. The recent development of high-throughput technologies is beginning to change the landscape of immunological studies, and researchers are ushering in the new field of systems immunology (1). In this study, we describe a novel technology that has the potential to have an enormous impact on this burgeoning field because it allows for simultaneous functional measurements from multiple cell subpopulations without the need for prior cell separation. This enables a more integrated description of immune cell signaling responses than traditional studies, which often focus on the behavior of specific cell types that have been physically isolated from heterogeneous tissues such as peripheral blood, spleen, or lymph nodes. We applied this technology to the characterization of immune cell signaling in healthy individuals to establish a reference functional map in the context of an immune cell signaling network, which is critical for elucidating aberrant network-level behaviors underlying the pathogenesis of immune-based diseases.
Single-cell network profiling (SCNP) is a multiparametric flow cytometry-based analysis that can simultaneously measure, at the single-cell level, both extracellular surface markers and changes in intracellular signaling proteins in response to extracellular modulators. Measuring changes in signaling proteins following the application of an external stimulus informs on the functional capacity of the signaling network, which cannot be assessed by the measurement of basal signaling alone (2). In addition, the simultaneous analysis of multiple pathways in multiple cell subsets can provide insight into the connectivity of both cell signaling networks and immune cell subtypes (3). SCNP technology is particularly well suited to the investigation of signaling activity within the many interdependent cell types that make up the immune system because it allows for the simultaneous interrogation of modulated signaling network responses in multiple cell subtypes within heterogeneous populations, such as PBMCs, without the additional cellular manipulation required for the isolation of specific cell types.
This report summarizes the application of the SCNP technology to quantify phospho-protein levels (p-Stat1, p-Stat3, p-Stat5, p-Stat6, p-Akt, p-S6, p-NF-κB, and p-Erk) within pathways downstream of a broad panel of immunomodulators (including IFN-α, IFN-γ, IL-2, IL-4, IL-6, IL-10, IL-27, anti-IgD, LPS, R848, PMA, and CD40L) in seven distinct immune cell subpopulations within PBMC samples from 60 healthy adults. This systems-level approach enabled the generation of a functional map of immune cell network responses for 38 signaling nodes in 7 immune cell types in healthy individuals. This functional map can serve as a reference for understanding signaling variations that occur in pathological conditions such as autoimmunity and to inform clinical decision-making in vaccination and other immunotherapeutic settings. In addition, intersubject variation in immune signaling responses associated with demographic characteristics of the healthy donors such as age or race was identified.
Materials and Methods
PBMC samples
Cryopreserved PBMC samples taken from 60 healthy donors within the Department of Transfusion Medicine, Clinical Center, National Institutes of Health, with institutional review board approval were used in this study (Table I). Blood donations from healthy donors, donated for research purposes with informed consent, were collected and processed as described previously (4).
Table I.
Summary of donor numbers, age, race, and gender in the master, training, and test sample sets
| Master | Training | Test | |
|---|---|---|---|
| No. of donors | 60 | 30 | 30 |
| Mean age (range) (y) | 48.9 (19–73) | 47.9 (22–73) | 49.8 (19–73) |
| Gender | 12 female, 48 male | 5 female, 25 male | 7 female, 23 male |
| Race | 25 AA | 10 AA | 15 AA |
| 34 EA | 19 EA | 15 EA | |
| 1 Hispanic | 1 Hispanic | 0 Hispanic |
SCNP assay
Cryopreserved PBMC samples were thawed at 37°C and resuspended in RPMI 1640 (1% FBS) before staining with amine aqua viability dye (Invitrogen, Carlsbad, CA). Cells were resuspended in RPMI 1640 (10% FBS), aliquoted to 100,000 cells/well of 96-well plates and rested for 2 h at 37°C prior to 15 min at 37°C incubation with the following modulators: 1000 IU/ml IFN-α (PBL InterferonSource, Piscataway, NJ); 250 ng/ml IFN-γ, 50 ng/ml IL-4, 50 ng/ml IL-10, and 5 μg/ml anti-IgD (BD Biosciences, San Jose, CA); 50 ng/ml IL-2, 50 ng/ml IL-6, 50 ng/ml IL-27, and 0.5 μg/ml CD40L (R&D Systems, Minneapolis, MN); 5 μg/ml R848 (resiquimod, TLR7/8 ligand; Invivogen, San Diego, CA); and 1 μg/ml LPS and 40 nM PMA (Sigma-Aldrich, St. Louis, MO). Reagent qualification experiments verified that LPS and anti-IgD displayed cell-type specificity for monocytes and B cells, respectively. These two modulators were combined in the SCNP assay to increase the number of signaling nodes that could be measured from a single well on the 96-well plate, and the effects of the two in combination are representative of each when applied as single stimulus. All modulator concentrations were selected based on six-point titrations performed on PBMC from two donors (data not shown). After exposure to modulators, cells were fixed with paraformaldehyde and permeabilized with 100% ice-cold methanol as previously described (5). Methanol-permeabilized cells were washed with FACS buffer (PBS, 0.5% BSA, and 0.05% NaN3), pelleted, and stained with fluorochrome-conjugated Abs. Abs used include anti-CD3 (clone UCHT1), -CD4 (clone RPA-T4), -CD45RA (clone HI100), -CD20 (clone H1), -p–NF-κB (clone K10-895.12.50), –c-poly(ADP-ribose) polymerase (clone F21-852), –p-Stat1 (clone 4a), –p-Stat3 (clone 4/p-Stat3), –p-Stat5 (clone 47), –p-Stat6 (clone 18/p-Stat6), –p-Erk (clone 20A; BD Biosciences), –p-Atk (clone D9E), –p-S6 (clone 2F9; CST, Danvers, MA), and -CD14 (clone RMO52; Beckman Coulter, Brea, CA).
Flow cytometry data acquisition and analysis
Flow cytometry data were acquired using FACS Diva software (BD Biosciences) on two LSR II flow cytometers (BD Biosciences). All flow cytometry data were analyzed with WinList (Verity House Software, Topsham, ME). For all analyses, dead cells and debris were excluded by forward scatter, side scatter, and amine aqua viability dye. PBMC subpopulations were delineated according to the immunophenotypic gating scheme shown in Supplemental Fig. 1.
SCNP terminology and metrics
The term signaling node refers to a specific protein readout in the presence or absence of a specific modulator. For example, the response to IFN-α stimulation can be measured using p-Stat1 as a readout. This signaling node is designated IFN-α → p-Stat1. Each signaling node is measured in each cell subpopulation. The cell subpopulation is noted following the node (e.g., IFN-α → p-Stat1 | B cells). Two different metrics are used in this study to measure the levels of intracellular signaling proteins in either the unmodulated state or in response to modulation. The basal metric is used to measure basal levels of signaling in the resting, unmodulated state. The fold metric is applied to measure the level of a signaling molecule after modulation compared with its level in the basal state. The equivalent number of reference fluorophores (ERF), fluorescence measurements calibrated by rainbow calibration particles on each 96-well plate, serves as a basis for all metric calculations (6, 7).
The basal and fold metrics were calculated as follows:
in which Ph is the percentage of healthy [cleaved poly(ADP-ribose) polymerase-negative] cells.
Assay standardization and performance monitoring
The SCNP assay incorporates a number of standardization procedures and process controls that include instrument standardization and calibration, reagent qualification and quality control testing, consistent sample processing, and assay performance monitoring. A cell line control row (GDM-1; derived from myelomonoblastic leukemia) was included on each of the 96-well plates that were processed in this study. The cell line control was used to monitor the reproducibility of the assay performance both during the reported study and to enable comparison with previous studies (data not shown).
Statistical analysis
The high dimensionality of the SCNP data for individual nodes (i.e., combination of cell populations, modulators, and protein readouts) greatly increases the probability of finding chance associations in the data (i.e., false discovery). To address this, a multistep analysis strategy designed to reduce the chance of false discoveries by accounting for multiple testing and therefore reducing the chance of a type 1 error (incorrectly rejecting the null hypothesis) was followed. First, the data were split into training (30 samples) and test sets (30 samples) stratified randomly on race and age (Table I). Multivariate linear regression was then used to find associations between individual immune signaling nodes and age and/or race in the training set. Associations with immune signaling were found by controlling for age and race. The exact form of the linear model used to test for significant associations among age, race, and node signaling in the training data set was:
in which Race was coded as 1 for African American (AA) and 0 for European American (EA). Linear models were built for each signaling node in each of the following cell subpopulations: monocytes, B cells, CD45RA+ Th cells, CD45RA+ cytotoxic T cells, CD45RA− Th cells, and CD45RA− cytotoxic T cells. In the training data set, signaling nodes were considered to have a significant association with age for models in which β1 has a significant p value (<0.05) and a significant association for race for models in which β2 has a significant p value (<0.05).
Discovering groups of signaling nodes rather than individual nodes can guard against finding chance associations. To create groupings of nodes, a principal component analysis (PCA) (8) was performed both on the set of immune signaling nodes found to be significantly associated with age and also with the set of immune signaling nodes found to be significantly associated with race from the linear models in the training data. The PCA analysis accounted for correlation among signaling nodes, which may carry redundant information, by creating linear combinations of signaling nodes associated with age and/or race. In addition, to confirm the age and race associations in the test set, a Gatekeeper strategy was used to control the type 1 error rate (9). In this strategy, each hypothesis to be validated in the test set must be prespecified and sequentially ordered and subsequently tested in that order. A hypothesis is only considered validated if it is significant in the test set and all other hypotheses tested prior to it are significant. For this study, models using the first principal component from the age PCA and the first principal component from the race PCA were tested in the test set. The principal component models for age and race, which were locked (i.e., the model coefficients and PCA loading matrices were locked) in the training set before being tested on the test set (in order), were of the form:
Only the first principal components were deemed necessary to test because both first principal components for both the age and race PCA accounted for ~50% of the variance in training data. Only after the confirmation of the principal components in the test set were the contributions of the individual signaling nodes to the principal components for age and race associations examined to understand the biology associated with age and/or race.
Correlations between signaling nodes
R software (version 2.12.1) was used to compute Pearson correlation coefficients between all pairs of signaling nodes within and between each of the seven distinct cell subpopulations. Heat maps were generated in Excel 2007 (Microsoft, Redmond, WA).
Results
Cell type-specific patterns of immune signaling responses in PBMCs from healthy donors
A total of 38 signaling nodes, or specific protein readouts in the presence or absence of a specific modulator (Supplemental Table I), were measured in 12 cell populations defined by their surface phenotypes including 7 distinct immune cell subpopulations (monocytes, B cells, CD3−CD20− lymphocytes (NK cell-enriched subpopulation), CD45RA+ Th cells, CD45RA− Th cells, CD45RA+ cytotoxic T cells, and CD45RA− cytotoxic T cells (Fig. 1, Supplemental Fig. 1) within unsorted PBMC samples from 60 healthy donors (Table I) using two different metrics (basal and fold; see Materials and Methods). When gating on the viable cells (defined by scatter properties and amine aqua as described in Materials and Methods), only 15 out of the 28 modulated signaling nodes showed a signaling response above the threshold level of fold >0.25 representing an ~1.2-fold change in modulated levels relative to basal (see Materials and Methods) and a level of signaling that is very reproducible (data not shown). In contrast, when gating separately in the same samples on the 7 distinct immune cell subpopulations, 23 of these nodes showed induced signaling in at least one of the 7 subpopulations (Fig. 1B), exemplifying the utility of SCNP in the identification of heterogeneous functionality in complex tissues and rare cell populations.
FIGURE 1.

Signaling responses for the 28 modulated signaling nodes. A, Dendrogram showing the gating hierarchy for the total 12 cell populations including the 7 distinct immune cell subpopulations outlined in red. B, Signaling responses in all 12 of the cell populations. Signaling nodes with fold values <0.25 are represented by gray squares (Response), and signaling nodes with values below this threshold are indicated with white squares (No response). C, Representative histograms from one donor with unmodulated p-Erk levels shown in red and R848-induced p-Erk levels shown in blue. D, Representative histograms from one donor with unmodulated p-Stat1 levels shown in red and IFN-α–induced p-Stat1 levels shown in blue.
Fig. 1C and 1D show specific examples in support of this conclusion. Specifically, representative histograms for unmodulated and R848-induced p-Erk levels in the different cell populations are shown in Fig. 1C. The TLR ligand R848 (resiquimod) is an immunomodulator that portrays cell-type specificity, and consistent with this induced p-Erk and p–NF-κB only in B cells and monocytes, immune cell subpopulations known to express the receptors (TLR7/8) for this ligand. In contrast to R848, IFN-α is a globally active immunomodulator due to the ubiquitous expression of the IFN-α receptor on immune cells. As expected, at least one p-Stat protein was activated in response to IFN-α in all of the immune cell subpopulations (Fig. 1B, 1D), and this global responsiveness was reflected in the data from the viable cell population. Due to the generally reduced signaling responses from the more heterogeneous parental populations, in the sections below, data are reported primarily for the seven distinct immune cell subpopulations.
Because the SCNP assay allows for a quantification of signaling responses, by measuring the degree of pathway activity for each node in each cell subpopulation, differential levels of activation in the different immune cell subtypes was observed. For example, as expected, modulation of PBMCs with IFN-γ produced the highest level of p-Stat1 in monocytes, lower levels in B cells, and a much weaker p-Stat1 response in T cells (with differential levels of activation among the latter [i.e., CD45RA+ T cell subsets showing a higher level of response than their CD45RA− counterparts]) (Supplemental Fig. 2A). In contrast to IFN-γ treatment, IL-2 modulation of PBMCs led to p-Stat5 activation primarily in CD3−CD20− lymphocytes and T cells, again with differential activation levels seen among the T cell subsets and no effects on monocytes and B cells (Supplemental Fig. 2B).
Variation in immune signaling responses in PBMCs from healthy individuals
For each of the 38 signaling nodes tested (listed in Supplemental Table I), the range of signaling responses in each immune cell subset across the 60 samples was quantified (Fig. 2). A comparison of the data obtained from the analysis of the training set and the test set revealed that, as expected, the distributions in the training and test set did not differ significantly for a majority of the signaling responses (p > 0.05 for 98.9% of the 38 signaling nodes measured within each of the 7 distinct cell subsets). Although there was a narrow range of responses for the majority of the signaling nodes measured within the 7 distinct cell subsets, considerable interdonor variation was observed for a subset of the modulated nodes as demonstrated in Fig. 2.
FIGURE 2.

Range of signaling for each modulated signaling node within each of the seven distinct immune cell subpopulations.
Immune cell signaling network map in PBMCs from healthy individuals
A functional map of the healthy immune cell signaling network was generated by calculating the Pearson correlation coefficients between pairs of nodes within and among each of the 7 distinct immune cell subpopulations. Overall, visualization of the healthy immune cell signaling network map revealed a high frequency of positively correlated signaling responses (Fig. 3, Supplemental Fig. 3). Cytokine-induced signaling responses within each subpopulation were highly positively correlated, with a notable exception occurring for the CD45RA+ cytotoxic T cell subset for which IL-10 and IL-2 signaling responses were uncorrelated or weakly inversely correlated with responses to other cytokines (Supplemental Fig. 3). Positive correlations among cytokine signaling responses were also present across different cell subpopulations with the strongest intersubpopulation correlations generally occurring between pairs of nodes within the different T cell subsets. Intrasubpopulation correlations among cytokine-induced signaling responses and among PMA-induced signaling responses were weakest within the B cell subset, although strong positive correlations were present for signaling responses downstream of CD40L and between responses downstream of IgD cross-linking in this subpopulation.
FIGURE 3.
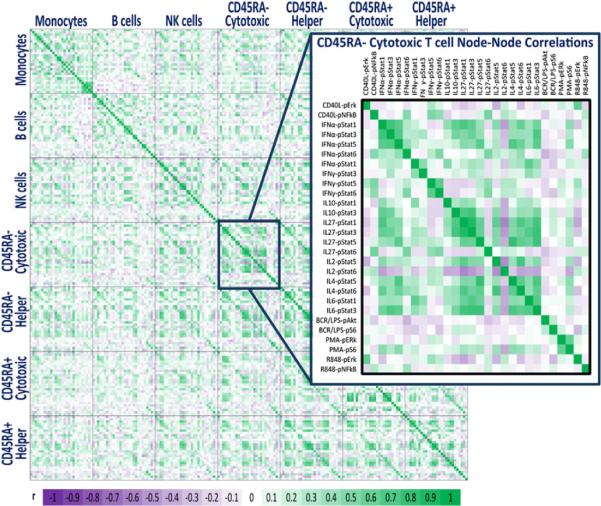
Healthy immune signaling network map. A heat map representing the magnitude of the Pearson correlation coefficients between pairs of nodes both within and among all seven distinct cell subpopulations. Increasing positive correlations are shown by increasing green intensity and increasing negative correlations by increasing purple intensity.
Age and/or race as variables associated with immune signaling responses
Both age and race are known to be relevant to clinical outcomes in immune-based disorders (10–12). Demographic heterogeneity of the 60-donor cohort (Table I) allowed us to assess the association between immune signaling responses and age and/or race. To discount variation in cell viability as a causative factor for any signaling differences seen between donor samples, differences between the proportions of viable cells for donors of different ages or races were first examined. A linear model of viable cell proportion with age and race as covariates revealed no significant associations (training set: age p value = 0.536, race p value = 0.161; test set: age p value = 0.874, race p value = 0.074) (data not shown). Next, given the large dimensionality of the SCNP data for individual nodes (i.e., combination of cell populations, modulators, and protein readouts), the possibility of chance association (i.e., false discovery) is high. To address this issue, we followed a multistep analysis strategy. First, the data were split into training (30 samples) and test sets (30 samples) randomly stratified on race and age. Multivariate linear regression was then used to find associations between individual immune signaling nodes and age and/or race in the training set. Because discovering groups of signaling nodes can guard against chance associations, a PCA was performed both on the set of immune signaling nodes associated with age and the set of signaling nodes associated with race. The PCA analysis accounted for the previously observed correlation among signaling nodes by combining the correlated signaling nodes associated with age or race in the training set. For confirmation of associations in the test set, a Gatekeeper strategy was used. The first principal component for both the age and race PCAs in the training set was locked and applied to the test set in a prespecified order and significance level (p < 0.05). Only after the confirmation of the principal components in the test set were the contributions of the individual signaling nodes to the principal components for age and race associations examined to understand the biology associated with age and/or race.
The PCA for age-associated immune signaling was performed on 19 signaling responses found to be associated with age, controlled for race, in the training set (p < 0.05, Table II). The first principal component for age accounted for 45% of the variance. Examination of the 19 individual signaling nodes revealed that one of these responses (PMA → p-Erk | B cells) was within the B cell subpopulation, whereas all of the remaining responses were within T cell subsets, with the highest number occurring within the CD45RA+ cytotoxic T cell subset. Only three unmodulated nodes (unmodulated→p-S6 | CD45RA− cytotoxic T cells, unmodulated (DMSO) → p-S6 | CD45RA− cytotoxic T cells, and unmodulated → p-Stat1 | CD45RA− cytotoxic T cells; Table II) were found to be associated with age in the training set.
Table II.
Summary of age-associated signaling nodes identified in the training set
| Training |
Test |
|||||
|---|---|---|---|---|---|---|
| Node | Population | R 2 | Age Slope | Age p Value | R 2 | Age Slope | Age p Value |
| IFN-α → p-Stat1 | CD45RA+ cytotoxic T cells | 0.434 | −0.014 | 0.000 | 0.129 | −0.012 | 0.069 |
| IFN-α → p-Stat3 | CD45RA+ cytotoxic T cells | 0.249 | −0.006 | 0.013 | 0.043 | −0.003 | 0.399 |
| IFN-α → p-Stat5 | CD45RA+ cytotoxic T cells | 0.325 | −0.013 | 0.002 | 0.206 | −0.016 | 0.017 |
| IFN-α → p-Stat6 | CD45RA− Th cells | 0.644 | −0.002 | 0.031 | 0.003 | 0.000 | 0.875 |
| IFN-γ → p-Stat1 | CD45RA+ cytotoxic T cells | 0.422 | −0.007 | 0.000 | 0.131 | −0.005 | 0.074 |
| IL-10 → p-Stat3 | CD45RA+ cytotoxic T cells | 0.201 | 0.010 | 0.022 | 0.059 | 0.005 | 0.368 |
| IL-2 → p-Stat5 | CD45RA+ Th cells | 0.539 | 0.027 | 0.000 | 0.201 | 0.023 | 0.022 |
| IL-2 → p-Stat6 | CD45RA+ Th cells | 0.291 | −0.007 | 0.011 | 0.122 | 0.004 | 0.176 |
| IL-27 → p-Stat1 | CD45RA+ cytotoxic T cells | 0.310 | −0.026 | 0.010 | 0.076 | −0.017 | 0.168 |
| IL-27 → p-Stat5 | CD45RA+ cytotoxic T cells | 0.234 | −0.010 | 0.011 | 0.222 | −0.009 | 0.016 |
| IL-27 → p-Stat6 | CD45RA+ cytotoxic T cells | 0.278 | −0.003 | 0.049 | 0.009 | −0.001 | 0.678 |
| IL-4 → p-Stat6 | CD45RA+ cytotoxic T cells | 0.187 | −0.012 | 0.026 | 0.234 | −0.013 | 0.020 |
| IL-6 → p-Stat1 | CD45RA+ cytotoxic T cells | 0.342 | −0.009 | 0.002 | 0.129 | −0.008 | 0.074 |
| IL-6 → p-Stat3 CD45RA+ cytotoxic T cells | 0.340 | −0.016 | 0.003 | 0.082 | −0.014 | 0.148 |
| PMA → p-Erk | B cells | 0.201 | 0.009 | 0.040 | 0.005 | −0.001 | 0.816 |
| PMA → p-Erk CD45RA+ Th cells | 0.331 | 0.012 | 0.026 | 0.005 | −0.001 | 0.816 |
| Unmodulated → p-S6 | CD45RA− cytotoxic T cells | 0.199 | −0.002 | 0.020 | 0.028 | −0.001 | 0.519 |
| Unmodulated (DMSO) → p-S6 | CD45RA− cytotoxic T cells | 0.167 | −0.002 | 0.036 | 0.064 | −0.001 | 0.208 |
| Unmodulated → p-Stat1 | CD45RA− cytotoxic T cells | 0.201 | 0.002 | 0.038 | 0.114 | 0.001 | 0.245 |
All age-associated responses identified in the training set are shown, and nodes, which were confirmed in the test set, are given in boldface. A negative slope indicates a negative correlation with age.
The PCA for race-associated immune signaling included 18 signaling responses found to be associated with race, controlled for age, in the training set (p < 0.05; Table III). The first principal component for race accounted for 54% of the variance. The 18 race-associated signaling responses consisted of a slightly more diverse set of cell subpopulations than the age-associated responses and included responses to several cytokines, the TLR ligand R848, and IgD cross-linking. Only one unmodulated node (unmodulated → p-Stat5 | CD45RA− cytotoxic T cells) was associated with race in the training set.
Table III.
Summary of race-associated signaling nodes identified in the training set
| Training |
Test |
|||||
|---|---|---|---|---|---|---|
| Node | Population | R 2 | Race Slope | Race p Value | R 2 | Race Slope | Race p Value |
| IFN-α → p-Stat3 | CD45RA− cytotoxic T cells | 0.224 | 0.140 | 0.016 | 0.133 | −0.054 | 0.314 |
| IFN-α → p-Stat3 | CD45RA− Th cells | 0.198 | 0.110 | 0.030 | 0.111 | −0.018 | 0.751 |
| IFN-α → p-Stat5 | Monocytes | 0.343 | 0.100 | 0.025 | 0.015 | −0.038 | 0.534 |
| IFN-α → p-Stat5 | CD45RA+ Th cells | 0.293 | 0.170 | 0.047 | 0.182 | −0.117 | 0.280 |
| IFN-γ → p-Stat1 | CD45RA− Th cells | 0.234 | 0.060 | 0.048 | 0.032 | −0.015 | 0.699 |
| Anti-IgD+LPS → p-Akt | B cells | 0.386 | −0.390 | 0.001 | 0.265 | −0.347 | 0.006 |
| Anti-IgD+LPS → p-S6 | B cells | 0.277 | −0.680 | 0.008 | 0.228 | −0.617 | 0.018 |
| IL-10 → p-Stat1 | CD45RA− Th cells | 0.187 | 0.050 | 0.024 | 0.097 | −0.038 | 0.126 |
| IL-10 → p-Stat3 | CD45RA− cytotoxic T cells | 0.244 | 0.280 | 0.018 | 0.034 | −0.084 | 0.439 |
| IL-10 → p-Stat3 | CD45RA− Th cells | 0.174 | 0.200 | 0.047 | 0.003 | −0.026 | 0.816 |
| IL-27 → p-Stat1 | CD45RA− cytotoxic T cells | 0.288 | 0.350 | 0.008 | 0.028 | −0.004 | 0.975 |
| IL-27 → p-Stat3 | CD45RA− cytotoxic T cells | 0.357 | 0.240 | 0.003 | 0.008 | −0.026 | 0.671 |
| IL-6 → p-Stat1 | CD45RA− cytotoxic T cells | 0.335 | 0.080 | 0.002 | 0.044 | −0.030 | 0.278 |
| IL-6 → p-Stat3 | CD45RA− cytotoxic T cells | 0.297 | 0.290 | 0.006 | 0.031 | −0.051 | 0.406 |
| IL-6 → p-Stat3 | CD45RA− Th cells | 0.182 | 0.280 | 0.031 | 0.014 | −0.057 | 0.717 |
| R848 → p-NF-κB | B cells | 0.279 | −0.090 | 0.021 | 0.040 | −0.027 | 0.579 |
| R848 → p-NF-κB | CD45RA− Th cells | 0.258 | 0.030 | 0.016 | 0.121 | 0.008 | 0.603 |
| Unmodulated → p-Stat5 | CD45RA− cytotoxic T cells | 0.568 | 0.039 | 0.043 | 0.017 | −0.002 | 0.881 |
All of the race-associated responses identified in the training set are shown, and nodes, which were confirmed in the test set, are highlighted in boldface. A positive slope indicates nodes that were more responsive in AAs than in EAs.
The first principal component for age (locked from the training set) was significant in the test set (p < 0.05), confirming that age can explain some of the observed interdonor variation in immune signaling responses. After confirmation, this first principal component was dissected by inspecting the loadings matrix and whether the node was significant in both the test and training set to further examine the underlying biology. Four individual signaling responses (IFN-α → p-Stat5 | CD45RA+ cytotoxic T cells, IL-27 → p-Stat5 | CD45RA+ cytotoxic T cells, IL-4 → p-Stat6 | CD45RA+ cytotoxic T cells, and IL-2 → p-Stat5 | CD45RA+ Th cells; Table II) were found to have high loadings and were significantly associated with signaling in the test set as well. Of note, none of the unmodulated nodes with age associations in the training set were individually significant in the test set. Exemplifying the SCNP assay advantage of subpopulation analysis, we confirmed that the IL-4 → p-Stat6 signaling node demonstrated a statistically significant decrease with age specifically within CD45RA+ cytotoxic T cells (Fig. 4A, Table II). A trend of decreasing signaling response with age was seen one level up the population hierarchy in the overall cytotoxic T cells, but this association was dampened by the CD45RA− cytotoxic T cells for which the IL-4 → p-Stat6 signaling response showed no association with age and thus did not reach statistical significance in the overall cytotoxic T cell subset (Fig. 4A). All three signaling nodes within the CD45RA+ cytotoxic T cell compartment (IFN-α → p-Stat5, IL-27 → p-Stat5, and IL-4 → p-Stat6) were positively correlated with each other, and all showed decreased responsiveness with age (Fig. 4B, Table II), whereas IL-2 → p-Stat5 activation within CD45RA+ Th cells increased with age and was uncorrelated with the three CD45RA+ cytotoxic T cell signaling nodes (Fig. 4B, Table II).
FIGURE 4.
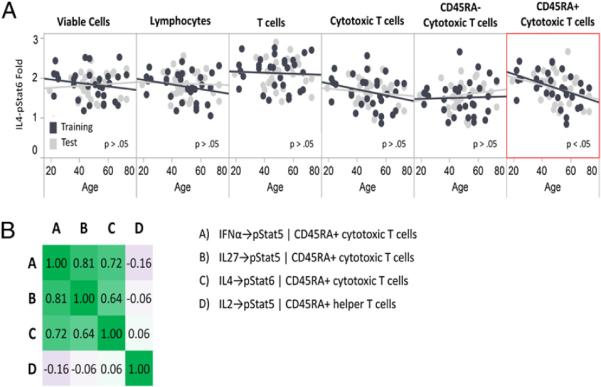
Age-associated immune signaling responses. A, Age versus fold for IL-4 → p-Stat6 signaling in the cytotoxic T cell subsets as well as in the parent populations (Cytotoxic T cells, T cells, Lymphocytes, and Viable Cells) is shown for both training (black symbols) and test set (gray symbols) samples. The red border is used to indicate the subpopulation in which the association between node signaling and age is significant. B, Heat map of the Pearson correlation coefficients for the four age-associated signaling nodes that were identified in the training set and independently confirmed in the test set. Increasing green intensity indicates increasing positive correlation, and increasing purple intensity indicates increasing negative correlation.
The race model, based on the first principal component for race (locked from the training set), was also significant in the test set (p < 0.05), confirming that race is associated with differences in immune signaling responses (Fig. 5A). After confirmation, this first principal component was also dissected to further examine the underlying biology. Two individual race-associated responses had high loadings and were significant in both the test and training sets. Both of these were within the B cell population (anti-IgD/LPS → p-Akt and anti-IgD/LPS → p-S6 nodes; Fig. 5B,5C, Table III) and both showed greater levels of responsiveness in the EA donors than in the AA donors (Fig. 5B,5C), and they were highly correlated (r = 0.81).
FIGURE 5.
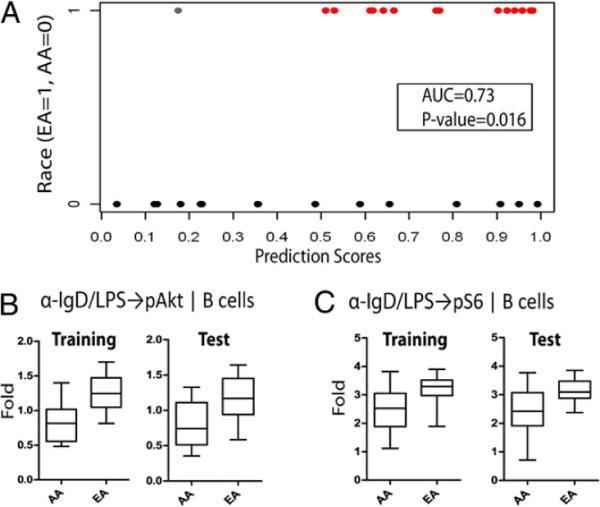
Race-associated immune signaling responses. A, Performance of the locked race model on the test set. The model is able to discriminate between AA and EA donors based on their immune signaling (area under the curve = 0.73; p = 0.016). B and C, Box plots for AAs and EAs in the training and test sets are shown for the two race-associated responses [anti-IgD/LPS → p-Akt (B) and anti-IgD/LPS → p-S6 (C) nodes in the B cell subpopulation] that were independently confirmed in the test set.
Discussion
Defining the range of immune signaling activity in multiple immune cell subsets and establishing an overall map of the immune cell signaling network in healthy individuals represents a critical first step in providing a baseline for the characterization of aberrant signaling responses and changes in the immune signaling network architecture that occur in diseases such as cancer and autoimmune disorders. Because the immune system consists of multiple interdependent cell types for which the behavior is mediated by complex intra- and intercellular regulatory networks, a comprehensive description of healthy immune function requires a systems-level approach capable of integrating information from multiple cell types, signaling pathways, and networks. In this study, we have used SCNP to perform a broad functional characterization of the healthy immune cell signaling network. As expected, many of the immunomodulators included in this study evoked cell type-specific responses (Fig. 1), highlighting the complexity of the regulation of biological function during immune responses. For a subset of the modulators and specific cell types investigated in this study, differential receptor expression and/or differential activation patterns have been previously reported. In instances in which such data are available, the cell-type specific signaling responses described in this paper are generally consistent with those reports (13–15). However, to our knowledge, no prior published studies have measured in a quantitative fashion the simultaneous modulation of multiple signaling pathways by different immunomodulatory modulators within several immune cell subpopulations collected from such a large number of healthy individuals.
To gain insight into the connectivity of the immune cell signaling network, we mapped node-to-node correlations within and among each of the distinct immune cell subpopulations. A high-level analysis of this map revealed an abundance of positively correlated nodes, with a higher frequency of positive correlations for node-to-node pairs within the same immune cell subset than for pairs of nodes spanning different cell types (Fig. 3, Supplemental Fig. 3). Importantly, this map can be compared with those generated using samples from patients with immune-based disorders to identify changes in the network architecture that occur under pathological conditions and can be applied to the analysis of samples obtained longitudinally from treated patients to monitor individual responses to therapeutics.
Aging is often accompanied by a deterioration of the immune system resulting in a higher susceptibility to infections and lower efficacy of vaccination in the elderly population (16, 17). Given the multitude of age-associated alterations in the function of the immune system, with some of the most profound occurring in T cells subsets (17, 18), we hypothesized that age may have an impact on the cell signaling responses measured in this study.
The results shown in this study demonstrate that some of the variation in healthy immune signaling responses can in fact be attributed to donor demographic characteristics such as age or race. Specifically, our analysis of the impact of age on immune signaling responses has revealed four individual signaling nodes with significant associations with age. Strikingly, all four of the individual age-associated immune signaling responses identified in this paper were within CD45RA+ T cells, a cell type that has been previously reported to undergo age-related functional changes such as reduced proliferation and cytokine production (17).
The majority (three out of four) of the individual age-associated signaling nodes confirmed in the PCA analysis and with statistical significance in both training and test sets occurred within the CD45RA+ cytotoxic T cell subset, whereas only one of the four resided in the CD45RA+ Th cell subset. One of the most dramatic age-related changes in the cytotoxic T cell subset is a decrease in the frequency of CD45RA+ cytotoxic T cells with age (18), and this was also observed in the samples analyzed in this study (data not shown). Additionally, we have observed an age-related decline in JAK-STAT signaling activity in the CD45RA+ cytotoxic T cell subset in response to multiple cytokines including IFN-α, IL-4, and IL-27 (Table II). Signaling elicited by these cytokines is critical for cytotoxic T cell survival, proliferation, and differentiation (19–22). Thus, the observed age-related decrease in responsiveness to these cytokines may underlie some of the functional changes within the cytotoxic T cell compartment (18, 23).
The single CD45RA+ Th cell age-associated signaling node was an increased IL-2–induced activation of Stat5 (Table II). This signaling pathway is required for T cell proliferation and activation (24, 25), and both the production of IL-2 and the proliferation of naive Th cells have been shown to decrease with age (26). The data reported in this paper suggest that the use of IL-2 may be an effective strategy for rescuing naive Th cell proliferation in the elderly and warrant further investigation.
Overall, the results reported in this study provide evidence of age-associated alterations in T cell cytokine signaling responses, with the most striking differences occurring specifically within the CD45RA+ cytotoxic T cell subset. Although age-associated differences in T cell signaling through the TCR have been widely reported (27), relatively few studies have documented age-related differences in human T cell cytokine signaling (28). Further, much of the work that has been conducted to examine associations between T cell cytokine signaling responses and age has been performed using isolated T cells with techniques such as Western blot analysis that allow for only population-level measurements of pathway activation. Analyses performed at the level of total T cells may fail to capture age-associated alterations specific to a given T cell subset as demonstrated in Fig. 4A.
In this study, we have reported age-associated alterations within the CD45RA+ cytotoxic T cell subset, a subset that has been shown not only to consist of naive cells but also to contain a subpopulation of effector cells with cytolytic activity (29). Future studies that use additional cell-surface markers, such as the lymph node homing receptor CCR7, are needed to assess whether there is an age-related difference in the composition of the CD45RA+ cytotoxic T cell subset. Should this be observed, with differential responses among the defined cell subpopulations, then the age-associated difference observed in this study may be driven by an age-related change in the composition of this subset.
We also explored differences in signaling between AAs and EAs, the two major ethnic groups with sufficient representation in this study cohort for statistical analysis. Because ethnic-related differences have been reported in the prevalence of autoimmune diseases such as systemic lupus erythematosus (30) and multiple sclerosis (31) and in response rates to immunotherapies such as IFN-α (10), Benlysta/belimumab (11), and stem cell transplantation (12), we hypothesized that some of the variation in immune signaling responses may be attributable to racial differences among the study donors. Our assessment of race-associated signaling responses revealed that BCR-induced (anti-IgD) PI3K pathway activity was significantly higher in EAs than in AAs. Although BCR cross-linking can lead to the activation of multiple signaling pathways, BCR-mediated activation of the PI3K pathway has been shown to provide signaling critical for B cell survival (32). Thus, the differences in PI3K pathway activity observed in this study may result in racial differences in B cell fate in response to BCR stimulation. Further dissection of BCR signaling in healthy donors is needed to assess whether other pathways activated by BCR stimulation, such as NF-κBand the MAPK pathway, show race-associated differences in response to IgD cross-linking. To our knowledge, no prior studies have reported a race-associated difference in BCR signaling pathway activation.
In this study, the mean age for the donor cohort was 49 y, with very few donors >65 y old. Future studies that include more elderly donors are needed to assess whether the age associations and race associations identified in this donor cohort are maintained in elderly donor populations (i.e., >65 y). A second limitation of this study was the relatively low proportion of female donors, which precluded an analysis of gender-based differences in immune signaling responses. These limitations can be addressed in future studies by applying SCNP to additional PBMC samples from healthy individuals with a wide range of demographic characteristics.
In conclusion, this work has demonstrated the utility of the SCNP technology in providing a systems-level description of immune signaling responses within interdependent immune cell subpopulations. Applying this approach to the characterization of immune cell signaling in a cohort of healthy donors allowed for the quantification of the range of signaling across donors and revealed tight ranges for the immune signaling responses measured, suggesting that the activation of these signaling nodes may be highly regulated in healthy individuals. Although intersubject differences in immune signaling responses were generally quite low, within the subset of nodes that displayed the most substantial interdonor variation, some of the variation in immune signaling pathway activation could be attributed to differences in demographic factors such as age or race. Future studies with independent sample sets will extend the approach taken in this study to investigate potential differences in immune signaling between genders, among additional ethnic populations, and across a wider age range. Future work will also analyze the degree of intradonor variation in immune signaling responses by applying SCNP to samples collected from healthy donors across multiple time points. Further, the breadth of immunobiology examined will be expanded by using additional surface markers and intracellular readouts to characterize an even higher number of immune cell subpopulations and immune signaling pathways. Overall, the healthy immune cell signaling network map generated in this study provides a reference for comparison with network maps generated under disease-associated conditions using samples from patients at baseline or over the course of therapeutic intervention to identify immune network restructuring that is thought to occur under therapeutic pressure and to guide therapeutic selection.
Supplementary Material
Acknowledgments
We thank all of the donors who have donated samples for this study. We also thank the members of the Nodality research laboratory for technical assistance, Norman Purvis and Danyel Specht for manufacturing Ab cocktails, and David Spellmeyer for useful comments and insights into the presentation of the data.
Abbreviations used in this article
- AA
African American
- EA
European American
- ERF
equivalent number of reference fluorophores
- PCA
principal component analysis
- SCNP
single-cell network profiling
Footnotes
The online version of this article contains supplemental material.
Disclosures D.M.L., B.L., S.P., E.E., J.P., J.C., R.E.H., and A.C. are employees of Nodality Inc. The other authors have no financial conflicts of interest.
References
- 1.Schubert C. Systems immunology: complexity captured. Nature. 2011;473:113–114. doi: 10.1038/nj7345-113a. [DOI] [PubMed] [Google Scholar]
- 2.Irish JM, Hovland R, Krutzik PO, Perez OD, Bruserud Ø , Gjertsen BT, Nolan GP. Single cell profiling of potentiated phospho-protein networks in cancer cells. Cell. 2004;118:217–228. doi: 10.1016/j.cell.2004.06.028. [DOI] [PubMed] [Google Scholar]
- 3.Butcher EC, Berg EL, Kunkel EJ. Systems biology in drug discovery. Nat. Biotechnol. 2004;22:1253–1259. doi: 10.1038/nbt1017. [DOI] [PubMed] [Google Scholar]
- 4.Pos Z, Selleri S, Spivey TL, Wang JK, Liu H, Worschech A, Sabatino M, Monaco A, Leitman SF, Falus A, et al. Genomic scale analysis of racial impact on response to IFN-alpha. Proc. Natl. Acad. Sci. USA. 2010;107:803–808. doi: 10.1073/pnas.0913491107. [DOI] [PMC free article] [PubMed] [Google Scholar]
- 5.Krutzik PO, Nolan GP. Intracellular phospho-protein staining techniques for flow cytometry: monitoring single cell signaling events. Cytometry A. 2003;55:61–70. doi: 10.1002/cyto.a.10072. [DOI] [PubMed] [Google Scholar]
- 6.Purvis N, Stelzer G. Multi-platform, multi-site instrumentation and reagent standardization. Cytometry. 1998;33:156–165. [PubMed] [Google Scholar]
- 7.Wang L, Gaigalas AK, Yan M. Quantitative fluorescence measurements with multicolor flow cytometry. Methods Mol. Biol. 2011;699:53–65. doi: 10.1007/978-1-61737-950-5_3. [DOI] [PubMed] [Google Scholar]
- 8.Jolliffe IT. Principal Components Analysis. Springer; New York: 2002. [Google Scholar]
- 9.Dmitrienko A, Tamhane AC. Gatekeeping procedures with clinical trial applications. Pharm. Stat. 2007;6:171–180. doi: 10.1002/pst.291. [DOI] [PubMed] [Google Scholar]
- 10.Ge D, Fellay J, Thompson AJ, Simon JS, Shianna KV, Urban TJ, Heinzen EL, Qiu P, Bertelsen AH, Muir AJ, et al. Genetic variation in IL28B predicts hepatitis C treatment-induced viral clearance. Nature. 2009;461:399–401. doi: 10.1038/nature08309. [DOI] [PubMed] [Google Scholar]
- 11.Ratner M. Benlysta makes history. Nat. Biotechnol. 2011;29:298. [Google Scholar]
- 12.Mielcarek M, Gooley T, Martin PJ, Chauncey TR, Young BA, Storb R, Torok-Storb B. Effects of race on survival after stem cell transplantation. Biol. Blood Marrow Transplant. 2005;11:231–239. doi: 10.1016/j.bbmt.2004.12.327. [DOI] [PubMed] [Google Scholar]
- 13.Larangé A, Antonios D, Pallardy M, Kerdine-Römer S. TLR7 and TLR8 agonists trigger different signaling pathways for human dendritic cell maturation. J. Leukoc. Biol. 2009;85:673–683. doi: 10.1189/jlb.0808504. [DOI] [PubMed] [Google Scholar]
- 14.Hall JC, Rosen A. Type I interferons: crucial participants in disease amplification in autoimmunity. Nat. Rev. Rheumatol. 2010;6:40–49. doi: 10.1038/nrrheum.2009.237. [DOI] [PMC free article] [PubMed] [Google Scholar]
- 15.van Boxel-Dezaire AHH, Stark GR. Cell type-specific signaling in response to interferon-gamma. Curr. Top. Microbiol. Immunol. 2007;316:119–154. doi: 10.1007/978-3-540-71329-6_7. [DOI] [PubMed] [Google Scholar]
- 16.Weng N-P. Aging of the immune system: how much can the adaptive immune system adapt? Immunity. 2006;24:495–499. doi: 10.1016/j.immuni.2006.05.001. [DOI] [PMC free article] [PubMed] [Google Scholar]
- 17.Haynes L, Swain SL. Why aging T cells fail: implications for vaccination. Immunity. 2006;24:663–666. doi: 10.1016/j.immuni.2006.06.003. [DOI] [PMC free article] [PubMed] [Google Scholar]
- 18.Czesnikiewicz-Guzik M, Lee W-W, Cui D, Hiruma Y, Lamar DL, Yang Z-Z, Ouslander JG, Weyand CM, Goronzy JJ. T cell subset-specific susceptibility to aging. Clin. Immunol. 2008;127:107–118. doi: 10.1016/j.clim.2007.12.002. [DOI] [PMC free article] [PubMed] [Google Scholar]
- 19.Nelms K, Keegan AD, Zamorano J, Ryan JJ, Paul WE. The IL-4 receptor: signaling mechanisms and biologic functions. Annu. Rev. Immunol. 1999;17:701–738. doi: 10.1146/annurev.immunol.17.1.701. [DOI] [PubMed] [Google Scholar]
- 20.Curtsinger JM, Valenzuela JO, Agarwal P, Lins D, Mescher MF. Type I IFNs provide a third signal to CD8 T cells to stimulate clonal expansion and differentiation. J. Immunol. 2005;174:4465–4469. doi: 10.4049/jimmunol.174.8.4465. [DOI] [PubMed] [Google Scholar]
- 21.Kolumam GA, Thomas S, Thompson LJ, Sprent J, Murali-Krishna K. Type I interferons act directly on CD8 T cells to allow clonal expansion and memory formation in response to viral infection. J. Exp. Med. 2005;202:637–650. doi: 10.1084/jem.20050821. [DOI] [PMC free article] [PubMed] [Google Scholar]
- 22.Morishima N, Mizoguchi I, Okumura M, Chiba Y, Xu M, Shimizu M, Matsui M, Mizuguchi J, Yoshimoto T. A pivotal role for interleukin-27 in CD8+ T cell functions and generation of cytotoxic T lymphocytes. J. Biomed. Biotechnol. 2010;2010:605483. doi: 10.1155/2010/605483. [DOI] [PMC free article] [PubMed] [Google Scholar]
- 23.Effros RB. Telomerase induction in T cells: a cure for aging and disease? Exp. Gerontol. 2007;42:416–420. doi: 10.1016/j.exger.2006.11.005. [DOI] [PMC free article] [PubMed] [Google Scholar]
- 24.Lin JX, Leonard WJ. The role of Stat5a and Stat5b in signaling by IL-2 family cytokines. Oncogene. 2000;19:2566–2576. doi: 10.1038/sj.onc.1203523. [DOI] [PubMed] [Google Scholar]
- 25.Moriggl R, Topham DJ, Teglund S, Sexl V, McKay C, Wang D, Hoffmeyer A, van Deursen J, Sangster MY, Bunting KD, et al. Stat5 is required for IL-2-induced cell cycle progression of peripheral T cells. Immunity. 1999;10:249–259. doi: 10.1016/s1074-7613(00)80025-4. [DOI] [PubMed] [Google Scholar]
- 26.Linton PJ, Haynes L, Klinman NR, Swain SL. Antigen-independent changes in naive CD4 T cells with aging. J. Exp. Med. 1996;184:1891–1900. doi: 10.1084/jem.184.5.1891. [DOI] [PMC free article] [PubMed] [Google Scholar]
- 27.Fülöp T, Jr., Larbi A, Dupuis G, Pawelec G. Ageing, autoimmunity and arthritis: Perturbations of TCR signal transduction pathways with ageing - a biochemical paradigm for the ageing immune system. Arthritis Res. Ther. 2003;5:290–302. doi: 10.1186/ar1019. [DOI] [PMC free article] [PubMed] [Google Scholar]
- 28.Fulop T, Larbi A, Douziech N, Levesque I, Varin A, Herbein G. Cytokine receptor signalling and aging. Mech. Ageing Dev. 2006;127:526–537. doi: 10.1016/j.mad.2006.01.025. [DOI] [PubMed] [Google Scholar]
- 29.Monteiro M, Evaristo C, Legrand A, Nicoletti A, Rocha B. Cartography of gene expression in CD8 single cells: novel CCR7- subsets suggest differentiation independent of CD45RA expression. Blood. 2007;109:2863–2870. doi: 10.1182/blood-2006-06-027060. [DOI] [PubMed] [Google Scholar]
- 30.McCarty DJ, Manzi S, Medsger TA, Jr., Ramsey-Goldman R, LaPorte RE, Kwoh CK. Incidence of systemic lupus erythematosus. Race and gender differences. Arthritis Rheum. 1995;38:1260–1270. doi: 10.1002/art.1780380914. [DOI] [PubMed] [Google Scholar]
- 31.Rosati G. The prevalence of multiple sclerosis in the world: an update. Neurol. Sci. 2001;22:117–139. doi: 10.1007/s100720170011. [DOI] [PubMed] [Google Scholar]
- 32.Srinivasan L, Sasaki Y, Calado DP, Zhang B, Paik JH, DePinho RA, Kutok JL, Kearney JF, Otipoby KL, Rajewsky K. PI3 kinase signals BCR-dependent mature B cell survival. Cell. 2009;139:573–586. doi: 10.1016/j.cell.2009.08.041. [DOI] [PMC free article] [PubMed] [Google Scholar]
Associated Data
This section collects any data citations, data availability statements, or supplementary materials included in this article.