Abstract
To investigate correlations between phenotypic adaptation to water limitation and drought-induced gene expression, we have studied a model system consisting of a drought-tolerant line (R1) and a drought-sensitive line (S1) of sunflowers (Helianthus annuus L.) subjected to progressive drought. R1 tolerance is characterized by the maintenance of shoot cellular turgor. Drought-induced genes (HaElip1, HaDhn1, and HaDhn2) were previously identified in the tolerant line. The accumulation of the corresponding transcripts was compared as a function of soil and leaf water status in R1 and S1 plants during progressive drought. In leaves of R1 plants the accumulation of HaDhn1 and HaDhn2 transcripts, but not HaElip1 transcripts, was correlated with the drought-adaptive response. Drought-induced abscisic acid (ABA) concentration was not associated with the varietal difference in drought tolerance. Stomata of both lines displayed similar sensitivity to ABA. ABA-induced accumulation of HaDhn2 transcripts was higher in the tolerant than in the sensitive genotype. HaDhn1 transcripts were similarly accumulated in the tolerant and in the sensitive plants in response to ABA, suggesting that additional factors involved in drought regulation of HaDhn1 expression might exist in tolerant plants.
Whole plants respond to drought through morphological, physiological, and metabolic modifications occurring in all plant organs. At the cellular level plant responses to water deficit may result from cell damage, whereas other responses may correspond to adaptive processes. Although a large number of drought-induced genes have been identified in a wide range of plant species, a molecular basis for plant tolerance to water stress remains far from being completely understood (Ingram and Bartels, 1996). The rapid translocation of ABA in shoots via xylem flux and the increase of ABA concentration in plant organs correlate with the major physiological changes that occur during plant response to drought (Zeevaart and Creelman, 1988). It is widely accepted that ABA mediates general adaptive responses to drought. However, there is evidence suggesting that additional signals are involved in this process (Munns and King, 1988; Trejo and Davies, 1991; Munns et al., 1993; Griffiths and Bray, 1996).
Six cDNAs corresponding to transcripts up-regulated by water stress were isolated previously from a drought-tolerant sunflower (Helianthus annuus L.) line, R1 (Ouvrard et al., 1996). Comparison of the steady-state level of transcripts between the R1 line and a closely related drought-sensitive line, S1, has shown that three of those transcripts (HaElip1, HaDhn1, and HaDhn2) were differently accumulated in tolerant compared with sensitive plants during water deficit. In response to exogenous ABA in leaves of the R1 genotype, HaDhn1 and HaDhn2 transcripts were up-regulated and the steady-state level of HaElip1 transcripts was not modified (Ouvrard et al., 1996). HaDhn1- and HaDhn2-deduced proteins belong to the dehydrin family, and HaElip1 is a related homolog of early-light-induced protein (ELIP).
Among the water-stress-induced proteins so far identified, dehydrins, the D-11 subgroup of late-embryogenesis-abundant (LEA) proteins (Dure et al., 1989) are frequently observed, and more than 65 plant dehydrin sequences are available (Close, 1997). Dehydrins are highly abundant in desiccation-tolerant seed embryos and accumulate during periods of water deficit in vegetative tissues. These proteins display particular structural features such as the highly conserved Lys-rich domain predicted to be involved in hydrophobic interaction leading to macromolecule stabilization (Close, 1996).
Very little is known about dehydrin functions in planta. Studies have established correlations between drought adaptation and dehydrin accumulation in wheat and poplar (Labhilili et al., 1995; Pelah et al., 1997). Positive correlations were also reported for species tolerant to stresses that have a dehydrative component such as salt stress (Galvez et al., 1993; Moons et al., 1995) and freezing and cold stress (Arora and Wisniewski, 1994; Danyluk et al., 1994; Close, 1996; Artlip et al., 1997). Physiological observations associated with the varietal difference in tolerance have been reported (Moons et al., 1995; Pelah et al., 1997). In most of the published studies gene expression was described as a function of time after the stress was applied rather than as a function of parameters describing the plant's water status. Therefore, it is difficult to determine from these data precise relationships between plant physiological responses to drought and drought-induced gene expression.
In the present paper we report putative correlations between the preferential accumulation of dehydrins and HaElip1 transcripts in tolerant plants and physiological parameters describing plant hydric status during progressive drought. The accumulation of transcripts is compared between the two lines as a function of soil water content and leaf water potential. Drought-induced ABA level, ABA-induced stomatal closure, and ABA-induced accumulation of HaDhn1 and HaDhn2 transcripts is compared between both lines. Results are discussed with regard to a possible role of the genes related to drought adaptation in plants.
MATERIALS AND METHODS
Plant Material and Growth
The R1 (drought-tolerant) and S1 (drought-sensitive) genotypes of sunflowers (Helianthus annuus L.) were supplied by Rhône-Poulenc Agrochimie (Lyon, France) and have been described previously (Ouvrard et al., 1996). Seeds of each genotype were surface sterilized with 1% (w/v) sodium hypochlorite and germinated on water-moistened filter paper for 48 h in the dark at 25°C. Depending on the treatment, seedlings were transferred in composite soil (peat compost:vermiculite, 1:1) or in vermiculite. Plants were grown in a greenhouse under 16 h of light, 24/25°C (night/day), 60 to 80% RH, and 300 μE m−2 s−1 minimum light.
Drought Treatment
Plants of each line were grown in composite soil (peat compost:vermiculite, 1:1) for 15 d in a 0.5-L pot and were then transferred to a 3-L pot. Plants were watered daily and fertilized weekly with a complete nutrient solution. One-month-old plants of each line were subjected to progressive drought by withholding water. Control plants of each line were watered daily. Every day, young, fully expanded leaves were collected from individual plants of each line for physiological measurements and frozen separately for RNA extraction. Each pot was weighed daily at 9 am and gravimetric soil water content was measured as grams of water per gram of oven-dried soil. The predawn leaf water potential (Tardieu et al., 1990) and the leaf water potential were measured daily, 1 h before sunrise (5 am, solar time) and at midday (12 pm, solar time), respectively, using a pressure chamber. Each measurement was replicated on four to six individual, nonirrigated plants and three control plants of each line. At midday, 100 μL of xylem sap was extracted at a pressure of about 0.5 MPa above the balancing pressure. Sap samples were stored at −80°C for subsequent ABA analysis by radioimmunoassay (Quarrie et al., 1988). Throughout the experiment, the light intensity measured at midday was between 600 and 800 μE m−2 s−1. The experiment was repeated once.
ABA Treatment
Forty seedlings of each line were transferred to a 0.5-L pot containing vermiculite and grown in a greenhouse. Pots were soaked every day in complete nutrient solution. Three-week-old plants were transferred to hydroponic conditions in 1× Hoagland solution (Hewitt and Smith, 1975), which was renewed every 2 d. ABA was added to a final concentration of 10 μm 5 d after the transfer at 6 am (solar time). Stomatal conductance was measured from 8 am to 4 pm (solar time) using a diffusion porometer (Delta T, Cambridge Life Sciences, Cambridge, UK). Twenty plants of each line were treated with ABA as described above and the other plants were used as controls. The experiment was repeated once.
Nomenclature
Nomenclature for sdi genes corresponding to specific cDNA clones isolated previously from sunflowers (Ouvrard et al., 1996) will be introduced here according to the homology of the deduced protein with known proteins. sdi-1 (accession No. X02646), sdi-5 accession No. X92647), and sdi-8 (accession No. X92650) were renamed HaElip1, HaDhn1, and HaDhn2, respectively.
Northern Analysis
Total RNA was extracted as described previously (Ausubel et al., 1991). Total RNA samples (10 μg) were resolved by electrophoresis on Mops-formaldehyde agarose gel (Lehrach et al., 1977) and blotted to a Hybond-N nylon membrane (Amersham). Northern-blot hybridizations to randomly primed radiolabeled probes (Prime-a-Gene Labeling System, Promega) were performed at 46°C in 50% formamide, 5× SSPE (0.72 m NaCl, 0.05 m NaH2PO4, and 5 mm EDTA, pH 7.4), 1% Sarkosyl (Sigma), 10% dextran sulfate, and 100 μg/mL salmon sperm DNA. Membranes were washed at room temperature in 2× SSC and 0.1% SDS for 20 min, at 46°C in the same buffer for 20 min, and then twice at 55°C in 0.1× SSC and 0.1% SDS for 20 min. The BamHI 25S rDNA fragment from H. annuus HA89 was used as a control probe (Choumane and Heizmann, 1988). Signal intensities of autoradiograms were quantified with imaging software (version 2.03, Appligene, Pleasanton, CA) and subsequently analyzed with NIH Images version 1.57 software. Each signal determination was repeated at least twice, and each blot was triplicated. Loading differences were less than 10% in blots presented in this paper.
Isolation of Genomic DNA and Southern Analysis
Genomic DNA was extracted from leaves according to the method of Dellaporta et al. (1983). DNA (15 μg) was digested by restriction endonucleases and resolved by electrophoresis on 0.8% Tris-acetate-EDTA-agarose gels. DNA was blotted to a Hybond-N+ nylon membrane (Amersham) in 0.4 n NaOH. Hybridization at 42°C and washes were performed as described for the northern analysis.
RESULTS
Amino Acid Sequence Comparison of HaDhn1 and HaDhn2 Dehydrins
The HaDhn1 cDNA sequence was reported previously (Ouvrard et al., 1996). The complete nucleotide sequence of the full-length HaDhn2 cDNA was determined. HaDhn1- and HaDhn2-deduced proteins belong to the dehydrin family (Ouvrard et al., 1996) and share the characteristic features of these proteins. Dehydrins are characterized by three consensus sequences referred to as segments Y, S, and K (Close, 1996). Dehydrins were classified into five distinct types using the YSK nomenclature and depending on the copy numbers of each segment (Close, 1996). HaDhn1 belongs to the YnSK2 type of dehydrin and HaDhn2 belongs to the SK2 type.
Genomic Organization of HaDhn1, HaDhn2, and HaElip1 Genes
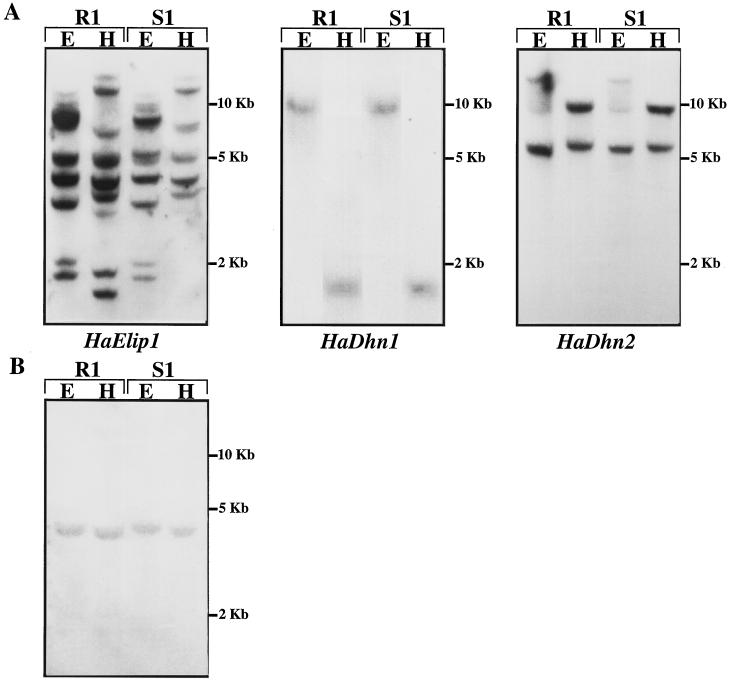
Southern experiments were performed using each cDNA insert as a probe (Fig. 1A). Hybridization patterns indicated that homologs of the R1 genes were present in the S1 genome.
Figure 1.
Southern analysis of genomic DNA from R1 and S1 sunflower genotypes. Total DNA was digested with EcoRI (E) and HindIII (H), separated on an agarose gel, and transferred to a nylon membrane. A, Membranes were probed with 32P-labeled cDNA as indicated. B, Membrane was probed with the 3′ noncoding region of HaElip1 cDNA (nucleotides 559 to 795 of HaElip1 cDNA full-length sequence).
Complex hybridization patterns were observed with HaElip1 cDNA in both genotypes, indicating that this sequence belongs to a multigenic family. R1 and S1 genotypes displayed similar hybridization patterns, except for the presence of two additional low-molecular-weight HindIII fragments in the R1 genome. The experiment was repeated using the 3′ noncoding region of HaElip1 (HaElip1/3′ end) cDNA as a probe (Fig. 1B). Southern analysis with the 3′ end-specific probe revealed a single hybridizing fragment in both genotypes, indicating that this probe is probably specific to one of the HaElip1 genes that are common to both genotypes. Therefore, the HaElip1/3′ end-specific probe was used for all of the northern experiments described in this paper.
Identical hybridization patterns showing a single hybridizing fragment were obtained with HaDhn1 cDNA in both lines. HaDhn1 is likely to be present as a single-copy gene in both genotypes. A low number of hybridizing fragments was obtained with HaDhn2 cDNA, suggesting that the corresponding genes are present in the genome at a low copy number. The hybridization pattern obtained with HaDhn2 was identical in both genotypes, indicating that the HaDhn2 genomic organization is similar in the two lines.
Physiological Characterization of Drought Stress
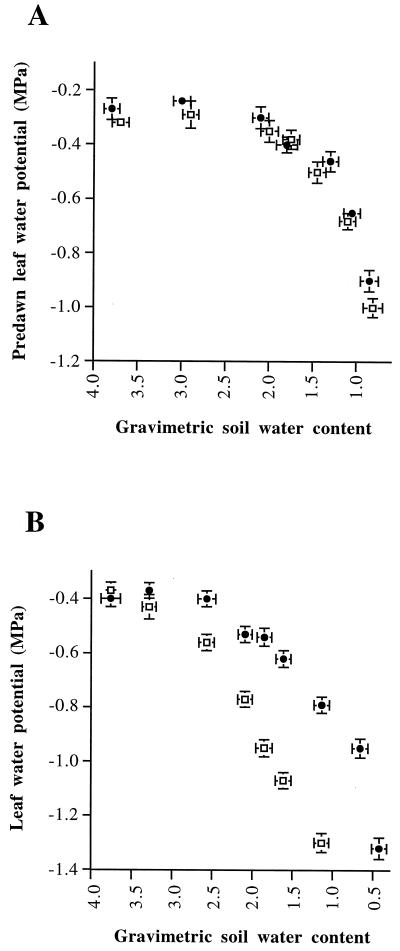
Progressive drought was initiated by withholding water from plants grown in soil. Soil and leaf water statuses of R1 and S1 plants were monitored by measuring the gravimetric soil water content and the leaf water potential. The leaf water potential evaluates the water-stress intensity sensed by leaves (Hsiao, 1973). Soil water potential was estimated by measuring the predawn leaf water potential, as described previously (Tardieu et al., 1990). The predawn leaf water potential is an averaged indicator of soil water status near the root system. The predawn leaf water potential and the gravimetric soil water content evaluate the hydric conditions experienced within the soil. Both parameters decreased similarly for R1 and S1 lines after the last watering (Fig. 2A). The predawn leaf water potential of irrigated plants remained between −0.2 and −0.25 MPa during the experiment.
Figure 2.
Soil and leaf water status of R1 (•) and S1 (□) plants during progressive drought initiated by withholding water. A, Predawn leaf water potential as a function of gravimetric soil water content (grams of water per gram of dry soil). B, Leaf water potential as a function of gravimetric soil water content (grams of water per gram of dry soil). Leaf water potential and gravimetric soil water content values are the means ± se of four to six measurements determined from four to six individual plants.
As reported previously (Ouvrard et al., 1996), the leaf water potential of the tolerant, nonirrigated plants started to decline after a delay, and this rate of decrease was lower than the leaf water potential of sensitive, nonirrigated plants (Fig. 2B). Wilting of S1 leaves was observed with a soil water content of 2.1 g water g−1 dry soil, whereas R1 leaves were wilted with a soil water content value of less than 0.5 g water g−1 dry soil.
Time Course of Accumulation of HaDhn1, HaDhn2, and HaElip1 Transcripts in R1 and S1 Sunflower Plants during Progressive Drought
The accumulation of HaDhn1, HaDhn2, and HaElip1 transcripts was compared in the R1 and S1 sunflower lines as a function of soil and leaf water status during progressive drought. Fully expanded leaves from four to six individual plants of each line were collected and analyzed separately (Fig. 2B). Total RNA was extracted and analyzed by northern hybridization using each cDNA as a probe. An equal amount of RNA loading was systematically assessed by probing each blot with a 25S rDNA (Choumane and Heizmann, 1988).
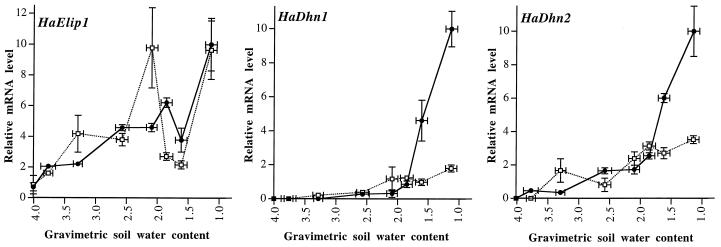
The accumulation of HaDhn1, HaDhn2, and HaElip1 transcripts was compared in plants of the two lines as a function of soil water content (Fig. 3). The steady-state level of HaElip1 transcripts increased rapidly in response to soil dehydration in both lines. HaElip1 transcripts did not accumulate simply as a function of soil water content. The pattern of accumulation was similar in the two lines, although weak differences were observed. HaDhn1 and HaDhn2 transcripts, which were not detected in plants watered daily, accumulated in response to soil dehydration in leaves of both lines. Major differences were observed between the R1 and the S1 plants. In the sensitive plants, the steady-state level of these transcripts increased gradually until the soil water content reached a value of 2 g water g−1 dry soil and then remained unchanged as the soil water content decreased. In the R1 plants, when the soil water content declined below this value, the steady-state levels of HaDhn1 and HaDhn2 transcripts were strongly increased. For a soil water content of 1.1 g water g−1 dry soil, HaDhn1 and HaDhn2 transcripts accumulated 5- and 3-fold higher, respectively, in leaves of R1 compared with S1 plants.
Figure 3.
Accumulation of HaDhn1, HaDhn2, and HaElip1 transcripts in leaves of R1 and S1 plants subjected to progressive drought as a function of gravimetric soil water content (grams of water per gram of dry soil). Total RNA was purified from R1 (•) or S1 (□) individual leaves collected as indicated from all of the plants described in Figure 2B. RNA (10 μg) was analyzed by northern-blot hybridization using HaDhn1, HaDhn2, and HaElip1/3′ end as probes. Hybridization signals were quantified by densitometric analysis. The strongest hybridization signal was set at 10 and the others were quantified on the basis of this signal. The relative mRNA levels are the means ± se of four to six measurements quantified separately from individual plants. Gravimetric soil water content values are the means of measurements determined on the corresponding plants described in Figure 2B.
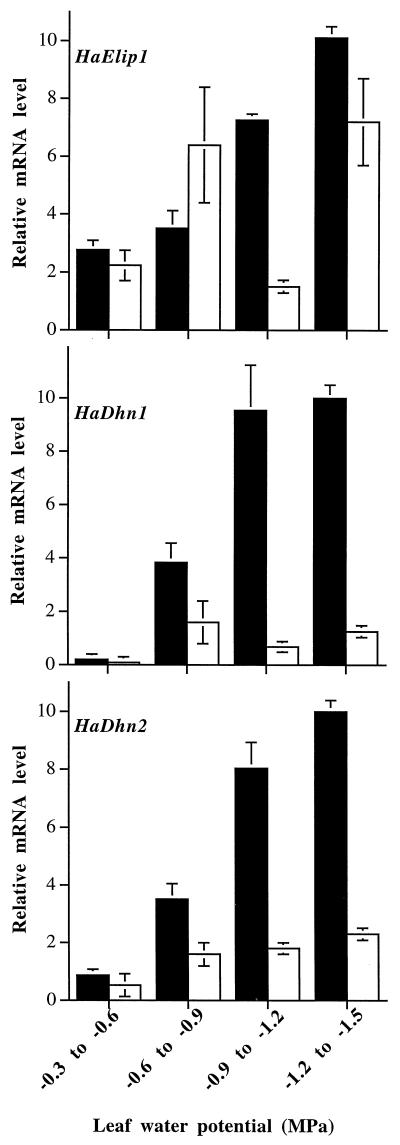
Because plants of the two lines clearly displayed different leaf water potentials when the gravimetric soil water content was the same, the above data are not fully representative of the relationship between transcript accumulation and leaf hydric status. Therefore, the accumulation of each transcript was compared in R1 and S1 plants as a function of their leaf water potential (Fig. 4). Equivalent leaf water potentials were observed in R1 and S1 plants for different soil water contents (Fig. 2B). In leaves with water potentials between −0.3 and −0.6 MPa, each transcript accumulated at a similar level in both lines. Below these values, the accumulation of HaElip1, HaDhn1, and HaDhn2 transcripts was different between R1 and S1 plants.
Figure 4.
Accumulation of HaDhn1, HaDhn2, and HaElip1 transcripts as a function of leaf water potential in R1 and S1 plants subjected to progressive drought. Total RNA was purified from R1 (black bars) or S1 (white bars) individual leaves collected separately from the plants described in Figure 2B. RNA (10 μg) was analyzed by northern-blot hybridization using HaDhn1, HaDhn2, and HaElip1/3′ end as probes. Hybridization signals were quantified by densitometric analysis. The strongest hybridization signal was set at 10 and the others were quantified on the basis of this signal. The relative mRNA levels are the means ± se of 6 to 10 measurements quantified separately from individual plants.
In leaves of R1 plants, the steady-state level of each transcript increased gradually as the water potential declined. In the S1 plants the fluctuations of the steady-state level of HaElip1 transcripts were not correlated with the decreases in leaf water potential. Similar levels of HaElip1 transcripts were accumulated in S1 and R1 plants except in leaves with water potentials between −0.9 and −1.2 MPa. Steady-state levels of HaDhn1 and HaDhn2 transcripts in S1 plants remained low and constant in leaves with a water potential of less than −0.6 MPa. At an equivalent water potential, they accumulated at a higher level in R1 than in S1 leaves. At a leaf water potential between −1.2 and −1.5 MPa, steady-state levels were 9- and 5-fold higher, respectively, in leaves of R1 compared with S1 plants.
Changes in Xylem ABA Concentration upon Progressive Drought and ABA-Induced Expression of HaDhn1 and HaDhn2 Genes
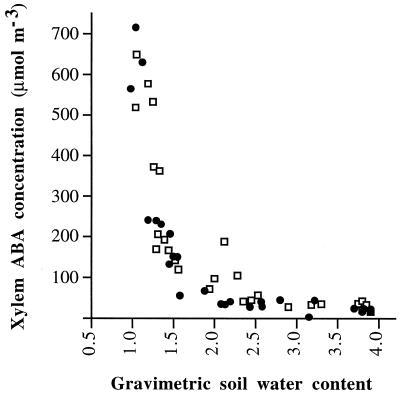
Time-course measurements of ABA concentration in xylem sap upon progressive drought were compared in both R1 and S1 sunflower lines (Fig. 5). The decline in soil water content induced a similar increase in xylem ABA concentration in R1 and S1 plants.
Figure 5.
Concentration of ABA in R1 (•) and S1 (□) xylem sap as a function of soil water content (grams of water per gram of dry soil). Each point represents a coupled value of xylem ABA of one leaf and the soil water content of the corresponding plant. Data are the result of one representative experiment.
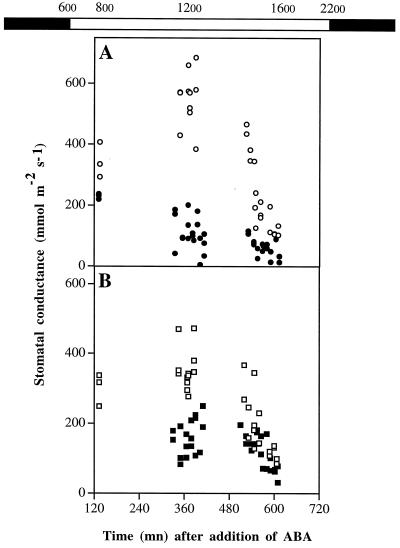
R1 and S1 plants were grown under hydroponic conditions to allow an exogenous supply of ABA. ABA was added 6 h before midday (6 am solar time). To monitor the response of plants to exogenous ABA, the stomatal conductance of R1 and S1 sunflower plants was measured during ABA treatment (Fig. 6). For plants of both lines the stomatal closure occurred within 6 h after the addition of ABA. From midday to 4 pm stomatal conductance of ABA-treated plants was lower in R1 than in S1. At midday untreated R1 plants displayed higher maximal conductances than untreated S1 plants. However, when the abaxial and adaxial stomata were counted, this difference was found not to be due to a higher density of stomata in R1 than in S1 leaves (data not shown).
Figure 6.
Stomatal conductance of R1 (A) and S1 (B) in response to ABA. Plants were grown in hydroponic conditions supplemented (•, ▪) or not (○, □) with 10 μm ABA. The addition of ABA was performed at 6 am (solar time). Stomatal conductance was determined from 8 am to the end-of-the-day period on control and ABA-treated R1 and S1 plants. Each point is the mean value of two opposite leaves from the same plant. The bar at the top indicates the light/dark period under which the plants were grown (white bar, light period; black bar, dark period). Hours refer to the solar time at which the measurements were determined.
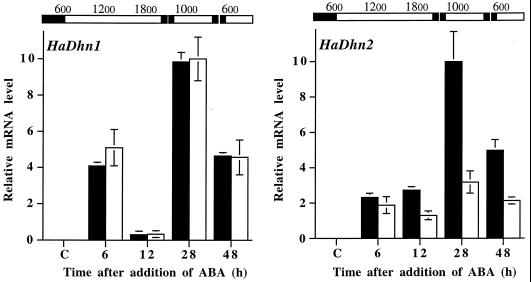
Total RNA was purified from fully expanded leaves collected separately from three to four individual plants of each line and analyzed by northern hybridization. Because previous work demonstrated that the accumulation of HaDhn1 and HaDhn2 transcripts, but not HaElip1 transcripts, was modified in response to ABA, only HaDhn1 and HaDhn2 cDNAs were used as probes (Fig. 7). HaDhn1 and HaDhn2 transcripts were detected in both lines after 6 h of treatment. The steady-state level of HaDhn1 transcripts accumulated was equivalent in both lines, regardless of the time after the treatment. It declined to a barely detectable level 12 h after the addition of ABA at the end of the 1st d, then increased to a maximum after 28 h during the 2nd d, and finally decreased again at the beginning of the 3rd d after 48 h of treatment.
Figure 7.
Time course of accumulation of HaDhn1 and HaDhn2 transcripts in response to ABA in leaves of tolerant (black bars) and sensitive (white bars) plants. Total RNA was purified from leaves of R1 and S1 sunflowers cultivated in hydroponic medium supplemented or not with 10 μm of ABA. RNA (10 μg) extracted from plants 6, 12, 28, and 48 h after the addition of ABA or from control plants (lane C) was analyzed by northern-blot hybridization with the indicated probes. Hybridization signals were quantified by densitometric analysis. The strongest hybridization signal was set at 10 and the others were quantified on the basis of this signal. Values are means ± se of three to four independent replicates. The bars at the top indicate the light/dark period under which the plants were grown (white bar, light period; black bar, dark period). Hours refer to the solar time at which the samples were collected.
The oscillation in the amount of ABA-induced HaDhn1 transcripts seemed to follow the day/night cycle of the greenhouse used to grow the plants. The steady-state level of HaDhn2 transcripts that accumulated in response to ABA was equivalent after 6 h of treatment in both lines but later increased to a much higher level in R1 than in S1 plants. In the R1 line the steady-state level of transcripts continued to increase, reaching a maximum after 28 h and then decreasing at 48 h. In S1 only slight variations in the steady-state level of HaDhn2 transcripts were observed and paralleled those occurring in R1.
DISCUSSION
To investigate correlations between phenotypic adaptation to water limitation and drought-induced gene expression, we have characterized a model system consisting of a drought-tolerant (R1) and a drought-sensitive (S1) line of sunflowers subjected to progressive drought. Drought was monitored by measuring the gravimetric soil water content, the predawn leaf water potential, and the leaf water potential. The predawn leaf water potential, which is considered to be an indicator of hydric conditions experienced within the soil (Tardieu et al., 1990), decreased similarly for both lines as a function of the decline of gravimetric soil water content. Therefore, both lines were subjected to an equivalent water limitation.
In anisohydric plants, including sunflowers, leaf water potential has been shown to decrease in response to soil dehydration (Sadras et al., 1993a, 1993b). This was also observed here in the R1 and S1 plants. However, compared with S1, decreases in leaf water potential and wilting were delayed in R1 leaves. In anisohydric species, avoiding a rapid decrease of leaf water potential in response to soil dehydration is likely to correspond to a drought-tolerance mechanism. Since, as shown previously, the osmotic potential decreases similarly in both lines during progressive drought (Ouvrard et al., 1996), R1 tolerance can be characterized by the maintenance of shoot cellular turgor. The maintenance of cellular turgor by lowering the osmotic potential in plants exposed to low-water-potential conditions may be explained by osmotic adjustment (Turner and Jones, 1980), which may occur either through the uptake of solutes or by the breakdown of osmotically inactive compounds (Turner and Jones, 1980). Osmotic adjustment is considered to be one of the most important mechanisms of plant adaptation to environmental stresses affecting water content (Turner, 1986; Munns, 1988). Additional experiments are needed to determine whether such a mechanism is involved in the maintenance of cellular turgor in leaves of R1 plants subjected to water limitation.
Drought-induced genes were previously identified in the drought-tolerant line of sunflowers (Ouvrard et al., 1996). The accumulation of HaDhn1, HaDhn2, and HaElip1 transcripts was compared in tolerant and sensitive plants subjected to progressive drought. The three genes were up-regulated in leaves of plants subjected to soil dehydration. The kinetics of HaElip1 transcript accumulation as a function of soil water content were complex in both lines. In sensitive plants the large fluctuations of the steady-state level of the transcripts suggest that, in addition to water stress, other environmental factors also influenced HaElip1 gene expression. It was reported that light is an essential positive factor regulating dehydration-mediated expression of the Elip-like dsp22 gene (Bartels et al., 1992). In addition, in barley the level of accumulation of the Elip transcript Hv90 was found to depend on light intensity (Montané et al., 1997). Therefore, although leaf samples were collected daily at midday, variations of light intensity during the experiment could have influenced HaElip1 gene expression.
R1 and S1 plants subjected to progressive drought display differential accumulation of HaDhn1 and HaDhn2 transcripts in leaves. Both transcripts accumulated to much higher levels in R1 than in S1 plants as the soil water content declined toward low values. This difference was also observed in R1 and S1 plants with similar leaf water potentials but with different soil water content. Thus, the low level of HaDhn1 and HaDhn2 transcripts in S1 leaves was not related to the low leaf water potential resulting from water limitation. Furthermore, because HaElip1 transcripts continued to accumulate in S1 leaves with a water potential was of less than −0.9 MPa, it is unlikely that a general shutdown of the transcription rate might occur in the S1 plants during progressive drought. These results suggest that the preferential accumulation of transcripts of the dehydrins HaDhn1 and HaDhn2 in R1 leaves is associated with the adaptive response occurring in these plants subjected to water limitation. However, we cannot rule out the possibility that changes in mRNA processing or stability may be the underlying cause of the observed increase in the mRNA levels.
The differential accumulation of HaDhn1 and HaDhn2 transcripts in tolerant and sensitive plants may result from differences in the genomic organization of the corresponding genes between the two lines. Results of Southern hybridization demonstrate that the R1 line does not possess additional genes compared with the S1 one. We therefore hypothesize that HaDhn1 and HaDhn2 genes are subjected to a different regulation in the two lines.
Varietal differences in tolerance may be associated with increases of ABA levels in response to various environmental stresses. This includes drought tolerance of maize (Pekic and Quarrie, 1987), chilling tolerance of rice seedlings (Lee et al., 1993), and salt tolerance of rice (Moons et al., 1995). Extensive studies have shown that the decrease in leaf conductance is closely related to the increase in xylem ABA, suggesting that ABA can act as a water-stress signal to regulate stomatal conductance (Zhang and Davies, 1989, 1991; Davies and Zhang, 1991; Tardieu et al., 1992).
In sunflowers stomatal control depends only on the concentration of ABA in the xylem sap (Tardieu et al., 1996); stomatal closure in response to water stress is one of the drought-adaptation mechanisms. However, the concentration of ABA in xylem sap was equivalent in tolerant and sensitive sunflowers subjected to water deficit, indicating that this parameter is not related to varietal differences in tolerance of the R1 and S1 lines. Furthermore, the kinetics of stomatal closure in response to exogenous ABA were equivalent in both lines, indicating that R1 and S1 plants display similar sensitivity to ABA in regard to this physiological response.
ABA is involved in drought regulation of many genes (Chandler and Robertson, 1994; Giraudat et al., 1994). Dehydrin genes are up-regulated in response to exogenous ABA in vegetative tissues (for review, see Bray, 1994). ABA-induced expression of HaDhn1 and HaDhn2 was compared in the two varieties. HaDhn2 transcripts accumulated to a higher level in the R1 compared with the S1 plants in response to exogenously applied ABA. Therefore, the preferential accumulation of HaDhn2 transcripts in the tolerant plants in response to drought could be ABA mediated. The accumulation of HaDhn2 transcripts at a low level in the S1 line during drought may result from different ABA sensitivities of the corresponding genes between R1 and S1 plants.
The changes in the steady-state levels of HaDhn1 transcripts in response to ABA were equivalent in both lines, regardless of the duration of the treatment. Even though xylem ABA was equivalent in both lines, the total leaf ABA content varied and could therefore explain the preferential accumulation of HaDhn1 transcripts in the R1 plants in response to drought. Additional specific factors other than ABA might also be present in the R1 plants, triggering HaDhn1 transcript accumulation upon drought conditions.
Although HaDhn1 and HaDhn2 belong to the same protein family, they respond differently to applied ABA, both in the tolerant and in the sensitive plants. A differential response of dehydrin-related genes to ABA treatments has already been described in rice (Yamaguchi-Shinozaki et al., 1989), pea (Robertson and Chandler, 1994), and Arabidopsis thaliana (Welin et al., 1994), suggesting that the various members of this family may have different functions in drought responses in plants.
It has been reported that dehydrin accumulation is correlated with slow dehydration when dehydrin accumulation was compared in slowly or rapidly dried cereal seedlings, (for review, see Close et al., 1993). This is supported by the observation in the present study that dehydrin transcripts were preferentially accumulated in leaves in which the water potential decreased slowly in response to drought. Additional experiments have also confirmed that, in R1 sunflowers subjected to a rapid soil dehydration, dehydrin transcripts were accumulated at a lower level than in plants subjected to progressive drought (data not shown).
Although the function of dehydrin in plant cells has not been yet elucidated, several hypotheses, mainly deduced from the protein structure, have been proposed. It has been suggested that dehydrins may stabilize macromolecules through detergent and chaperone-like properties and may act synergistically with compatible solutes (Close, 1996). Dehydrin would protect cytosolic structures from the deleterious effects of cellular dehydration (Baker et al., 1988; Dure et al., 1989; Close, 1996). In R1 leaves dehydrin transcript accumulation is associated with a tolerance mechanism leading to the maintenance of cellular turgor, suggesting that dehydrins might also be involved in preventing cellular dehydration. However, the accumulation of dehydrin transcripts does not necessarily correlate with the content of the corresponding proteins. This study needs to be extended at the protein level.
ACKNOWLEDGMENTS
We are very grateful to Drs. Alain Gojon, Marc Lepetit, and Jean-Pierre Renaudin for stimulating discussions and critical reading of the manuscript. We also wish to thank Philippe Barrieu (Ecophysiologie des Plantes sous Stress Environnementaux, Institut National de la Recherche Agronomique, Montpellier, France) for endogenous ABA measurements and Hugues Baudot for help with raising the plants.
Footnotes
This work was financially supported by the Bio Avenir program financed by Rhône-Poulenc and by Action Incitative Programmeé no. 924840 from the Institut National de la Recherche Agronomique.
LITERATURE CITED
- Arora R, Wisniewski ME. Cold acclimation in genetically related (sibling) deciduous and evergreen peach (Prunus persica L. Batsch). II. A 60-kilodalton bark protein in cold-acclimated tissues of peach is heat stable and related to the dehydrin family of proteins. Plant Physiol. 1994;105:95–101. doi: 10.1104/pp.105.1.95. [DOI] [PMC free article] [PubMed] [Google Scholar]
- Artlip TS, Callahan AM, Bassett CL, Wisniewski ME. Seasonal expression of a dehydrin gene in sibling deciduous and evergreen genotypes of peach (Prunus persica L. Batsch) Plant Mol Biol. 1997;33:61–70. doi: 10.1023/a:1005787909506. [DOI] [PubMed] [Google Scholar]
- Ausubel FM, Brent R, Kingston RE, Moore DD, Seidman JG, Smith JA, Struhl K (1991) Current Protocols in Molecular Biology. Greene Publishing Associates/Wiley-Interscience, New York
- Baker J, Steele C, Dure L., III Sequence and characterization of 6 Lea proteins and their genes from cotton. Plant Mol Biol. 1988;11:277–291. doi: 10.1007/BF00027385. [DOI] [PubMed] [Google Scholar]
- Bartels D, Hanke C, Schneider K, Michel D, Salamini F. A desiccation-related Elip like gene from the resurrection plant Craterostigma plantagineum is regulated by light and ABA. EMBO J. 1992;11:2771–2778. doi: 10.1002/j.1460-2075.1992.tb05344.x. [DOI] [PMC free article] [PubMed] [Google Scholar]
- Bray EA (1994) Alterations in gene expression in response to water deficit. In AS Basra, ed, Stress Induced Gene Expression in Plants. Harwood Academic Publishers, Ludhiana, India, pp 1–23
- Chandler PM, Robertson M. Gene expression regulated by abscisic acid and its relation to stress tolerance. Annu Rev Plant Physiol Plant Mol Biol. 1994;45:113–141. [Google Scholar]
- Choumane W, Heizmann P. Structure and variability of nuclear ribosomal genes in the genus Helianthus. Theor Appl Genet. 1988;76:481–489. doi: 10.1007/BF00260896. [DOI] [PubMed] [Google Scholar]
- Close TJ. Dehydrins: emergence of a biochemical role of a family of plant dehydration proteins. Physiol Plant. 1996;97:795–803. [Google Scholar]
- Close TJ. Dehydrins: a commonalty in the response of plants to dehydration and low temperature. Physiol Plant. 1997;100:291–296. [Google Scholar]
- Close TJ, Fenton RD, Yang A, Asghar R, DeMason DA, Crone DE, Meyer NC, Moonan F (1993) Dehydrin: the protein. In TJ Close, EA Bray, eds, Plant Responses to Cellular Dehydration during Environmental Stress. American Society of Plant Physiologists, Rockville, MD, pp 104–118
- Danyluk J, Houde M, Rassart E, Sarhan F. Differential expression of a gene encoding an acidic dehydrin in chilling sensitive and freezing tolerant Gramineae species. FEBS Lett. 1994;344:20–24. doi: 10.1016/0014-5793(94)00353-x. [DOI] [PubMed] [Google Scholar]
- Davies WJ, Zhang J. Root signals and the regulation of growth and development of plants in drying soil. Annu Rev Plant Physiol Plant Mol Biol. 1991;42:55–76. [Google Scholar]
- Dellaporta SL, Wood J, Hicks JB. A plant DNA minipreparation: version II. Plant Mol Biol Rep. 1983;1:19–21. [Google Scholar]
- Dure L, III, Crouch M, Harada J, Ho T-HD, Mundy J, Quatrano R, Thomas T, Sung ZR. Common amino acid sequence domains among the LEA proteins of higher plants. Plant Mol Biol. 1989;12:475–486. doi: 10.1007/BF00036962. [DOI] [PubMed] [Google Scholar]
- Galvez AF, Gulick PJ, Dvorak J. Characterization of the early stages of genetic salt-stress responses in salt-tolerant Lophopyrum elongatum, salt-sensitive wheat, and their amphiploid. Plant Physiol. 1993;103:257–265. doi: 10.1104/pp.103.1.257. [DOI] [PMC free article] [PubMed] [Google Scholar]
- Giraudat J, Parcy F, Bertauche N, Gosti F, Leung J, Morris P-C, Bouvier-Durand M, Vartanian N. Current advances in abscisic acid action and signalling. Plant Mol Biol. 1994;26:1557–1577. doi: 10.1007/BF00016490. [DOI] [PubMed] [Google Scholar]
- Griffiths A, Bray EA. Shoot induction of ABA-requiring genes in response to soil drying. J Exp Bot. 1996;47:1525–1531. [Google Scholar]
- Hewitt EJ, Smith TA. Plant mineral nutrition. In: Hewitt EJ, Smith TA, editors. Experimental Methods for the Investigation of Plant Nutrient Requirements. The English. London: University Press; 1975. [Google Scholar]
- Hsiao TC. Plant responses to water stress. Annu Rev Plant Physiol. 1973;24:519–570. [Google Scholar]
- Ingram J, Bartels D. The molecular basis of dehydration tolerance in plants. Annu Rev Plant Physiol Plant Mol Biol. 1996;47:377–403. doi: 10.1146/annurev.arplant.47.1.377. [DOI] [PubMed] [Google Scholar]
- Labhilili M, Joudrier P, Gautier M-F. Characterization of cDNAs encoding Triticum durum dehydrins and their expression patterns in cultivars that differ in drought tolerance. Plant Sci. 1995;112:219–230. [Google Scholar]
- Lee TM, Lur HS, Chu C. Role of abscisic acid in chilling tolerance of rice (Oryza sativa L.) seedlings. I. Endogenous abscisic acid levels. Plant Cell Environ. 1993;16:481–490. [Google Scholar]
- Lehrach H, Diamond D, Wozney JM, Boedtker H. RNA molecular weight determinations by gel electrophoresis under denaturating conditions, a critical reexamination. Biochemistry. 1977;16:4743–4751. doi: 10.1021/bi00640a033. [DOI] [PubMed] [Google Scholar]
- Montané M-H, Dreyer S, Triantaphylides C, Kloppstech K. Early light-inducible proteins during long-term acclimation of barley to photooxidative stress caused by light and cold: high level of accumulation by posttranscriptional regulation. Planta. 1997;202:293–302. [Google Scholar]
- Moons A, Bauw G, Prinsen E, Van Montagu M, Van Der Straeten D. Molecular and physiological responses to abscisic acid and salts in roots of salt-sensitive and salt-tolerant indica rice varieties. Plant Physiol. 1995;107:177–186. doi: 10.1104/pp.107.1.177. [DOI] [PMC free article] [PubMed] [Google Scholar]
- Munns R. Why measure osmotic adjustment? Aust J Plant Physiol. 1988;15:717–726. [Google Scholar]
- Munns R, King RW. Abscisic acid is not the only stomatal inhibitor in the transpiration stream of wheat plants. Plant Physiol. 1988;88:703–708. doi: 10.1104/pp.88.3.703. [DOI] [PMC free article] [PubMed] [Google Scholar]
- Munns R, Passioura JB, Milborrow BV, James RA, Close TJ. Stored xylem sap from wheat and barley in drying soil contains a transpiration inhibitor with a large molecular size. Plant Cell Environ. 1993;16:867–872. [Google Scholar]
- Ouvrard O, Cellier F, Ferrare K, Tousch D, Lamaze T, Dupuis J-M, Casse-Delbart F. Identification and expression of water stress- and abscisic acid-regulated genes in a drought-tolerant sunflower genotype. Plant Mol Biol. 1996;31:819–829. doi: 10.1007/BF00019469. [DOI] [PubMed] [Google Scholar]
- Pekic S, Quarrie SA. Abscisic acid accumulation in maize differing in drought resistance: a comparison of intact and detached leaves. J Plant Physiol. 1987;127:203–217. [Google Scholar]
- Pelah D, Wang W, Altman A, Shoseyov O, Bartels D. Differential accumulation of water stress-related proteins, sucrose synthase and soluble sugars in Populus species that differ in their water stress response. Physiol Plant. 1997;99:153–159. [Google Scholar]
- Quarrie SA, Whitford PN, Appleford MEJ, Wang TL, Cook SK, Henson IE, Loveys BR. A monoclonal antibody to (S)-abscisic acid: its characterization and use in a radioimmunoassay for measuring abscisic acid in crude extracts of cereals and lupin leaves. Planta. 1988;173:330–339. doi: 10.1007/BF00401020. [DOI] [PubMed] [Google Scholar]
- Robertson M, Chandler PM. A dehydrin cognate protein from pea (Pisum sativum L.) with an atypical pattern of expression. Plant Mol Biol. 1994;26:805–816. doi: 10.1007/BF00028850. [DOI] [PubMed] [Google Scholar]
- Sadras VO, Villalobos FJ, Ferreres E. Leaf expansion in field-grown sunflower in response to soil and leaf water status. Agron J. 1993a;85:564–570. [Google Scholar]
- Sadras VO, Villalobos FJ, Ferreres E, Wolfe DW. Leaf responses to soil water deficits: comparative sensitivity of leaf expansion rate and leaf conductance in field-grown sunflower. Plant Soil. 1993b;153:189–194. [Google Scholar]
- Tardieu F, Katerji N, Bethenod O. Relationship between soil water status, predawn leaf water potential and other indicators of the plant water status in maize. Agronomie. 1990;10:617–626. [Google Scholar]
- Tardieu F, Lafarge T, Simonneau T. Stomatal control by fed or endogenous xylem ABA in sunflower: interpretation of correlations between leaf water potential and stomatal conductance in anisohydric species. Plant Cell Environ. 1996;19:75–84. [Google Scholar]
- Tardieu F, Zhang J, Katerji N, Bethenod O, Palmer S, Davies WJ. Xylem ABA controls the stomatal conductance of field-grown maize subjected to soil compaction or soil drying. Plant Cell Environ. 1992;15:193–197. [Google Scholar]
- Trejo CL, Davies WJ. Drought-induced closure of Phaseolus vulgaris L. stomata precedes leaf water deficit and any increase in xylem ABA concentration. J Exp Bot. 1991;42:1507–1515. [Google Scholar]
- Turner NC. Crop water deficits: a decade of progress. Adv Agron. 1986;39:1–51. [Google Scholar]
- Turner NC, Jones MM. Turgor maintenance by osmotic adjustement: a review and evaluation. In: Turner NC, Kramer PJ, editors. Adaptation of Plants to Water and High Temperature Stress. New York: John Wiley & Sons; 1980. pp. 78–103. [Google Scholar]
- Welin BV, Olson A, Nylander M, Palva ET. Characterization and differential expression of dhn/lea/rab-like genes during cold acclimation and drought stress in Arabidopsis thaliana. Plant Mol Biol. 1994;26:131–144. doi: 10.1007/BF00039526. [DOI] [PubMed] [Google Scholar]
- Yamaguchi-Shinozaki K, Mundy J, Chua N-H. Four tightly linked rab genes are differentially expressed in rice. Plant Mol Biol. 1989;14:29–39. doi: 10.1007/BF00015652. [DOI] [PubMed] [Google Scholar]
- Zeevaart JAD, Creelman RA. Metabolism and physiology of abscisic acid. Annu Rev Plant Physiol. 1988;39:439–473. [Google Scholar]
- Zhang J, Davies WJ. Abscisic acid produced in dehydrating roots may enable the plant to measure the water status of the soil. Plant Cell Environ. 1989;12:73–81. [Google Scholar]
- Zhang J, Davies WJ. Antitranspirant activity in xylem sap of maize plants. J Exp Bot. 1991;42:317–321. [Google Scholar]


