

Abstract
This study compared SYBR Green real time quantitative polymerase chain reaction (qPCR) with standard plate counting for the enumeration of Streptococcus mutans in oral samples. Oral samples (N=710) were collected from high caries risk children for quantification of S. mutans using primer pairs by qPCR. S. mutans copy number (CN) was interpolated from qPCR quantification cycle (Cq) of samples compared to a S. mutans UA159 standard suspension. CN sample results were evaluated in relation to standard plate count (SPC) results obtained from each sample following culture on Petri plates using S. mutans selective media reported as colony forming units (CFU). Mean qPCR CN were found to be higher than SPC CFU (1.3 × 10⁶ and 1.5 × 10⁵, respectively). qPCR was usually higher in individual samples and qPCR detected the presence of S. mutans 84% (231/276) of time that SPC did not, compared to 33% (4/12) when qPCR failed to detect. qPCR was found to be more sensitive for detection of S. mutans from oral samples; a method that is not dependent on the viability of the sample taken and, therefore, is proposed as a more reliable and efficient means of quantification of S. mutans.
Keywords: Streptococcus mutans, Real time Quantitative Polymerase Chain Reaction (qPCR), Dental Plaque, Saliva, Tongue
Introduction
Dental caries is the most prevalent infectious disease in mankind and is considered a chronic disease that is associated with multiple factors, including host factors (tooth surface, saliva, acquired pellicle), diet and dental plaque (bacteria). Dental caries does not occur in the absence any of these factors, thus dental caries is considered to be a conditional dieto bacterial disease (1, 2). Among over 600 identifiable bacterial species in the human oral cavity, the mutans streptococci (MS) are thought to play a major role as a microbiologic factor for the initiation of dental caries (3-7). Many studies have been done to identify the relationship between the dental caries with the timing of the initial colonization of the oral cavity as well as with the burden of infection with MS (8-11). Most of these studies use traditional culture method to detect the quantity or presence of MS. However, culture methods suffer from limitations that impact the accuracy and consistency of assessing the infection with MS. Hsu et.al., recently reported on the lack of consistency of multiple plaque collections from molar teeth in quantitatively and qualitatively assessing Streptococcus mutans colonization (12). Dental plaque is a high density complex biofilm approaching 1012 CFU/gram (13). Accurate bacterial quantification requires dispersing coherent plaque bacteria using mechanical methods such as sonication. Sonic dispersion can cause either loss of cell viability (i.e., if too vigorous) or ineffective cell separation (insufficient disruption) which both result in inaccuracy due to lower CFU. Additionally, bacteria such as the MS are often grown on one of many selective media (14) that may be inhibitory to growth. Consequently, these limitations prevent traditional culturing methods from providing an accurate microbial assessment in the evaluation of caries susceptibility or caries activity for individuals or a population at risk.
In the last 25 years, the polymerase chain reaction (PCR) has revolutionized the field of molecular biology (15, 16). One of the most recent extensions of the traditional polymerase chain reaction is a fluorescence based innovation called real time- PCR (qPCR) (17-19). Among the desirable qualities of qPCR are its sensitivity, accuracy, and speed in which qualitative and quantitative results can be obtained. Furthermore, several convenient kits (i.e., Master Mixes) are commercially available. This creates an unparalleled ease at which the PCR can be assembled. Although qPCR can be applied with the use of several methodologies (e.g., TaqMan, Molecular Beacons), the simplest is SYBR-Green (20). This method is dependent on the use of a very specific and highly purified set of primers designed to amplify a nucleic acid sequence that optimally, is no greater than 150 to 200 bp. Briefly, this method takes advantage of double-stranded DNA binding dye, SYBR Green I, to specifically and quantitatively bind to PCR generated double-stranded DNA. During PCR, double stranded amplicons accumulate and result in an increase in fluorescence. Since the fluorescence can be detected over a dynamic range, the sensitivity of qPCR is greatly enhanced resulting in reproducible accuracy in the measurement of target products.
Multiple studies using subgingival plaque samples have demonstrated the efficacy of qPCR compared to culture methodology for quantification of bacterial pathogens from patients with periodontitis versus healthy controls (21-26). In addition to the association of putative periodontal pathogens with disease, qPCR has greater sensitivity as compared to CFU obtained by culture. Hata (27) and Choi (28) have reported the use of qPCR for quantification of MS from dental plaque in children that were caries free and with caries. Both studies found associations related to MS and caries activity, but did not compare the quantitative results to standard plate counts (SPC). The purpose of this study is to compare qPCR using a S. mutans UA159 DNA standard for quantification of S. mutans with SPC.
Materials and Methods
Preparation of S. mutans broth cultures for enumeration
S. mutans UA159 was grown anaerobically (10% H2, 10% CO2, 80% N2) at 37° C in Todd Hewitt broth (Becton Dickinson, Sparks, MD) to late log phase, centrifuged and resuspended in phosphate buffered saline to Ab600 = 1.0 using a Bio-Rad SmartSpec Plus spectrophotometer (Bio-Rad, Hercules, CA). Cell suspensions were sent to Beckman Coulter Particle Characterization Laboratory for electronic enumeration using a Beckman Coulter MS3 Particle Counter/Size Analyzer (Miami, FL). After vigorous vortexing for maximum cell dispersion, the cell density was determined to be 1.034 × 10⁹ cells/ml. The spectrophotometer was standardized to Ab600 of 1.0 = 109 cells/ml that permitted calculation of cell densities based on turbidity readings at Ab600. Extracted genomic DNA from a known S. mutans cell density was used for quantitative qPCR standardization.
S. mutans broth cultures were also plated onto selective media using SPC methods as previously reported (12). Briefly, duplicates of serial 10-fold dilutions of S. mutans (109 cells/ml) were dispensed using a spiral plating machine (Spiral System®, Microbiology International, Frederick, MD) on duplicate Gold’s agar plates (29). Following anaerobic incubation at 37°C for 48 hours, S. mutans viable counts were reported as CFU/ml.
qPCR standardization using a known S. mutans DNA copy number (CN)
A 1 ml aliquot of S. mutans cells (109 cells/ml) was centrifuged at 16,400 X g for 5 minutes at 4° C. The supernatant was removed and the bacterial pellet was resuspended in 400 μl of TE buffer, pH 8.0. Twenty Ll of fresh lysozyme (Sigma, St. Louis, MO) at a concentration of 20 mg/ml was added followed by the addition of 50 U of S-mutanolysin (Sigma, St. Louis, MO). Ten μl of Proteinase K (Fermentas, Glen Burnie, MD) was added followed by incubation for 30 minutes in a 37°C water bath. Afterwards, the action of proteinase K was stopped by thermal inactivation at 65°C for 20 min, The tube contents was adjusted to a final volume of 1 ml with TE buffer, loaded into the sample chamber of a Maxwell cartridge (Promega, Madison,WI) and subjected to automated magnetic-bead based genomic DNA isolation. The isolated DNA was brought to a final volume of 1 ml in TE buffer that served as template for qPCR using S. mutans specific primers (30-32). The sequence of the forward gtfB primer, Smut3368-F, was: 5′-GCCTACAGCTCAGAGATGCTATTCT-3′. The sequence of the reverse gtfB primer, Smut3481-R, was: 5′-GCCATACACCACTCATGAATTGA-3′. The specificity of these primer sequences was confirmed by Yoshida et al. (30) and through Basic Local Alignment Search Tool (BLAST) nucleotide analysis focusing on known human commensal oral bacteria that would not serve as template. Amplification of S. mutans genomic DNA with primers Smut3368-F and Smut3481-R produces a 114 bp amplicon. PCR amplification was performed in a total reaction mixture volume of 12.5 μl. The reaction mixtures contained 6.25 μl Maxima® SYBR Green/Fluorescein qPCR Master Mix (Fermentas, Inc., USA), 0.75 μl of forward and reverse primer, 3 μl of nuclease free water and 2.5 μl of purified DNA obtained from sample (or dilution). An iQ5 Real-Time PCR Detection System (BioRad, Hercules,CA) was used to perform the following cycling parameters: 1 cycle of denaturing at 95°C for 10 min, 40 cycles of 15 sec at 95°C, 30 sec at 60°C and 30 sec at 72°C. Finally, a melting curve analysis was performed using the following cycling parameters: 60°C for 30 sec, 5°C temperature changes to the end temperature of 95°C. The iQ5 Optical System Software (Version 2.0) generated the quantification cycle values (Cq) and analyzed the melting point data. Two-fold dilutions of S. mutans UA159 extracted genomic DNA at 109 CN/ml was used to construct a standard curve for estimation of S. mutans CN from Cq values.
Clinical samples for SPC and qPCR comparison: participants and oral sample collection & processing
Clinical oral samples were collected from children as part of a longitudinal epidemiological study from a high caries risk community in Perry County, Alabama. Children in this rural community are 95% African American of low socioeconomic status and have no regular access to dental care in the county. Subjects for this study were recruited from children that were in kindergarten classes (5–6 years old, N=96) of a public elementary school and infants and toddlers identified from the community (8–18 months old, N=91). Saliva, plaque and tongue samples were collected from subjects during an 8 month period and used for this study during the larger ongoing longitudinal study. Human use approval was obtained from the University of Alabama at Birmingham (UAB) Institutional Review Board with parents of participants providing informed consent, while children gave assent.
Kindergarten aged children had approximately 5 ml of stimulated whole saliva collected while chewing paraffin (approximately 5 minutes) expectorated into a 50 ml sterile tube. Five hundred microliters of saliva was transferred to 4.5 ml reduced transport fluid (RTF, WS, i.e., 1:10). Younger/pre-cooperative aged subjects (8-36 months of age, over the timespan of the study) had saliva collected using a sterile cotton swab inserted in the mouth for absorption. The cotton swab was then placed in 4.5 ml of RTF (CS, estimated to be approximately 1:70 dilution of saliva by pilot study weighing cotton swabs before and after collecting saliva). A sterile toothpick was used to collect plaque from all surfaces (i.e, mesial, distal, buccal, lingual and incisal or occlusal) from primary or permanent teeth. Plaque samples were placed in 1 ml of RTF (PL). Tongue samples were collected by gently scraping the dorsal surface of the tongue with a sterile metal tongue cleaner (Tango™, Omnii Oral Pharmaceuticals Inc., West Palm Beach, FL). The sample was transferred into 5 ml of RTF (TS). Samples were stored on ice or at 4°C for transport to the laboratory for SPC and qPCR processing.
Enumeration of S. mutans by SPC from clinical samples
All four clinical isolate sample types in RTF were processed as previously reported (12) for determination of CFU/ml using the same spiral plating method used for the S. mutans standard. The RTF samples were plated on Gold’s media plates directly and at a 1:100 dilution. Following incubation for 48 hr at 37° C under anaerobic conditions (10% carbon dioxide, 10% hydrogen and 80% nitrogen), the CFU/ml of each sample was calculated.
Enumeration of S. mutans by qPCR from clinical samples
DNA from ~1 ml of each oral RTF sample (i.e., WS, CS, PL, TS), was obtained from a cell pellet following a 30 min centrifugation at 16,400 X g. The cell pellet was further processed using MasterPure™ Gram Positive DNA Purification Kit (Epicentre Biotechnologies, Madison, WI) according to the manufacturer’s instruction. Following isolation, the DNA was re-suspended in 35 μl of Tris EDTA Buffer (TE) and 2.5 μl served as template for qPCR using the previously identified S. mutans specific primers (30). qPCR of DNA from clinical samples was performed as previously described, and the S. mutans CN was determined from the standard curve.
Statistical analysis
Duplicate samples from each aliquot were counted for both qPCR as well as SPC samples. In addition to the individual values, mean values were calculated between the two aliquots for comparison. All analyses were done using SAS V9.2 (SAS Institute Inc., Cary N.C.). Paired t-tests were used to compare the average differences between the two methods. Generalized regression analyses taking into account repeated measures within the same participant were conducted to assess the null hypothesis that the intercept = 0 and the slope = 1. To assess the comparative detection of S. mutans, each sample per person by method was coded as 0 or 1 for the presence or absence of S. mutans. A frequency table was computed comparing the agreement within and between the samples across methods. Tests were conducted using chi square tests.
Results
Standardization of S. mutans CN with qPCR
S. mutans in late logarithmic growth (Ab600 = 1.0) was found to have a cell density of approximately 109 (1.034 × 10⁹) cells/ml using electronic enumeration. Viable plate counts (CFU/ml) on MS agar plates with serial 10-fold dilutions of S. mutans (109 cells/ml) were similar to S. mutans cell densities obtained by absorbance based on electronic enumeration (Fig. 1). Similarly, 2-fold serial dilutions of extracted DNA from S. mutans (109 cells/ml) also demonstrated a linear relationship when CN/ml was compared to Cq values generated from qPCR. The linear regression plot indicates that repeats coincide well with dilutions to approximately 104 CN/ml. Below 104 CN/ml, data varied somewhat, indicating less consistent sensitivity of the assay (Fig. 2).
Fig. 1. UA159 SPC from known cell densities.
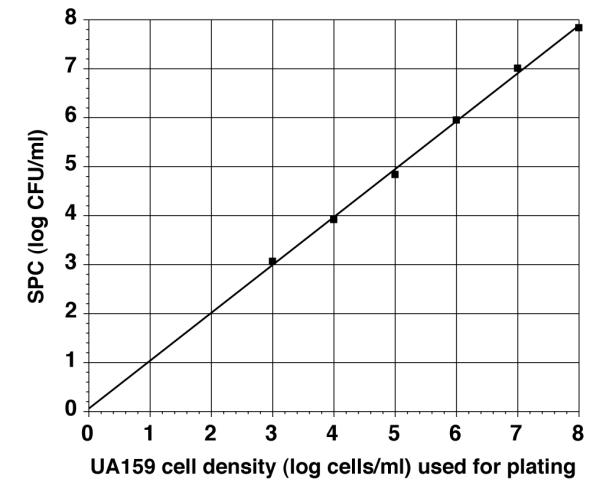
Comparison of log SPC (CFU/ml) with log cells/ml determined from Ab600 of S. mutans UA159 grown in Todd Hewitt broth. S. mutans broth culture from late log phase culture was adjusted to Ab600 = 1.0, representing 109 cells/ml based on electronic enumeration. Viable counts of S. mutans were obtained (CFU/ml) using average of 1-3 agar plates of 10-fold dilutions (108 – 103). Line is linear regression line through the average points generated.
Fig. 2. qPCR of standardized S. mutans DNA.

Quantification cycle (Cq) values are plotted against DNA copy number (CN/ml). Two-fold dilutions of DNA extracted from electronically enumerated S. mutans cells (109 cells/ml) were used as the CN standard. Cq values were determined from the diluted CN (n = 5). Insert graph illustrates representative amplification chart for a series of dilutions from the qPCR results (arrow indicates the crossover threshold used for determination of Cq).
Clinical samples: SPC vs qPCR
A total of 710 clinical samples [whole saliva (WS), cotton swab (CS), plaque (PL), tongue (TS)] were processed for SPC and qPCR from 142 subjects (1-10 samples per child over an 8 month period). Data were collected in duplicate and tabulated (Table 1). Overall mean qPCR CN were found to be higher than SPC CFU (1.3 × 10⁶ and 1.5 × 10⁵, respectively). qPCR was usually, but not always higher than SPC as observed in individual samples. In general, 39% (276/710) of the SPC resulted in no S. mutans being identified while less than 2% (12/710) of qPCR were S. mutans negative. The detection of S. mutans from each method for duplicate samples was found to have total agreement among SPC and qPCR in 53% (i.e., both pairs, 375/710) of cases (Table 2). When discrepancies occurred, 78% [268/(710 366)=268/344] were due to SPC failing to detect any S. mutans on both duplicates while at least 1 of qPCR samples were detecting S. mutans. The alternative (+ S. mutans by SPC, but – for qPCR) was only observed in 3 cases (< 1%). Furthermore, both qPCR samples detected the presence of S. mutans in 231 of the 276 samples (84%) when SPC did not identify S. mutans. However, SPC demonstrated the presence of S. mutans in 4 of the 12 samples (33%) when qPCR failed to detect S. mutans. Fig. 3 illustrates that the CFU from SPC on average resulted in lower numbers (log CFU/ml) than qPCR (log CN/ml) irrespective of the form of sampling as can also be seen by the panel of individual sample types (Fig. 4, a-d). WS sample processing resulted in the highest mean CFU and percentage of S. mutans positive cultures (Table 1), and also resulted in the lowest number of “disparate” results for both SPC and qPCR, i.e., between and within duplicate samples (Fig. 4a).
Table 1.
Summary of Quantification and Detection of S. mutans by qPCR and SPC
| Sample Type |
qPCR Mean CN (s.d.) |
qPCR #samples with no S.mutans (%) |
SPC Mean CFU (s.d.) |
SPC #samples with no S.mutans (%) |
N | Ratio Mean CN/ Mean CFU |
|---|---|---|---|---|---|---|
| WS | 4.61 ×10⁶ (1.35×10⁷) |
1 (1.7%) | 6.79 ×10⁵ (1.49×10⁶) |
6 (10%) | 60 | 6.8 |
| CS | 1.45 ×10⁶ (7.23×10⁶) |
3 (1.5%) | 4.52 ×10⁵ (1.37×10⁶) |
76 (38.0%) | 200 | 3.2 |
| PL | 3.34 ×10⁶ (3.53×10⁷) |
1 (0.6%) | 1.01 ×10⁵ (3.24×10⁵) |
92 (50.3%) | 183 | 33.2 |
| TS | 9.30 ×10⁴ (4.9×10⁴) |
3 (1.1%) | 4.2 ×10⁴ (6.1×10⁵) |
102 (38.2%) |
267 | 2.1 |
Table 2.
4×4 Comparison of Agreement Between and Within qPCR and SPC in Detecting S. mutans
| SPC | ||||||
|---|---|---|---|---|---|---|
| 00* | 01 | 10 | 11 | Total | ||
|
|
||||||
| Frequency | 00 | 8 | 1 | 0 | 3 | 12 |
| Row Percent | 66.67 | 8.33 | 0.00 | 25.00 | 1.7 (% of Total) | |
|
|
||||||
| 01 | 20 | 0 | 1 | 2 | 23 | |
| 86.96 | 0.00 | 4.35 | 8.70 | 3.2 | ||
|
|
||||||
| qPCR | 10 | 17 | 1 | 1 | 7 | 26 |
| 65.38 | 3.85 | 3.85 | 26.92 | 3.7 | ||
|
|
||||||
| 11 | 231 | 20 | 31 | 367 | 649 | |
| 35.59 | 3.08 | 4.78 | 56.55 | 91.4 | ||
|
|
||||||
| Total | 276 | 22 | 33 | 379 | 710 | |
| 38.9 | 3.1 | 4.6 | 53.4 | 100.0 | ||
Row and column definitions: 00 = both samples detect no S. mutans 01 = first sample detect no S. mutans, second sample detect S. mutans 10 = first sample detect S. mutans, second sample detect no S. mutans 11 = both samples detect S. mutans
Fig. 3. Comparison of Log SPC (CFU/ml) vs Log qPCR (CN/ml) for All Oral Samples.

Plot of Log (1 + average) of duplicate CFU/ml and CN/ml. Values for each assay are presented as generated from SPC and qPCR assays. Line represents identity line where SPC and qPCR plots would correspond (i.e., intercept 0,0 with slope of 1). 8* is number of data points in which both SPC and qPCR equal zero. Other numbers along the X and Y axis are the number of data points between log values that differ between SPC and qPCR, respectively, where one indicated zero CFU or CN of S. mutans and the other assay indicated >0 S. mutans.
Fig. 4. Comparison of Log SPC (CFU/ml) vs Log qPCR (CN/ml) for Each Sample Type.

Plot of Log of 1+ average of duplicate CFU/ml and CN/ml. Values for each sample type {whole saliva (WS), cotton swab (CS), plaque (PL), tongue (TS), for panels a-d, respectively} are presented as generated from SPC and qPCR assays. Line represents identity line where SPC and qPCR plots would correspond (i.e., intercept 0,0 with slope of 1). Number with ‘*’ is number of data points in which both SPC and qPCR equal zero. Other numbers along the X and Y axis are the number of data points between log values that differ between SPC and qPCR, respectively, where one indicated zero CFU or CN of S. mutans and the other assay indicated >0 S. mutans.
Discussion
Traditionally, SPC via serial dilutions is used to enumerate viable bacteria in suspension. Although its accuracy with most organisms has been generally accepted, its performance is questionable in theory and imprecise in practice with organisms that undergo binary fission while adhering to each other, resulting in agglutinated cell aggregates. In the current study, S. mutans UA159 broth cultures demonstrated that planktonic growth resulted in CFU (viability) that was comparable to direct counts by electronic enumeration (Fig. 1), but clinical samples that originate from biofilm communities are lower and not as comparable (Fig. 4). Organisms that grow in co-aggregated consortiums, e.g., dental plaque biofilm, weaken the application of the SPC for quantification and negatively (lower CFU) impact the accuracy of enumeration due to inadequate dispersion into individual cells. Additionally, SPC cannot quantitatively reflect the presence of dead or nonviable organisms, even if viable when a sample was collected. Given these shortcomings, SPC of S. mutans cells from dental plaque would generate viable counts (CFU) that would be lower than CN from qPCR due to clumping of S. mutans cells and/or the presence of non-viable cells (Fig. 3 and Table 2). This is also evident in Table 1 where the PL (plaque) sample had a mean CN/CFU ratio of 33.2.
Electronic enumeration was used to accurately determine direct counts on standardized Ab600 = 1.0 S. mutans UA 159 broth cultures. A cell density of 109 cells/ml were equivalent to Ab600 = 1.0. Consequently, qPCR Cq values were generated from know S. mutans cell densities that provided an accurate correlation between cell densities or DNA CN, and Cq determinations. An important objective of this study was to resolve the fundamental issue of accurately correlating S. mutans cell density with a qPCR Cq value, thereby, overcoming the limitations of SPC culture based quantification.
Extracted DNA template for qPCR from samples collected for this study was a heterogenous DNA mixture representing the microbial populations of the oral cavity, and requires specificity in S. mutans primer design. Selection of established primers adds confidence to SYBR green based PCR as an affordable quantitative methodology for determining S. mutans levels in oral samples (30). The results of the nucleotide BLAST analysis at the NCBI website revealed an acceptable theoretical level of primer specificity reducing concerns of amplicon generation from DNA template not of S. mutans origin (data not shown).
Several studies have compared SPC to quantitative qPCR with a variety of periodontal pathogens such as Porphoromonas gingivalis, Actinobacillus actinomycetemcomitans and Tannerella forsythensis (21-26). To date a number of studies have also used PCR methods to quantitate MS from oral samples (33), and to evaluate associations with dental caries incidence (27, 28, 31, 34). However, only one of these reports (33) compared PCR with SPC from saliva samples in a group of children with active caries. Our study, validates qPCR for quantitating cariogenic bacteria from oral samples by initially standardizing direct counts of S. mutans with electronic enumeration, and then comparing known S. mutans cell densities with CFU obtained from traditional culturing methods (SPC) and Cq values from qPCR. Furthermore, these results indicate that qPCR is more sensitive in quantitating S. mutans cells since it detected the presence of these organisms in oral samples more often in the duplicate assays irrespective of the type of sampling (WS, CS, PL, TS, Fig. 4).
Overall, the findings of the data presented indicate that saliva samples collected from children expectorating into a cup resulted in generally higher S. mutans CFU and CN compared to cotton swab saliva, plaque and tongue scraping. This saliva also resulted in less discrepancy between detection of S. mutans (Fig. 4a). Therefore, results with saliva appear to be most quantitatively consistent. Nonetheless, qPCR was found to be more sensitive for detection of S. mutans than SPC. Based on each method used (i.e., volume of sample processed), it was possible to compute theoretical detection limits. SPC samples were plated using a Spiral Plater that dispenses 50μl of sample on each Petri dish (manufacture recommends at least ≥20 colonies for a quantitative sample). One can calculate a quantitative detection threshold of 400 CFU/ml (20 colonies/50μl × 1000μl/1ml = 400 CFU/ml). The detection threshold of qPCR was similarly calculated based on the observation that the standard curve for UA159 was found to be accurate to 2 × 10³ CN/ml. Since the template volume of each qPCR sample is 2.5μl, the “2 × 10³ CN/ml” dilution contains 5 DNA copies. The samples processed were concentrated such that the sample was 1/14 of the total extracted DNA from 1 ml in processing, therefore detection threshold was calculated to be 70 CN/ml [i.e., 5 CN × 14 (proportion of 1 ml sample)]. Since the theoretical thresholds are similar (i.e., 400 vs 70), but qPCR was more sensitive, it is likely that CNs detected are higher due to a combination the theoretical sensitivity of the methods, as well as, the possibility of decreased cell viability or lack of growth on selective media (but still detected by qPCR), and CFU representing more than one bacterial cell in the SPC methodology.
qPCR is a recently established fluorescence based technology that rapidly provides accurate, sensitive, and quantitative data. Additionally, the process of using this methodology yields a sample that can be frozen indefinitely for future assay or re-assay for longitudinal study or continued genomic-based analysis, an advantage not afforded by the SPC methodology. Taken together, the use of SYBR Green based qPCR quantification along with the added ability to store oral samples (i.e., DNA versus viable cells), serves to support a change in the way oral samples are enumerated for bacteria. Furthermore, the impact of timing of processing and increased through-put can greatly increase the amount of samples that can be collected for processing at a manageable pace so that laboratory resources are not over extended. Therefore, qPCR may relieve oral researchers of the methodological burdens imposed by SPC with a quantification methodology that is rapid, accurate, and reproducible. For example, qPCR has the potential to facilitate the design and use of additional primer sets to simultaneously quantitate (i.e., multiplex assays) other microbial genera that might be considered cariogenic (i.e., Bifidobacterium, Lactobacillus, Actinomyces, non-mutans streptococci) (35, 36). Regardless of the platform of the multiplex assay design, the reduced time and the increased quality of data acquired through the assay will likely improve number of samples that can be analyzed per unit of time, reduce the total cost of analysis and most likely uncover some surprising quantitative relationships between the microbial targets of the assay. An especially attractive feature of pursuing this approach is the generation of a sample that can be analyzed at a later time with any number of assays designed to detect and quantitate a wider variety of caries associated targets. Since DNA isolated from the tongue and saliva samples of this study very likely contains some DNA from host oral epithelial cells, host-associated factors involved with caries formation can be investigated in the future using these same cataloged samples. Additionally, the popular format of the SYBR Green PCR analysis ease the necessity of investigating the possibility of storing saliva before analysis, and how this would enable a substantially large number of samples to be collected and processed later without regard to loss of sample viability or exhaustion of laboratory resources before sample loss. In conclusion, quantitative qPCR, along with the growing strength of bioinformatics and proteomics, may usher in a new approach to this piece of caries risk assessment and possibly introduce an entirely new investigative paradigm for enumerating microorganisms in oral samples.
Acknowledgements
This investigation was supported by Research Grant DE016684 from the National Institute of Dental and Craniofacial Research, National Institutes of Health, Bethesda, MD 20892. The funding agency had no role in the study design, data collection and analysis, decision to publish, or preparation of this manuscript. None of the authors have any potential, perceived or real conflicts of interest associated with this manuscript. We especially appreciate all the clinical and laboratory participants of this study: Ms. Stephanie McLean, Ms. Tonya Wiley, Dr. Steve Mitchell, Dr. Sonia Makhija, Dr. Rosalyn Bassett, Ms. Mary Slater, Ms. Frances Jackson, and the pediatric dental residents of the UAB School of Dentistry.
References
- 1.Zero DT. Dental caries process. Dent Clin North Am. 1999;43:635–664. [PubMed] [Google Scholar]
- 2.Bloomquist CG, Liljemark WF. Dental plaque. In: Nataro JP, Blaser MJ, editors. Persistent Bacterial Infections. ASM Press; Washington, D.C.: 2000. pp. 409–422. [Google Scholar]
- 3.Russell RB. The molecular biology of cariogenic bacteria. In: Rogers AH, editor. Molecular Oral Microbiology. Caister Academic Press; Norfolk, UK: 2008. pp. 109–134. [Google Scholar]
- 4.Tanzer JM, Livingston J, Thompson AM. The microbiology of primary dental caries in humans. J Dent Educ. 2001;65:1028–1037. [PubMed] [Google Scholar]
- 5.van Der Hoeven JS, van Palenstein Helderman W. Microbial specificity and dental caries. In: Guggenheim B, Shapiro S, editors. Proceedings of the Conference: Oral Biology at the Turn of the Century Misconceptions, Truths, Challenges and Prospects. Karger; Basel: 1998. pp. 43–55. [Google Scholar]
- 6.Loesche WJ. Role of Streptococcus mutans in human dental decay. Microbiol Rev. 1986;50:353–380. doi: 10.1128/mr.50.4.353-380.1986. [DOI] [PMC free article] [PubMed] [Google Scholar]
- 7.Dewhirst FE, Chen T, Izard J, Paster BJ, Tanner AC, Yu WH, Lakshmanan A, Wade WG. The human oral microbiome. J Bacteriol. 2010;192:5002–5017. doi: 10.1128/JB.00542-10. [DOI] [PMC free article] [PubMed] [Google Scholar]
- 8.Bratthall D, Hansel Petersson G. Cariogram--a multifactorial risk assessment model for a multifactorial disease. Community Dent Oral Epidemiol. 2005;33:256–264. doi: 10.1111/j.1600-0528.2005.00233.x. [DOI] [PubMed] [Google Scholar]
- 9.Wan AK, Seow WK, Purdie DM, Bird PS, Walsh LJ, Tudehope DI. A longitudinal study of Streptococcus mutans colonization in infants after tooth eruption. J Dent Res. 2003;82:504–508. doi: 10.1177/154405910308200703. [DOI] [PubMed] [Google Scholar]
- 10.Straetemans MM, van Loveren C, de Soet JJ, de Graaff J, ten Cate JM. Colonization with mutans streptococci and lactobacilli and the caries experience of children after the age of five. J Dent Res. 1998;77:1851–1855. doi: 10.1177/00220345980770101301. [DOI] [PubMed] [Google Scholar]
- 11.Holbrook WP, Arnadottir IB, Takazoe I, Birkhed D, Frostell G. Longitudinal study of caries, cariogenic bacteria and diet in children just before and after starting school. Eur J Oral Sci. 1995;103:42–45. doi: 10.1111/j.1600-0722.1995.tb00009.x. [DOI] [PubMed] [Google Scholar]
- 12.Hsu KL, Osgood RC, Cutter GR, Childers NK. Variability of two plaque sampling methods in quantitation of Streptococcus mutans. Caries Res. 2010;44:160–164. doi: 10.1159/000314066. [DOI] [PMC free article] [PubMed] [Google Scholar]
- 13.Socransky SS, Gibbons RJ, Dale AC, Bortnick L, Rosenthal E, Macdonald JB. The microbiota of the gingival crevice area of man. I. Total microscopic and viable counts and counts of specific organisms. Arch Oral Biol. 1963;8:275–280. doi: 10.1016/0003-9969(63)90019-0. [DOI] [PubMed] [Google Scholar]
- 14.Wan AKL, Seow WK, Walsh LJ, Bird P. Comparison of five selective media for the growth and enumeration of Streptococcus mutans. Aus Dent Journal. 2002;47:21–26. doi: 10.1111/j.1834-7819.2002.tb00298.x. [DOI] [PubMed] [Google Scholar]
- 15.Mullis K, Faloona F, Scharf S, Saiki R, Horn G, Erlich H. Specific enzymatic amplification of DNA in vitro: the polymerase chain reaction. Cold Spring Harb Symp Quant Biol. 1986;51(Pt 1):263–273. doi: 10.1101/sqb.1986.051.01.032. [DOI] [PubMed] [Google Scholar]
- 16.Rupf S, Merte K, Eschrich K. Quantification of bacteria in oral samples by competitive polymerase chain reaction. J Dent Res. 1999;78:850–856. doi: 10.1177/00220345990780040501. [DOI] [PubMed] [Google Scholar]
- 17.Bustin SA, Benes V, Nolan T, Pfaffl MW. Quantitative real-time RT-PCR--a perspective. J Mol Endocrinol. 2005;34:597–601. doi: 10.1677/jme.1.01755. [DOI] [PubMed] [Google Scholar]
- 18.Kubista M, Andrade JM, Bengtsson M, Forootan A, Jonak J, Lind K, Sindelka R, Sjoback R, Sjogreen B, Strombom L, Stahlberg A, Zoric N. The real-time polymerase chain reaction. Mol Aspects Med. 2006;27:95–125. doi: 10.1016/j.mam.2005.12.007. [DOI] [PubMed] [Google Scholar]
- 19.Chen Z, Saxena D, Caufield PW, GE Y, Wang M, Li Y. Development of species-specific primers for detection of Streptococcus mutans in mixed bacterial samples. FEMS Microbiol Lett. 2007;272:154–162. doi: 10.1111/j.1574-6968.2007.00756.x. [DOI] [PMC free article] [PubMed] [Google Scholar]
- 20.Karsai A, Muller S, Platz S, Hauser MT. Evaluation of a homemade SYBR green I reaction mixture for real-time PCR quantification of gene expression. Biotechniques. 2002;32:790–792. 794–796. doi: 10.2144/02324st05. [DOI] [PMC free article] [PubMed] [Google Scholar]
- 21.Atieh MA. Accuracy of real-time polymerase chain reaction versus anaerobic culture in detection of Aggregatibacter actinomycetemcomitans and Porphyromonas gingivalis: a meta-analysis. J Periodontol. 2008;79:1620–1629. doi: 10.1902/jop.2008.070668. [DOI] [PubMed] [Google Scholar]
- 22.Boutaga K, van Winkelhoff AJ, Vandenbroucke-Grauls CM, Savelkoul PH. Comparison of real-time PCR and culture for detection of Porphyromonas gingivalis in subgingival plaque samples. J Clin Microbiol. 2003;41:4950–4954. doi: 10.1128/JCM.41.11.4950-4954.2003. [DOI] [PMC free article] [PubMed] [Google Scholar]
- 23.Jervoe-Storm PM, Koltzscher M, Falk W, Dorfler A, Jepsen S. Comparison of culture and real-time PCR for detection and quantification of five putative periodontopathogenic bacteria in subgingival plaque samples. J Clin Periodontol. 2005;32:778–783. doi: 10.1111/j.1600-051X.2005.00740.x. [DOI] [PubMed] [Google Scholar]
- 24.Lau L, Sanz M, Herrera D, Morillo JM, Martin C, Silva A. Quantitative real-time polymerase chain reaction versus culture: a comparison between two methods for the detection and quantification of Actinobacillus actinomycetemcomitans, Porphyromonas gingivalis and Tannerella forsythensis in subgingival plaque samples. J Clin Periodontol. 2004;31:1061–1069. doi: 10.1111/j.1600-051X.2004.00616.x. [DOI] [PubMed] [Google Scholar]
- 25.Nonnenmacher C, Dalpke A, Rochon J, Flores-de-Jacoby L, Mutters R, Heeg K. Real-time polymerase chain reaction for detection and quantification of bacteria in periodontal patients. J Periodontol. 2005;76:1542–1549. doi: 10.1902/jop.2005.76.9.1542. [DOI] [PubMed] [Google Scholar]
- 26.Lyons SR, Griffen AL, Leys EJ. Quantitative real-time PCR for Porphyromonas gingivalis and total bacteria. J Clin Microbiol. 2000;38:2362–2365. doi: 10.1128/jcm.38.6.2362-2365.2000. [DOI] [PMC free article] [PubMed] [Google Scholar]
- 27.Hata S, Hata H, Miyasawa-Hori H, Kudo A, Mayanagi H. Quantitative detection of Streptococcus mutans in the dental plaque of Japanese preschool children by real-time PCR. Lett Appl Microbiol. 2006;42:127–131. doi: 10.1111/j.1472-765X.2005.01821.x. [DOI] [PubMed] [Google Scholar]
- 28.Choi EJ, Lee SH, Kim YJ. Quantitative real-time polymerase chain reaction for Streptococcus mutans and Streptococcus sobrinus in dental plaque samples and its association with early childhood caries. Int J Paediatr Dent. 2009;19:141–147. doi: 10.1111/j.1365-263X.2008.00942.x. [DOI] [PubMed] [Google Scholar]
- 29.Gold OG, Jordan HV, van Houte J. A selective medium for Streptococcus mutans. Archs Oral Biol. 1973;18:1357–1364. doi: 10.1016/0003-9969(73)90109-x. [DOI] [PubMed] [Google Scholar]
- 30.Yoshida A, Suzuki N, Nakano Y, Kawada M, Oho T, Koga T. Development of a 5′ nuclease-based real-time PCR assay for quantitative detection of cariogenic dental pathogens Streptococcus mutans and Streptococcus sobrinus. J Clin Microbiol. 2003;41:4438–4441. doi: 10.1128/JCM.41.9.4438-4441.2003. [DOI] [PMC free article] [PubMed] [Google Scholar]
- 31.Kishi M, Abe A, Kishi K, Ohara-Nemoto Y, Kimura S, Yonemitsu M. Relationship of quantitative salivary levels of Streptococcus mutans and S. sobrinus in mothers to caries status and colonization of mutans streptococci in plaque in their 2.5-year-old children. Community Dent Oral Epidemiol. 2009;37:241–249. doi: 10.1111/j.1600-0528.2009.00472.x. [DOI] [PubMed] [Google Scholar]
- 32.Nagashima S, Yoshida A, Ansai T, Watari H, Notomi T, Maki K, Takehara T. Rapid detection of the cariogenic pathogens Streptococcus mutans and Streptococcus sobrinus using loop-mediated isothermal amplification. Oral Microbiol Immunol. 2007;22:361–368. doi: 10.1111/j.1399-302X.2007.00370.x. [DOI] [PubMed] [Google Scholar]
- 33.Rupf S, Merte K, Kneist S, AlRobaiy S, Eschrich K. Comparison of different techniques of quantitative PCR for determination of Streptococcus mutans counts in saliva samples. Oral Microbiol Immunol. 2003;18:50–53. doi: 10.1034/j.1399-302x.2003.180108.x. [DOI] [PubMed] [Google Scholar]
- 34.Yano A, Kaneko N, Ida H, Yamaguchi T, Hanada N. Real-time PCR for quantification of Streptococcus mutans. Fems Microbiol Lett. 2002;217:23–30. doi: 10.1111/j.1574-6968.2002.tb11451.x. [DOI] [PubMed] [Google Scholar]
- 35.Takahashi N, Nyvad B. The role of bacteria in the caries process: ecological perspectives. J Dent Res. 2011;90:294–303. doi: 10.1177/0022034510379602. [DOI] [PubMed] [Google Scholar]
- 36.Beighton D. The complex oral microflora of high-risk individuals and groups and its role in the caries process. Community Dent Oral Epidemiol. 2005;33:248–255. doi: 10.1111/j.1600-0528.2005.00232.x. [DOI] [PubMed] [Google Scholar]