

Abstract
We have used a modified 3D cellular microarray platform for the high-throughput analysis of growth, cytotoxicity, and protein expression profile of a human hepatocellular carcinoma cell line, HepG2, in alginate. The results obtained were compared to analogous studies in 2D and 3D environments at the microtiter scale. The antiproliferative effects of four drugs, tamoxifen, 5-fluorouracil, doxorubicin, and amitriptyline, were studied as a function of seeding density in the three different culture platforms. The chemosensitivity of HepG2 cells to all four compounds decreased substantially with increasing cell number in the 2D and 3D microtiter-based cultures, while no seeding density-dependence was observed in the IC50 values obtained in the 3D microarray culture platform. These results can be rationalized based on the development of confluence-dependent resistance in cultures where proliferation is restricted by cell-cell contacts and nutrient availability, as is the case for both of the microtiter-based cultures. Additionally, further development of an on-chip, in-cell immunofluorescence assay provided quantitative data on the levels of specific target proteins involved in proliferation, adhesion, angiogenesis and drug metabolism, and was used to compare expression profiles between 2D and 3D environments. The up-regulation of several CYP450 enzymes, β1-integrin and vascular endothelial growth factor (VEGF) in the 3D microarray cultures suggests that this platform provides a more in vivo-like environment allowing cells to approach their natural phenotype.
Keywords: 3D cell culture, microarray, high-throughput, drug resistance
INTRODUCTION
A drug candidate in Phase I clinical testing often requires a decade of discovery followed by preclinical evaluation, yet still has only an 8% chance of reaching the bedside. (1) A leading cause for the failure of drug candidates during clinical trials, and even after a drug has been introduced into the market, is adverse toxicity that was not predicted by animal models. (2) Moreover, the ethical issues and financial constraints surrounding the use of animal-based models in drug screening and toxicity testing have placed increasing pressure to transition testing to in vitro, human cell-based assays that are inexpensive, faster, and potentially more predictive than the current animal testing paradigm. (2-4)
Cell-based assays can facilitate evaluation of a target molecule in a cellular context at an early stage in drug discovery by simultaneously providing information on multiple biochemical end-points, such as proliferation, chemoresistance, motility, differentiation, cell shape, drug absorption, metabolism, and protein expression and localization. (5) These assays are not only rich in information, but are often amenable to automated, high-throughput (HT) screening, reducing screening cost and time, and improving accuracy. However, there remain significant challenges in developing in vitro cell-based models that can recapitulate the in vivo tissue environment to evaluate biologically complex processes. One step towards developing more realistic culturing models is to constrain cells to a more in vivo-like, three-dimensional (3D) environment. This should facilitate cell-cell communication, and can be useful in determining how the cells perceive, interpret, and respond to cues from their microscale environment.
There is a wealth of information on how cells confined in conventional 2D monolayer cultures differ substantially in their properties from cells cultured in a 3D configuration. Lacking the physical and chemical cues defining their natural in vivo microenvironment, cells in 2D culture differ substantially in their shape and organization, in contacts with neighboring cells, and in their physiology and metabolism from cells observed in more physiologically relevant 3D environments. (6-8) For example, mammary epithelial cells grown in 2D and 3D environments exhibit dramatic differences in cell surface receptor expression, proliferation, cell morphology and organization, gene expression, signaling, and differentiation. (7,9-16) Important differences in cellular responses have also been observed in primary hepatocytes and human hepatoma cell lines cultured in 2D and 3D environments. For example, hepatocytes cultured in monolayers de-differentiate after only a few passages and lose liver-specific functions, most significantly their ability to express drug-metabolizing enzymes, which are essential for achieving more predictive toxicity assays. (2)
Evidence suggests that the morphology and key functions of primary hepatocytes and human-derived liver cell lines, such as urea, fibrinogen, and albumin secretion, as well as expression and activity of phase I and phase II drug-metabolizing enzymes, can be at least partially regained in 3D cultures. (17-23) Importantly, a differential response to drugs of cells grown in 2D and 3D cultures has been observed, with a variety of studies showing an increased chemoresistance to anticancer drugs in 3D models. (24-28) This elevated chemoresistance, observed most commonly in multicellular spheroid models, has been attributed to several factors, including poor penetrability and diffusion of drugs, differences in metabolic state and cell cycle arrest at G0/G1 phase, up-regulation of genes conferring drug resistance, and increased pro-survival signaling.
Despite evidence of increased physiological relevance of 3D cultures for toxicity testing, little effort has been directed towards the miniaturization of standardized in vitro 3D models and assays that are compatible with large-scale automated approaches. (29-32) Such steps, however, are necessary for incorporation of 3D culture techniques into commercial high-throughput (HT) screening. Previously, a miniaturized 3D cell-culture array for HT toxicity screening of drug candidates and their metabolites was described by Lee and co-workers (32), and immunofluorescence-based assays for target protein analysis have been adapted to the microarray platform. (33,34)
In the current study, this 3D platform was compared to more conventional 2D microwell plate assays to study differences in morphology, proliferation, cytoxicity, and protein expression of the human hepatoblastoma cell line, HepG2. The HepG2 cell line is a commonly used model to investigate liver cell function, since it shares many properties of hepatocytes, such as secretion of various lipoproteins, biosynthesis of multiple plasma proteins, and plasma membrane polarity. (20,22) By performing comparative cytotoxicity studies in 3D nanoscale cultures and in 2D and 3D microtiter-scale cultures, the impact on cell function caused by scaling-down culture size was decoupled from the impact of changing culture dimensionality. Our results clearly demonstrate the importance of cell density when cell culture is used to model the response of tissue to anticancer drugs. Using an on-chip, in-cell immunofluorescence assay, we also demonstrate that the 3D microarray platform can be used in HT to study the key variables involved in 3D-dependent cell behavior and signaling. Specifically, a significant up-regulation was observed in the levels of proteins involved in proliferation, adhesion, angiogenesis and drug metabolism in 3D.
MATERIALS AND METHODS
Cell Culture Techniques
Human HepG2 hepatoma cells (ATCC) were cultured in Eagle’s Minimum Essential Medium (EMEM from ATCC) supplemented with 10% (v/v) fetal bovine serum (FBS) and 1% penicillin-streptomycin, both from Invitrogen, in T-75 cell-culture flasks (Corning) at 37 °C in a humidified atmosphere of 5% CO2. The media was renewed every two days, and confluent layers of cells were sub-cultured every 5-6 days using a 0.05% trypsin-0.53 mM ethylenediaminetetraacetic acid (EDTA) solution (Invitrogen). After each passage, cell concentration and viability were determined by counting cells in a hemacytometer (Hausser Scientific) using the trypan blue dye (Invitrogen) exclusion test. For proliferation and growth inhibition studies, cells were cultured in 2D as well as in 3D alginate matrices within 96-well microtiter plates. For 2D cultures, 100 μl of various cell suspensions with concentrations ranging from 5 × 10⁴ – 4 × 10⁵ cells/ml were transferred directly into the wells of a standard 96-well plate (Greiner Bio-one) and allowed to attach overnight. The 3D cultures were prepared by mixing cell suspensions in EMEM with a low-viscosity alginate solution (Sigma) so that the final concentration of alginate was 1% (w/v), and the cell concentration ranged from 1.3 × 10⁵ – 5.0 × 10⁶ cells/ml. Prior to seeding, the 96-well plates were functionalized by adding 40 μl per well of a poly-L-lysine (PLL)-Ba2+ mixture prepared by mixing a 0.1 M BaCl2 (Sigma-Aldrich) solution in water with a 0.01% (w/v) sterile PLL solution (Sigma) in a 1:2 volume ratio, and allowing the solution to dry. Subsequently, 40 μl of the cell suspension in alginate were added to each well, allowing the alginate to crosslink with the Ba2+ for 10 min before adding 100 μl of EMEM media to the wells.
3D Microarray Culture Preparation
Proliferation, growth inhibition, and protein expression were also analyzed in HepG2 cells grown in alginate-containing microarray spots on a modified glass microscope slide (or chip). Briefly, a PLL-Ba2+ solution prepared as described above was spotted (30-60 nl/spot in a 6 × 8 × 8 array) onto poly(styrene-co-maleic anhydride) (PS-MA)-coated slides (pre-cleaned Coresix Precision Glass, PS-MA from Sigma) using a MicroSys 5100-4SQ noncontact microarray spotter (Genomics Solutions). After drying the PLL-BaCl2 mixture, 30 nl of cell suspension in 1 % (w/v) alginate were printed on top of each PLL-barium spot. The presence of barium cations allowed gelation of alginate nearly instantaneously. During the spotting process, the humidity within the microarrayer was maintained above 90% to minimize water evaporation from the spots. Following printing, groups of 48 spots within the slide were incubated separately with 250 μl of media per group by fitting the chip with an 8-well polystyrene medium chamber coated with a biocompatible adhesive (Lab-Tek II, Nunc) that allows attachment of the slide to the chamber. The chamber can be easily removed for assaying with a slide separator.
Cell Viability Assay
Cells seeded at four seeding densities in the different culture platforms (2D, 3D, and 3D on chip) were cultured in 10% EMEM, 1% fetal bovine serum (FBS), 1% penicillin-streptomycin complete medium and incubated at 37 °C for 5 days, with medium replacement every 2 days. For the 2D and 3D cultures in microtiter plates, viability was assessed every day with a methylthiazolyldiphenyl-tetrazolium bromide (MTT) assay. Briefly, 50 μl of a 2.5 mg/ml MTT (Sigma) reagent solution prepared in sterile conditions were added to each well, and incubated for 3 h at the culture conditions. Subsequently, the culture fluid was removed and the purple-colored formazan crystals generated in metabolically active cells were dissolved with 150 μl of dimethylsulphoxide (Sigma Aldrich). Dissolution of the crystals was enhanced by shaking the plates for 30 min at 60 rpm, followed by repeated aspiration and trituration of the gels. The absorbance was then read using a BioAssay Reader HTS 7000 Plus (Perkin-Elmer) at 590 nm with a reference filter at 690 nm. The absorbance was correlated linearly with cell number for both 2D and 3D cultures and was used as a measure of live-cell population.
The viability of cells cultured on chip in 3D environments was in turn assessed with a live/dead cell staining kit for mammalian cells (Invitrogen). In this case, the chamber was first separated from the chip using a slide separator and then rinsed three times in a wash solution (140 mM NaCl (Sigma-Aldrich) and 20 mM CaCl2 (Sigma) at pH 7). This was followed by immersion of the slide in a 0.5 μM calcein AM/1 μM ethidium homodimer 1 solution to detect live and dead cells via green and red fluorescence intensity, respectively. After 45 min of incubation at room temperature, the dye was removed and the slide rinsed thoroughly with the wash solution and then dried. Finally, the chip was scanned with a blue laser (488 nm) using a GenePix 4000B microarray scanner (Axon Instruments), with a standard blue filter and a 645AF75/594 filter for the green and red dye, respectively. The fluorescence intensity from the resulting image was quantified with the GenePix Pro 6.0 software (Molecular Devices).
Anitproliferative Assay with Anticancer Drugs
Determination of cytotoxicity in the three culture platforms was performed at four different seeding densities using four model compounds, all from Sigma. Doxorubicin is a DNA intercalating anticancer agent that induces DNA damage and triggers cell death by apoptosis. Tamoxifen is an orally active selective estrogen receptor modulator that acts primarily as a cytostatic drug. (24) 5-Fluorouracil is an anticancer compound that exerts its effect by inhibiting thymidylate synthase and incorporating its metabolites into RNA and DNA. (35). The toxicity of amitriptyline, a common antidepressant drug, has been related to increased cellular permeability and increased oxidative stress generating reactive oxygen species. HepG2 cells were seeded in the different platforms as described above and cultured for 15 h, after which the media was removed and the cells incubated with various concentrations of drug solutions. Following a 24 h incubation period, the drug solutions were removed and the cells were cultured with complete medium for an additional 3 days. Cytotoxicity was then determined with an MTT assay for the cultures in the microtiter plate, and with a live/dead assay for the microcultures on chip, as described previously. Each experiment was repeated 3-times, having 3-replicates per sample in the microtiter plates, and 48-replicates per sample in the microarrays.
On-Chip, In-Cell Immunofluorescence Assay
Cellular immunofluorescence assays were performed on 2D cultures seeded with 100,000 cells/well within 24-well plates, and on 3D microarray cultures with cells seeded at a concentration of 6.7 × 10⁶ cells/ml (200 cells/spot). After 3 days of incubation, the cells were rinsed three-times with a wash buffer (Tris-buffered saline (TBS) containing 10 mM of CaCl2) and subsequently fixed with a 3.7% (v/v) formaldehyde (Sigma) solution in TBS for 20 min. The cells were then permeabilized for 10 min with 0.15% (v/v) Triton X-100 (Sigma), rinsed twice with the wash buffer, and incubated overnight at 4 °C with a blocking solution (TBS Superblock from Pierce). After blocking, they were rinsed three times with TBS containing 0.1% (v/v) Tween-20 (MP Biomedicals), and incubated for 1.5 h at room temperature with the various primary antibodies diluted in 1% (w/v) bovine serum albumin (BSA, Santa Cruz Biotechnology) in TBS. The antibodies used were rabbit polyclonal anti-CYP1A1 (1:1000 dilution, from Abcam), rabbit polyclonal anti-CYP3A4 (1:75 dilution, Thermo Scientific), rabbit polyclonal anti-CYP2C9 (1:100 dilution, Thermo Scientific), rabbit polyclonal anti-VEGF (1:500, Abcam), rabbit polyclonal anti-EGFR (1:75 dilution, Abcam), mouse monoclonal anti-β1-Integrin (1:100, Abcam), mouse monoclonal anti-E Cadherin (1:50 dilution, from Abcam), rabbit monoclonal anti-CD44 (1:150, Abcam), rabbit monoclonal anti-β-Catenin (1:120 dilution, Cell Signaling), mouse monoclonal anti-Vinculin (1:100, from Sigma), and rabbit polyclonal anti-γ-Tubulin (1:1000 dilution, Sigma-Aldrich). After washing the cells thoroughly, the secondary antibody (peroxidase-conjugated goat anti-mouse or goat anti-rabbit IgG from Invitrogen) diluted 1:1000 in TBS containing 1% (w/v) BSA was added, and the cells were incubated at room temperature for 70 min. A tyramide signal amplification kit (Invitrogen) was subsequently used following the manufacturer’s instructions to detect the presence of the target proteins through fluorescence analysis. The microarrays were scanned with a slide scanner as described above (at 488 nm with a standard blue laser), while the 24-well plate cultures were read (495/519 nm for excitation/emission) with the BioAssay Reader HTS 7000 Plus. The experiment was repeated twice, having three replicates per sample for the 2D cultures, while for the microcultures we had 3 distinct chips per experiment with 48 replicates per sample. The signal from γ-tubulin was used as internal control.
Confocal Imaging
Confocal imaging was performed on 2D cultures of cells seeded in Lab-Tek II chamber slides, as well as on 3D on-chip cultures using a Zeiss LSM 510 Meta laser scanning microscope equipped with a 405 nm diode and an Ar laser. After an incubation period of 2 days in complete medium, cells in the two platforms were washed with TBS and fixed with 4% paraformaldehyde (PFA) in PBS containing 10 mM CaCl2. Cells were then permeabilized with 0.15% Triton X-100 in TBS, and washed thoroughly. Next, the cells were incubated in Alexa-fluor 488-conjugated phalloidin (Invitrogen) diluted 150-fold in TBS, for 1 h at room temperature to stain the F-actin filaments. The nuclei were subsequently stained using 4’,6’ diamino-2-phenylindole (DAPI) (dilactate from Invitrogen). The DAPI was diluted 1:10,000 in TBS and incubated for 5 min, after which the chambers were washed thoroughly. For obtaining Z-stack images, the cells were imaged using a 40× water immersion objective with a section thickness of 0.5 μm.
Statistical Analysis
Seeding density effects as well as culture platform effects on chemosensitivity, and protein expression were determined using a one-way analysis of variance (ANOVA) followed by planned comparisons using Student’s t test. For all comparisons, results were considered significant if p < 0.05. Data is represented graphically as the mean ± SEM.
RESULTS
Morphological Characteristics
The morphological characteristics of HepG2 cells cultured in 2D and 3D alginate microtiter well plate environments were studied with bright-field and confocal microscopy, staining the actin filaments and the nuclei with Alexa fluor 488-conjugated phalloidin (green) and with DAPI (blue), respectively (Fig. 1). As expected, cells grown on 2D substrates displayed a flat, spindle-like morphology, adhering readily to the substrate (Figs. 1a and 1c). A few cell clusters are observed in the sample seeded at the lowest seeding density (ρseed = 1.6 × 10⁴ cells/cm2) after two days of culture, whereas at a ρseed = 6.3 × 10⁴ cells/cm2 the cells have nearly reached confluence.
Figure 1.

Morphological characterization of HepG2 cells cultured in 2D and 3D microtiter cultures, and chip-based 3D microarray cultures. (A) Bright-field images of cells, showing the different culture characteristics of each platform. (B) Schematic representation of the preparation and characterization of the microarrays, demonstrating the 3D distribution of cells within each 30 nl alginate spot and 70 μm in thickness. (C) Cells in 2D have a flat, extended morphology, as demonstrated by confocal microscopy images where the actin filaments are stained with Alexa fluor 488-conjugated phalloidin and the nuclei with DAPI. Increasing the cell density (ρseed = 1.6 × 10⁴, 3.2 × 10⁴, and 6.3 × 10⁴ cells/cm2) leads to formation of confluent monolayers (D) Cells in 3D cultures have a spherical morphology, with little interaction with the alginate matrix. Increasing the cell density in the microarrays (ρseed = 1.5 × 10⁶, 7.5 × 10⁶, 16.7 × 10⁶ cells/ml) leads to significant cellular aggregation of cells.
Cells were also printed at different seeding densities within 3D alginate microarray spots, as depicted in Fig. 1b. HepG2 cells encapsulated within the alginate matrix were spherical in shape, with significant cell aggregation observed, particularly when cells were seeded at high densities (ρseed ≥ 1.5 × 10⁶ cells/ml, Fig. 1d). The cells were distributed evenly within a spot of roughly 70 μm in thickness, and had a similar morphology to those in 3D cultures in microtiter plates (data not shown). However, the chip platform facilitated cell culturing at extremely high seeding densities (ρseed = 17 × 106 cells/ml, Fig. 1d) without loss of viability. The spherical shape of the cells has been proposed to result from a lack of interaction/adherence of the cells to the negatively charged guluronate and mannuronate residues of the alginate (28). It is noteworthy that despite the absence of such interaction, and as shown by Lee et al. (32), the cells are able to grow within the 3D matrix, particularly in the microarray.
Cell Growth
The influence of a 3D environment on cell proliferation for cell cultures in alginate matrices was analyzed by comparing HepG2 cells seeded at 5,000 - 40,000 cells/well in 2D and 3D environments within 96-well microtiter plates. Cells cultured as 2D monolayers expanded exponentially for the first 3 days, and then grew more slowly for the remaining day, reaching a plateau at approximately 115,000 cells/well for the highest seeding density used (Fig. 2a). The calculated specific growth rates (μ, Fig. 2b) decreased considerably with increased seeding density, and are consistent with the range of values reported in the literature for monolayer culture (μ = 0.28 - 0.58 day-1).(36-39) The dependence of μ on seeding density likely results from contact inhibition and perhaps decreased nutrient availability, particularly at higher seeding densities.
Figure 2.
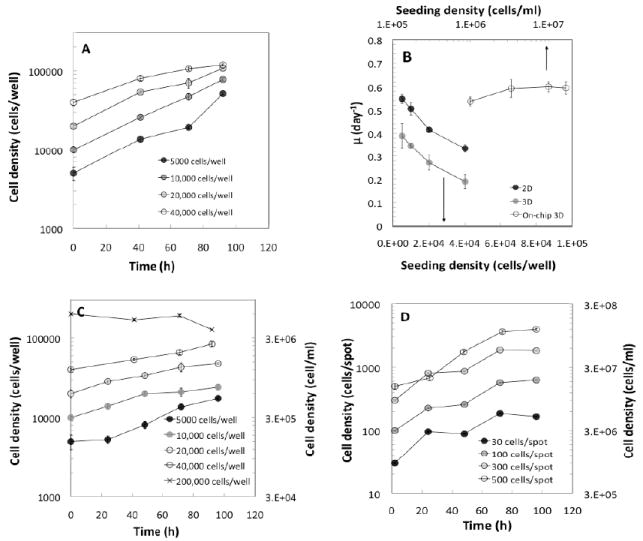
Comparison of cell proliferation in the three culture platforms. (A), (C), and (D) show the growth curves of cells in 2D, 3D, and on-chip 3D cultures, respectively, at various seeding densities. (B) Cell expansion as a function of seeding density. Seeding density is expressed as the number of cells per well for both 2D and 3D cultures in microtiter plates (lower x-axis), and as number of cells/ml for 3D cultures (upper x-axis).
Growth curves of cells embedded in 3D alginate matrices in microtiter wells (Fig. 2c) showed significantly lower rates of proliferation compared to those of the 2D monolayer cultures (Fig. 2b), and failed to reach the final number of cells obtained at confluence in 2D environments. The values of μ also decreased with initial seeding density in 3D (Fig. 2b). For example, cultures seeded at 200,000 cells/well (5 × 10⁶ cells/ml) showed no proliferation, but viability remained relatively high throughout the duration of the experiment (Fig. 2c). Space constraints do not appear to limit cell growth in the 3D cultures, particularly at such low initial cell densities (< 40,000 cells/well, or 1 × 10⁶ cells/ml) based on the micrographs shown in Fig. 1. Instead, our results are consistent with greater oxygen transport limitations in the 3D well plate cultures. This idea was explored by simulating the dissolved oxygen concentration profiles across the cultures as a function of seeding density, using a simple two-layer reaction-diffusion model in a steady-state, stagnant system (Supporting Information). The preliminary analysis suggests the presence of variable concentration gradients for all cell densities (Fig. S1a), reaching oxygen concentrations as low as 10% of the surface value for the highest density plotted, 1 × 10⁶ cells/ml. These results are consistent with greater O2 transport limitations in the well plate in a stagnant system.
The evolution of viable cell number was also followed on alginate gel spots inoculated with HepG2 cells at four different densities: 30, 100, 300, and 500 cells/spot (1 × 10⁶ - 17 × 106 cells/ml) (Fig. 2d). The growth rate obtained in 3D environments at the nanoliter scale was similar to that of the 2D monolayer cultures at the lowest seeding density (Fig. 2b). This suggests that the 1000-fold scale-down in culture size (40 μl to 30 nl) helps circumvent the oxygen transport limitations of the 3D cultures at larger scales, despite having initial cell densities that are up to two orders of magnitude greater than those in the microtiter plate. Moreover, the specific growth rates for the 3D microarray cultures did not vary significantly with initial cell density. Assuming a static layer of medium above the spots, our simulations indicate that the oxygen concentration at the bottom of the spots is > 95% of the concentration at the air-liquid interface for a cell density of 1 × 10⁶ cells/ml, and only estimates significant oxygen diffusion barriers (~50% of the surface concentration at the bottom of the chamber) for the highest density plotted, 1.7 × 10⁷ cells/ml (Fig. S1b). However, since the specific growth rates measured experimentally did not vary significantly with initial cell density, it is likely that cell growth in these cultures is not significantly constrained by either oxygen transport or by contact inhibition, even at the high densities achieved after 5 days of culture (~ 1,800 cells/spot, or 6 × 10⁷ cells/ml).
Antiproliferative Activity of Drugs in 2D and 3D Microtiter Cultures
The antiproliferative effects of four model compounds (doxorubicin, tamoxifen, amitriptyline, and 5-fluorouracil) were determined for cells seeded at four different cell densities in 2D monolayer and 3D microtiter cultures following 24 h drug incubation and subsequent 72 h incubation in complete media. The sigmoidal dose-response cytotoxicity profiles of the four compounds in 2D and 3D are shown in Fig. S2 and the log IC50 values calculated from these data are included in Fig. 3. HepG2 cells in both 2D and 3D cultures showed increased resistance to all four drugs with increasing seeding density. This effect was particularly significant for doxorubicin and 5-fluorouracil, and is consistent with previous work where confluence-dependent resistance to anthracyclines, including doxorubicin, and other anticancer agents was reported. (40,41) Interestingly, when comparing the potency of doxorubicin in 2D and 3D cultures at a similar seeding density, we observe no statistically significant difference in the IC50 values at any seeding density. In the case of tamoxifen, a slight increase in chemoresitance was observed in the 3D matrices when compared to the 2D monolayers in two of the seeding densities (10,000 and 20,000 cells/well). On the other hand, we observed a small decrease in chemoresistance in the 3D cultures for amitriptyline and 5-fluorouracil at 40,000 cells/well only. Our results suggest that the increased chemoresistance to anticancer drugs often reported in 3D models results largely from the effects of cell confluency and hypoxia.
Figure 3.
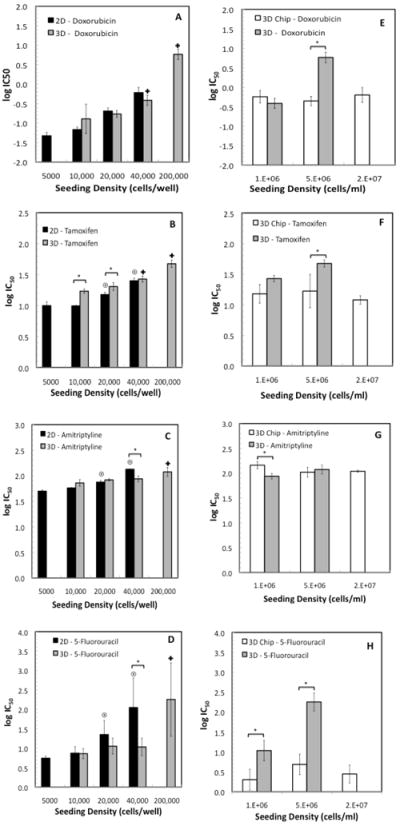
Comparison of the antiproliferative effect of doxorubicin, tamoxifen, amitriptyline and 5-fluorouracil in cells grown in 2D monolayers (black columns), 3D cultures (gray columns), and 3D microarray cultures (white columns). Statistically significant changes (p<0.05) in log IC50 values of cells seeded at different seeding densities in 2D cultures with respect to the lowest seeding density (5000 cells/well) are represented with the (◉), while for 3D cultures with the (□), having as a reference the 5,000 and 10,000 cells/well culture, respectively. The (*) represent statistically significant changes between 2D and 3D cultures at a fixed seeding density in figures 3A-3D, and between 3D and 3D microarray cultures in figures 3E-3H. IC50 values are given in μM.
Influence of Scale-Down on Growth Inhibition in 3D Environments
The effect of scaling down 3D environments on drug potency was investigated by comparing the dose-response curves of cells cultured in microtiter plates to those cultured in the microarrays. The resistance of the cells to all four drugs did not change significantly with seeding density within the range studied (1 × 10⁶ to 17 × 106 cells/ml). This is in sharp contrast to the increased chemoresistance as a function of seeding density observed in the microtiter-based cultures, and results in increasingly larger deviations of the log IC50 values on-chip and in-plate at the highest cell densities, particularly for those drugs whose potency showed the strongest cell density dependence, doxorubicin and 5-fluorouracil.
Relatively good agreement between the 3D microarray log IC50 values and the corresponding 2D values was demonstrated for all four drugs at low seeding density (Fig. S3, with 5,000 cells/well as a reference value). Small, yet statistically significant increases in chemoresistance were, however, observed for doxorubicin and amitriptyline.
Comparison of Protein Expression Profile in 2D and 3D Cultures
An immunofluorescence assay was performed in both the 2D cultures and the 3D microarray cultures to assess the differential expression of proteins involved in proliferation, angiogenesis, adhesion, and drug metabolism. First we compared the expression of three cytochrome P450 (CYP450) enzymes--CYP1A1, CYP2C9, and CYP3A4. Elimination of drugs in the body requires biotransformation of what are mostly hydrophobic compounds to hydrophilic metabolites, which can be more or less toxic than their parent compounds. CYPs are an important class of Phase I metabolizing enzymes that catalyze hydrolysis, reduction, and oxidation reactions. (42) In particular, the CYP1, CYP2, and CYP3 families account for nearly 90% of drug metabolism. (28) Increased expression of all three probed CYP450s was observed in the 3D microarrays, where CYP3A4 and CYP2C9 showed particularly large up-regulation with 5.3-fold and 4.7-fold enhancements, respectively, in expression compared to the 2D cultures (Fig. 4). This suggests the 3D alginate matrices provide a more in vivo-like environment allowing the HepG2 cells to partially regain liver-specific functions, such as their ability to synthesize CYPs.
Figure 4.
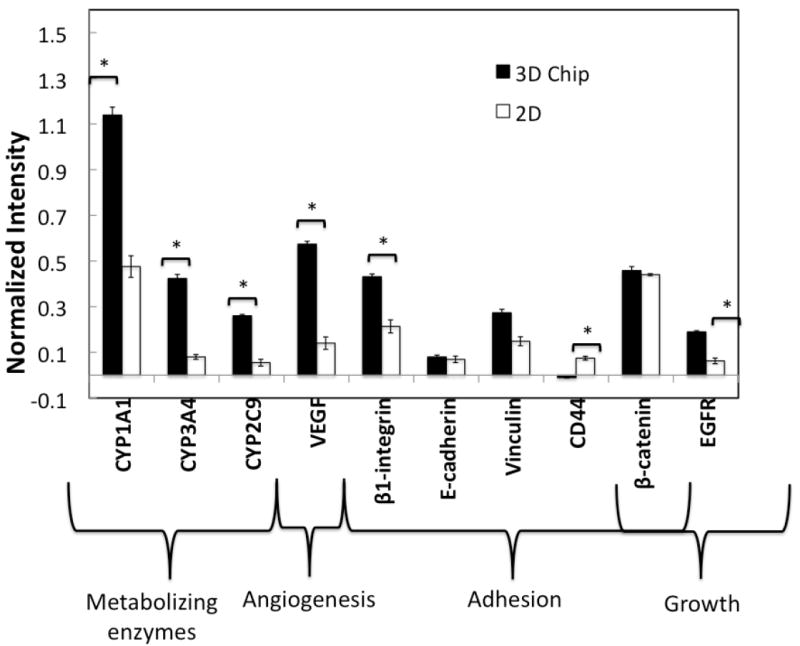
Differential expression of proteins involved in drug metabolism, proliferation, adhesion and angiogenesis in 2D monolayer cultures seeded at 5 × 10⁴ cells/cm2, and in 3D microarray cultures seeded with 6.7 × 10⁶ cells/ml. The cells were cultured for 3 days in complete media, and subsequently assayed with an in-cell immunofluorescence assay. Statistical significance between the normalized intensity of 2D and 3D microcultures is represented with (*) for p<0.05. GAPDH was used as a loading control to normalize the fluorescence signal.
Tissue architecture, as well as the chemical and mechanical properties of 3D cellular microenvironments, has been shown to influence the expression of proteins involved in cell-cell and cell-matrix adhesion, such as integrins, cadherins, catenins, and members of the CD44 family. These proteins, in turn, are thought to regulate a host of 3D-dependent cell properties and behavioral characteristics, such as cell shape, cell growth, morphogenesis, motility, differentiation and drug resistance. (6,43) The differential expression of several adhesion-related molecules, β1-integrin, vinculin CD44, β-catenin, and E-cadherin, was probed in 2D and 3D on-chip environments (Fig. 4). Only β1-integrin was significantly up-regulated in the 3D cultures (2-fold enhancement), whereas β-catenin was slightly down-regulated. Overexpression of EGFR in the 3D microarray cultures was also observed. Increased expression of this receptor has been implicated in increased β1-integrin activity in mammary epithelial cells, through an EGF/MAPK pathway. (16)
Vascular endothelial growth factor (VEGF), which is responsible for stimulating vascularization, is often overexpressed in tumor cells, allowing growth and metastasis of a tumor in vivo. A 4-fold increase in VEGF expression was observed in the 3D microarray cultures when compared to 2D monolayer cultures (Fig. 4). Up-regulation of this growth factor is important in drug and toxicity screening of anti-cancer agents, since VEGF can lead to angiogenesis, a known regulator of drug resistance in tumors. (44) It is noteworthy that quantitative immunofluorescence data are in good agreement with the qualitative assessment of expression of CYP1A1, β1-integrin, vinculin, and EGFR obtained from the fluorescence images taken using confocal microscopy (Fig. S4).
DISCUSSION
There is a long-standing, although somewhat anecdotal, opinion in the scientific community that 3D culture environments will help us bridge the gap between the phenotype and function of cells cultured in 2D monolayers, and that of cells in live tissue. Studies in these systems have identified complex interacting roles of matrix stiffness and composition, cell adhesion molecules (particularly integrins), growth factor receptors, hypoxia, and signaling in diverse areas, such as development and cancer. Nonetheless, the implementation of in vitro 3D models in HT drug and toxicity screening has remained elusive.
The establishment of more predictive 3D cell-based screens for drug efficacy and toxicity testing requires both the development of high throughput platforms that enable rapid and reproducible testing of 3D cultures, and a fundamental understanding of the mechanisms that drive the differential response of the 2D and 3D cultures to various stimuli and environmental factors. This is a challenging task that involves decoupling of variables such as structural organization of cells, cell-cell and cell-matrix interactions, mechanical and biochemical cues, cell density, and nutrient and drug penetration. The aim of the current study was to examine the growth, drug response, and expression of key proteins of HepG2 cells in 3D alginate-based microarray cultures on a chip-based platform in comparison to conventional 2D monolayer and 3D microtiter-based cultures. This comparison would provide direct information on the impact of culture dimensionality and scale-down on the aforementioned end points. In these comparisons, the cell density was varied from 1.5 × 10⁴ - 12 × 104 cells/cm2 for 2D microtiter-based cultures, 1.3 × 10⁵ – 5.0 × 10⁶ cells/ml for 3D microtiter-based cultures, and 1.0 × 10⁶ - 17 × 106 cells/ml for 3D chip-based microarray cultures. Cell density has been shown to affect, either directly or indirectly, cell cycle, drug absorption, oxygen diffusion and uptake, and cell adhesion, and has thus been implicated in changes in cell behavior, particularly in drug resistance. (40,41,45)
Seeding density in 2D and 3D cultures in the microtiter plates influenced cell proliferation, with the 3D cultures showing much lower rates of proliferation than 2D cultures. Nutrient restrictions, most likely dissolved oxygen availability, may explain both the cell density dependence, as well as the lower growth rates observed in the relatively thick 3D gels. Indeed, hypoxic conditions are known to induce cell cycle arrest at the G0/G1 and G1/S transitions. (46-48) The predicted oxygen concentration profiles from a simplified reaction-diffusion model are consistent with the experimental growth data, although deviations are expected particularly at very high seeding densities, for which cellular metabolism should slow down causing changes in the oxygen consumption rate. A more rigorous analysis of the possible nutrient transport limitations in our culture platforms that accounts for cell growth and distribution as a function of time, and considers coupled glucose-oxygen gradients, is currently underway.
Oxygen transport limitations appear to be reduced in miniaturized cultures on the chip, since the rate of proliferation is comparable to 2D cultures, with no appreciable dependence on cell number, even at densities three-times greater than the highest density studied in the 3D microtiter-cultures. In contrast, 3D microtiter-cultures at the highest seeding density appear to have considerable barriers to oxygen diffusion through the gel leading to no proliferation and instead only the maintenance of culture viability throughout the duration of the experiment.
Multidrug resistance (MDR) plays a major role in the failure of certain chemotherapeutic agents for treatment of solid tumors. (40) The development of MDR was originally ascribed to functional genetic mutations and changes in the expression of certain genes encoding proteins involved in the uptake and metabolism of cytotoxic drugs. (46) However, genetic models cannot fully explain the relationship between tumor mass and drug resistance observed clinically. MDR has been reproduced in vitro by growing cells as confluent cultures (confluence-dependent resistance, CDR) or as multicellular spheroids (multicellular resistance), revealing a correlation between the level of resistance to a compound and the degree of confluence of the cultures. (26,41) Our cytotoxicity results in 2D- and 3D-microtiter cultures are consistent with these previously observed trends, as we observed a correlation between chemoresistance and cell density that was particularly strong for doxorubicin and 5-fluorouracil.
Several mechanisms have been invoked to explain CDR, such as poor vascularization of tumors and low drug penetration, the presence of an acidic pH, and an increased proportion of non-proliferating cells. This latter hypothesis stipulates than cells arrested in long quiescent phases are not as susceptible to drug-induced apopotosis, which is highly dependent on the active progression of the cell cycle. In the current experiments, oxygen transport limitations and cell-cell contacts appear to be responsible for the decrease in growth rates observed with increasing cell density for both types of cultures. This result is indicative of an increased proportion of non-cycling cells at higher densities. Moreover, results in the literature suggest that CDR is especially important for cell-cycle specific drugs, i.e., compounds that display their maximum activity in certain phases of the cycle, such as doxorubicin and 5-fluouracil. (40) Doxorubicin inhibits topoisomerase II, which is responsible for unwinding DNA for transcription and acts by intercalating with DNA, thus stopping replication and inducing cell death by apoptosis. Topoisomerase II inhibitors are most active when cells are in the S phase, since the target enzyme is highly expressed in this phase. (40) Similarly, the target of 5-fluorouracil is thymidilate synthase, which is most active in S-phase cells. (35) This proposed mechanism for CDR is also in good agreement with on-chip cytotoxicity results. In this case, no dependence of either proliferation rates or IC50 values was observed with increased seeding density, suggesting a low and relatively constant proportion of non-cycling cells within the cell density range studied, and thus no development of CDR.
Overall, it appears that nutrient restrictions, like those observed in the 3D cultures in microtiter plates, might more closely mimic in vivo tissue and tumor microenvironments than the uniformly oxygenated on-chip 3D cultures. Thus, the response of 3D cultures in microtiter plates to specific drug challenges may more accurately represent tissue response to these drugs. However, these limitations also introduce potential confounding variables to these 3D models, which can be dealt with separately and more effectively in the 3D microarray cultures, for example, by externally establishing hypoxic conditions or defined oxygen gradients.
It is important to note that other mechanisms, in addition to inhibition of cell-cycle progression, may contribute to development of drug resistance at higher cell densities. (43) For example, Graham and coworkers (41) found that CDR in breast cancer cells is not mediated by cell-cycle progression and requires the activity of hypoxia-inducible factor (HIF-1), a key transcriptional regulator of cellular adaptations to hypoxia. Hypoxia can also cause changes in the potency of drugs whose activity is mediated by free radicals. Doxorubicin, for example, undergoes reduction to a semiquinone radical that in turn reduces oxygen to a superoxide contributing to cytotoxicity at high oxygen concentrations. (49)
Cell-cell and cell-matrix interactions have also been implicated in the development of adhesion-mediated drug resistance, where overexpression of cell adhesion molecules can enhance pro-survival signaling. For example, β1-integrin mediated adhesions are believed to contribute to de novo drug resistance, (49), and their inhibition can significantly increase the sensitivity of cancer cell lines to certain chemotherapeutic agents. (9) On-chip, in-cell immunofluorescence experiments revealed overexpression of β1-integrin in cells cultured on chip in the 3D environments compared to 2D monolayers. Except for CD44, which was slightly down-regulated, none of the other adhesion proteins we examined showed significant changes in expression between 2D and 3D culture environments.
Several studies have reported that the basal expression levels of most CYP metabolizing enzymes in HepG2 cells are considerably lower than in primary human hepatocytes. (50,51) Since the HepG2 cell line is one of the most widely used models in pharmacological and toxicological studies, previous researchers have suggested that the low expression of CYPs in this cell line may be partially responsible for the high rate of missed or underestimated cytotoxicity in the early in vitro screening of compounds. We showed that members of several CYP families were overexpressed on chip, suggesting that the 3D microarray cultures can simulate native microenvironments more faithfully than 2D cultures, and can result in the restoration of in vivo cell functions. The toxicity of compounds that are reactive to these CYP isoforms can then be activated or deactivated in the cells. For example, CYP3A4 can deactivate both doxorubicin and tamoxifen (32), whereas CYP2D6 is a well-know activator of tamoxifen. (52) While increased resistance was observed towards both of these drugs in the 3D microarray cultures compared to the 2D-based cultures (Fig. S3), the differences were small and may be confounded by the seeding density dependence of cytotoxicity observed in 2D monolayers.
CONCLUSIONS
In this study we have examined basic differences in cell proliferation, cytotoxicity and protein expression of cells cultured in 2D and 3D alginate environments. A 3D microarray culture platform previously developed for HT toxicology assays (32) has been used to eliminate concerns about oxygen transport limitations prevalent in larger volume 3D cultures. Ultimately, this miniaturized platform allowed us to overcome the cell density dependence of proliferation observed in 2D and 3D cultures at the microtiter scale, and associated confluence-dependent drug resistance. This approach thereby facilitates the decoupling of variables that affect drug resistance such as hypoxia, cell quiescence, and cell adhesion. Moreover, we demonstrated the use of an on-chip, in-cell immunofluorescence assay to facilitate the investigation of key variables involved in 3D-dependent cell behavior and signaling in a HT fashion. Overall, this platform provides a reductionist strategy to understanding molecular mechanisms in 3D environments (6), using the tools of cell and molecular biology.
Supplementary Material
Acknowledgments
The authors would like to thank Dr. Seok Joon Kwon, Dr. Helder Barbosa, and Dr. Mauricio Mora-Pale for helpful discussions. This research was supported by the New York State Stem Cell Science initiative (contract number C024334) and by the National Institutes of Health (ES-020903).
Footnotes
Publisher's Disclaimer: This is a PDF file of an unedited manuscript that has been accepted for publication. As a service to our customers we are providing this early version of the manuscript. The manuscript will undergo copyediting, typesetting, and review of the resulting proof before it is published in its final citable form. Please note that during the production process errors may be discovered which could affect the content, and all legal disclaimers that apply to the journal pertain.
References
- 1.Food and Drug Administration. US Department of Human and Health Services. Food and Drug Administration; 2004. Innovation or stagnation: challenge and opportunity on the critical path to new medical products. Online. Availabe from URL: http://www.fda.gov/ScienceResearch/SpecialTopics/CriticalPathInitiative/CriticalPathOpportunitiesReports/ucm077262.htm. [Google Scholar]
- 2.Pampaloni F, Stelzer EHK, Masotti A. Three-dimensional tissue models for drug discovery and toxicology. Recent Pat Biotechnol. 2009;3(2):103–17. doi: 10.2174/187220809788700201. [DOI] [PubMed] [Google Scholar]
- 3.Breier JM, Radio NM, Mundy WR, Shafer TJ. Development of a high-throughput screening assay for chemical effects on proliferation and viability of immortalized human neural progenitor cells. Toxicol Sci. 2008;105(1):119–33. doi: 10.1093/toxsci/kfn115. [DOI] [PubMed] [Google Scholar]
- 4.Krewski D, Westphal M, Al-zoughool M, Croteau MC, Andersen ME. New directions in toxicity testing. Annu Rev Public Health. 2011;32:161–78. doi: 10.1146/annurev-publhealth-031210-101153. [DOI] [PubMed] [Google Scholar]
- 5.Chen P-C, Huang Y-Y, Juang J-L. MEMS microwell and microcolumn arrays: novel methods for high-throughput cell-based assays. Lab Chip. 201;11(21):3619–25. doi: 10.1039/c0lc00696c. [DOI] [PubMed] [Google Scholar]
- 6.Yamada KM, Cukierman E. Modeling tissue morphogenesis and cancer in 3D. Cell. 2007;130(4):601–10. doi: 10.1016/j.cell.2007.08.006. [DOI] [PubMed] [Google Scholar]
- 7.Schmeichel KL, Bissell MJ. Modeling tissue-specific signaling and organ function in three dimensions. J Cell Sci. 2003;116(12):2377–88. doi: 10.1242/jcs.00503. [DOI] [PMC free article] [PubMed] [Google Scholar]
- 8.Pampaloni F, Reynaud EG, Stelzer EHK. The third dimension bridges the gap between cell culture and live tissue. Nat Rev Mol Cell Biol. 2007;8(10):839–45. doi: 10.1038/nrm2236. [DOI] [PubMed] [Google Scholar]
- 9.Weigelt B, Lo AT, Park CC, Gray JW, Bissell MJ. HER2 signaling pathway activation and response of breast cancer cells to HER2-targeting agents is dependent strongly on the 3D microenvironment. Breast Cancer Res Treat. 2010;122(1):35–43. doi: 10.1007/s10549-009-0502-2. [DOI] [PMC free article] [PubMed] [Google Scholar]
- 10.Streuli CH, Bailey N, Bissell MJ. Control of mammary epithelial differentiation: basement membrane induces tissue-specific gene expression in the absence of cell-cell interaction and morphological polarity. J Cell Biol. 1991;115(5):1383–95. doi: 10.1083/jcb.115.5.1383. [DOI] [PMC free article] [PubMed] [Google Scholar]
- 11.Liu H, Radisky DC, Wang F, Bissell MJ. Polarity and proliferation are controlled by distinct signaling pathways downstream of PI3-kinase in breast epithelial tumor cells. J Cell Biol. 2004;164(4):603–12. doi: 10.1083/jcb.200306090. [DOI] [PMC free article] [PubMed] [Google Scholar]
- 12.Weaver VM, Petersen OW, Wang F, Larabell Ca, Briand P, Damsky C, et al. Reversion of the malignant phenotype of human breast cells in three-dimensional culture and in vivo by integrin blocking antibodies. J Cell Biol. 1997;137(1):231–45. doi: 10.1083/jcb.137.1.231. [DOI] [PMC free article] [PubMed] [Google Scholar]
- 13.Streuli CH, Schmidhauser C, Bailey N, Yurchenco P, Skubitz APN, Roskelley C, et al. Laminin mediates tissue-specific gene expression. J Cell Biol. 1995;129(3):591–603. doi: 10.1083/jcb.129.3.591. [DOI] [PMC free article] [PubMed] [Google Scholar]
- 14.Debnath J, Brugge JS. Modelling glandular epithelial cancers in three-dimensional cultures. Nat Rev Cancer. 2005;5(9):675–88. doi: 10.1038/nrc1695. [DOI] [PubMed] [Google Scholar]
- 15.Streuli C. Extracellular matrix remodelling and cellular differentiation. Curr Opin Cell Biol. 1999;11(5):634–40. doi: 10.1016/s0955-0674(99)00026-5. [DOI] [PubMed] [Google Scholar]
- 16.Wang F, Weaver VM, Petersen OW, Larabell CA, Dedhar S, Briand P, et al. Reciprocal interactions between β1. Reciprocal interactions between 1-integrin and epidermal growth factor receptor in three-dimensional basement membrane breast culture: A different perspective in epithelial biology. Proc Natl Acad Sci U S A. 1998;95:14821–6. doi: 10.1073/pnas.95.25.14821. [DOI] [PMC free article] [PubMed] [Google Scholar]
- 17.Dvir-Ginzberg M, Gamlieli-Bonshtein I, Agbaria R, Cohen S. Liver tissue engineering within alginate scaffolds: morphology, and function. Tissue Eng. 2003;9(4):757–71. doi: 10.1089/107632703768247430. [DOI] [PubMed] [Google Scholar]
- 18.Selden C, Shariat A, Mccloskey P, Ryder T, Roberts E, Hodgson H. Three-dimensional in vitro cell culture leads to a marked upregulation of cell function in human hepatocyte cell lines-an important tool for the development of a bioartificial liver machine. Ann N YAcad Sci. 2006;875:353–63. doi: 10.1111/j.1749-6632.1999.tb08517.x. [DOI] [PubMed] [Google Scholar]
- 19.Horiuchi S-I, Ishida S, Hongo T, Ishikawa Y, Miyajima A, Sawada J-I, et al. Global gene expression changes including drug metabolism and disposition induced by three-dimensional culture of HepG2 cells-Involvement of microtubules. Biochem Biophys Res Commun. 2009;378(3):558–62. doi: 10.1016/j.bbrc.2008.11.088. [DOI] [PubMed] [Google Scholar]
- 20.Altmann B, Giselbrecht S, Weibezahn K-F, Welle A, Gottwald E. The three-dimensional cultivation of the carcinoma cell line HepG2 in a perfused chip system leads to a more differentiated phenotype of the cells compared to monolayer culture. Biomed Mater. 2008;3:034120. doi: 10.1088/1748-6041/3/3/034120. [DOI] [PubMed] [Google Scholar]
- 21.Kataoka K, Nagao Y, Nukui T, Akiyama I, Tsuru K, Hayakawa S, et al. An organic-inorganic hybrid scaffold for the culture of HepG2 cells in a bioreactor. Biomaterials. 2005;26(15):2509–16. doi: 10.1016/j.biomaterials.2004.07.012. [DOI] [PubMed] [Google Scholar]
- 22.Bokhari M, Carnachan RJ, Cameron NR, Przyborski Sa. Culture of HepG2 liver cells on three dimensional polystyrene scaffolds enhances cell structure and function during toxicological challenge. J Anat. 2007;211(4):567–76. doi: 10.1111/j.1469-7580.2007.00778.x. [DOI] [PMC free article] [PubMed] [Google Scholar]
- 23.Elkayam T, Ph D, Amitay-shaprut S. Enhancing the drug metabolism activities of C3A — a human hepatocyte cell line — by tissue engineering. Tissue Eng. 2006;12(5):1357–70. doi: 10.1089/ten.2006.12.1357. [DOI] [PubMed] [Google Scholar]
- 24.Horning JL, Sahoo SK, Vijayaraghavalu S. Dimitrijev Mol Pharmaceutics. 2008;5(5):849–62. doi: 10.1021/mp800047v. [DOI] [PubMed] [Google Scholar]
- 25.Loessner D, Stok KS, Lutolf MP, Hutmacher DW, Clements Ja, Rizzi SC. Bioengineered 3D platform to explore cell-ECM interactions and drug resistance of epithelial ovarian cancer cells. Biomaterials. 2010;31(32):8494–506. doi: 10.1016/j.biomaterials.2010.07.064. [DOI] [PubMed] [Google Scholar]
- 26.Li C, Tian TAO, Nan K, Zhao NA, Guo Y, Cui JIE, et al. Survival advantages of multicellular spheroids vs. monolayers of HepG2 cells in vitro. Oncol Rep. 2008:1465–71. [PubMed] [Google Scholar]
- 27.David L, Dulong V, Le Cerf D, Cazin L, Lamacz M, Vannier J-P. Hyaluronan hydrogel: an appropriate three-dimensional model for evaluation of anticancer drug sensitivity. Acta Biomater. 2008;4(2):256–63. doi: 10.1016/j.actbio.2007.08.012. [DOI] [PubMed] [Google Scholar]
- 28.Lan S-F, Safiejko-Mroczka B, Starly B. Long-term cultivation of HepG2 liver cells encapsulated in alginate hydrogels: a study of cell viability, morphology and drug metabolism. Toxicol In Vitro. 2010;24(4):1314–23. doi: 10.1016/j.tiv.2010.02.015. [DOI] [PubMed] [Google Scholar]
- 29.Derda R, Laromaine A, Mammoto A, Tang SKY, Mammoto T, Ingber DE, et al. Paper-supported 3D cell culture for tissue-based bioassays. Proc Natl Acad Sci U S A. 2009;106(44):18457–62. doi: 10.1073/pnas.0910666106. [DOI] [PMC free article] [PubMed] [Google Scholar]
- 30.Tung YC, Hsiao AY, Allen SG, Torisawa YS, Ho M, Takayama S. High-throughput 3D spheroid culture and drug testing using a 384 hanging drop array. Analyst. 2011;136:473–8. doi: 10.1039/c0an00609b. [DOI] [PMC free article] [PubMed] [Google Scholar]
- 31.Khademhosseini A, Langer R, Borenstein J, Vacanti JP. Microscale technologies for tissue engineering and biology. Proc Natl Acad Sci U S A. 2006;103(8):2480–7. doi: 10.1073/pnas.0507681102. [DOI] [PMC free article] [PubMed] [Google Scholar]
- 32.Lee M-Y, Kumar RA, Sukumaran SM, Hogg MG, Clark DS, Dordick JS. Three-dimensional cellular microarray for high-throughput toxicology assays. Proc Natl Acad Sci U S A. 2008;105(1):59–63. doi: 10.1073/pnas.0708756105. [DOI] [PMC free article] [PubMed] [Google Scholar]
- 33.Fernandes TG, Kwon S-J, Bale SS, Lee M-Y, Diogo MM, Clark DS, et al. Three-dimensional cell culture microarray for high-throughput studies of stem cell fate. Biotechnol Bioeng. 2010;106(1):106–18. doi: 10.1002/bit.22661. [DOI] [PMC free article] [PubMed] [Google Scholar]
- 34.Fernandes TG, Kwon S, Lee M, Clark DS, Cabral JMS, Dordick JS. Immunofluorescence assay for high-throughput analysis of target proteins. Anal Chem. 2008;80(17):6633–9. doi: 10.1021/ac800848j. [DOI] [PMC free article] [PubMed] [Google Scholar]
- 35.Longley DB, Harkin DP, Johnston PG. 5-fluorouracil: mechanisms of action and clinical strategies. Nat Rev Cancer. 2003;3(5):330–8. doi: 10.1038/nrc1074. [DOI] [PubMed] [Google Scholar]
- 36.Qian C, Bilbao R, Bruña O, Prieto J. Induction of sensitivity to ganciclovir in human hepatocellular carcinoma cells by adenovirus-mediated gene transfer of herpes simplex virus thymidine kinase. Hepatology. 1995;22(1):118–23. [PubMed] [Google Scholar]
- 37.Vashist Y-K, Tiffon C, Stoupis C, Redaelli C-A. Inhibition of hepatic tumor cell proliferation in vitro and tumor growth in vivo by taltobulin, a synthetic analogue of the tripeptide hemiasterlin. World J Gastroenterol. 2006;12(42):6771–8. doi: 10.3748/wjg.v12.i42.6771. [DOI] [PMC free article] [PubMed] [Google Scholar]
- 38.Pullinger CR, North JD, Teng B, Rifici VA, De AER, Scott J. The apolipoprotein B gene is constitutively expressed in HepG2 cells: regulation of secretion by oleic acid, albumin, and insulin, and measurement of the mRNA half-life. J Lipid Res. 1989;30:1065–77. [PubMed] [Google Scholar]
- 39.O’Brien J, Wilson I, Orton T, Pognan F. Investigation of the Alamar Blue (resazurin) fluorescent dye for the assessment of mammalian cell cytotoxicity. Eur J Biochem. 2000;267(17):5421–6. doi: 10.1046/j.1432-1327.2000.01606.x. [DOI] [PubMed] [Google Scholar]
- 40.Chauffert B, Dimanche-Boitrel M-T, Garrido C, Ivarsson M, Martin M, Martin F, et al. New insights into the kinetic resistance to anticancer agents. Cytotechnology. 1998;27(1-3):225–35. doi: 10.1023/A:1008025124242. [DOI] [PMC free article] [PubMed] [Google Scholar]
- 41.Fang Y, Sullivan R, Graham CH. Confluence-dependent resistance to doxorubicin in human MDA-MB-231 breast carcinoma cells requires hypoxia-inducible factor-1 activity. Exp Cell Res. 2007;313(5):867–77. doi: 10.1016/j.yexcr.2006.12.004. [DOI] [PubMed] [Google Scholar]
- 42.Hebbar V, Kong TA-N. Signal transduction pathways involved in the regulation of drug metabolizing enzymes. In: Storey KB, Storey JM, editors. Cell and molecular biology of stress. sensing, signaling and cell adaptation. Amsterdam: Elsevier Press; 2002. pp. 221–31. [Google Scholar]
- 43.Hazlehurst La, Dalton WS. Mechanisms associated with cell adhesion mediated drug resistance (CAM-DR) in hematopoietic malignancies. Cancer Metastasis Rev. 2001;20(1-2):43–50. doi: 10.1023/a:1013156407224. [DOI] [PubMed] [Google Scholar]
- 44.Kerr DJ, Wheldon TE, Kerr AM, Freshney RI, Kaye SB. Survival of human lung tumour cells grown in monolayer and as spheroids. Br J Cancer. 1986;54:423–9. doi: 10.1038/bjc.1986.193. [DOI] [PMC free article] [PubMed] [Google Scholar]
- 45.Millerot-Serrurot E, Guilbert M, Fourré N, Witkowski W, Said G, Van Gulick L, et al. 3D collagen type I matrix inhibits the antimigratory effect of doxorubicin. Cancer Cell Int. 2010;10:26. doi: 10.1186/1475-2867-10-26. [DOI] [PMC free article] [PubMed] [Google Scholar]
- 46.Trédan O, Galmarini CM, Patel K, Tannock IF. Drug resistance and the solid tumor microenvironment. J Natl Cancer Inst. 2007;99(19):1441–54. doi: 10.1093/jnci/djm135. [DOI] [PubMed] [Google Scholar]
- 47.Schmaltz C, Hardenbergh PH, Fisher DE. Regulation of proliferation-survival decisions during tumor cell hypoxia. Mol Cell Biol. 1998;18(5):2845–54. doi: 10.1128/mcb.18.5.2845. [DOI] [PMC free article] [PubMed] [Google Scholar]
- 48.Gardner LB, Li Q, Park MS, Flanagan WM, Semenza GL, Dang CV. Hypoxia inhibits G1/S transition through regulation of p27 expression. J Biol Chem. 2001;276(11):7919–26. doi: 10.1074/jbc.M010189200. [DOI] [PubMed] [Google Scholar]
- 49.Elliott NT, Yuan F. A review of three-dimensional in vitro tissue models for drug discovery and transport studies. J Pharm Sci. 2011;100(1):2–8. doi: 10.1002/jps.22257. [DOI] [PubMed] [Google Scholar]
- 50.Westerink WM, Schoonen WGEJ. Cytochrome P450 enzyme levels in HepG2 cells and cryopreserved primary human hepatocytes and their induction in HepG2 cells. Toxicol In Vitro. 2007;21(8):1581–91. doi: 10.1016/j.tiv.2007.05.014. [DOI] [PubMed] [Google Scholar]
- 51.Guo L, Dial S, Shi L, Branham W, Liu J, Fang J, et al. Similarities and differences in the expression of drug-metabolizing enzymes between human hepatic cell lines and primary human hepatocytes. Drug Metab Dispos. 2011;39(3):528–38. doi: 10.1124/dmd.110.035873. [DOI] [PMC free article] [PubMed] [Google Scholar]
- 52.Frankie B, Holmes A, Jeffrey D, Craig V. Pharmacogenomics of Tamoxifen in a Nutshell — And Who Broke the Nutcracker? New Understanding of Tamoxifen Metabolism: In a Nutshell. J Oncol Pract. 2005:155–9. doi: 10.1200/jop.2005.1.4.155. [DOI] [PMC free article] [PubMed] [Google Scholar]
Associated Data
This section collects any data citations, data availability statements, or supplementary materials included in this article.