

SUMMARY
Making sense of the world requires us to process information over multiple timescales. We sought to identify brain regions that accumulate information over short and long timescales and to characterize the distinguishing features of their dynamics. We recorded electrocorticographic (ECoG) signals from individuals watching intact and scrambled movies. Within sensory regions, fluctuations of high-frequency (64–200 Hz) power reliably tracked instantaneous low-level properties of the intact and scrambled movies. Within higher order regions, the power fluctuations were more reliable for the intact movie than the scrambled movie, indicating that these regions accumulate information over relatively long time periods (several seconds or longer). Slow (<0.1 Hz) fluctuations of high-frequency power with time courses locked to the movies were observed throughout the cortex. Slow fluctuations were relatively larger in regions that accumulated information over longer time periods, suggesting a connection between slow neuronal population dynamics and temporally extended information processing.
INTRODUCTION
The human brain must process information that arrives over a wide range of timescales. In understanding speech, for example, one must not only identify each of the three to six syllables spoken per second (Tauroza and Allison, 1990) but also understand their meaning as a sequence of words. Each word only achieves full meaning in the context of a sentence, and each sentence in the context of a conversation. Thus, the information we gather at each moment is most meaningful in relation to prior events. For the purposes of control, many laboratory experiments reduce stimulus complexity and ignore neural processes that extend beyond individual experimental trials. There is a growing realization, however, of the importance of the neural mechanisms by which information can be accumulated over time (Ben-Yakov et al., 2012; Bernacchia et al., 2011; Brody et al., 2003; Maass et al., 2007; Wang, 2002). Temporally accumulating information is necessary not only for decision-making (de Lange et al., 2010; Donner et al., 2009; Gold and Shadlen, 2007; Sugrue et al., 2004) but also for inferring cause and effect (Fonlupt, 2003), perceiving event boundaries (Zacks et al., 2001), maintaining mnemonic context (Manning et al., 2011), and comprehending the structure of real-life events (Caplan and Dapretto, 2001; Hasson et al., 2008; Mazoyer et al., 1993; Xu et al., 2005).
Using functional magnetic resonance imaging (fMRI) we previously demonstrated that neural circuits differ in the extent to which they accumulate information over time (Hasson et al., 2008; Lerner et al., 2011). In regions nearer to the sensory periphery, cortical activity is reliably modulated by instantaneous physical parameters (e.g., the acoustics of a word), but processing is largely independent of temporal context (e.g., whether that word occurs in a meaningful sentence). These more peripheral regions have been said to have short “temporal receptive windows” (TRWs). Further up the processing hierarchy, more and more of the sensory history is found to affect processing in the present moment. In areas with especially “long TRWs,” such as the temporoparietal junction, the cortical activity at each moment may depend on information that arrived over prior tens of seconds.
In this study, we aimed to map the large-scale topography of TRWs using electrocorticographic (ECoG) recording of the human brain. We further asked whether regions with longer TRWs have distinctive properties in their population dynamics, which may be important for their capacity to accumulate information over long timescales. In particular, we hypothesized that slow components of neuronal dynamics would be more evident in regions with long TRWs, relative to regions with short TRWs.
We tested this hypothesis by performing ECoG recordings from the cerebral cortex of humans watching intact and scrambled audiovisual movie clips (Figure 1A). In quantifying local neuronal dynamics, we measured multiple signal components, but focused on fluctuations of power within the broad high-frequency range of 64–200 Hz. Human and monkey electro-physiology suggest that power fluctuations in the 64–200 Hz band are a distinct phenomenon from the γ oscillations found in visual cortices, and that shifts in this nonrhythmic broadband component index the population spike rate near an electrode (Crone et al., 2011; Manning et al., 2009; Miller, 2010; Nir et al., 2007; Ray and Maunsell, 2011; Whittingstall and Logothetis, 2009). Thus, when we mention fast or slow components of neuronal population dynamics, we are referring to faster and slower fluctuations of broadband high-frequency power, which indexes the population spike rate.
Figure 1. Slow and Fast Responses to Intact and Scrambled Stimuli.
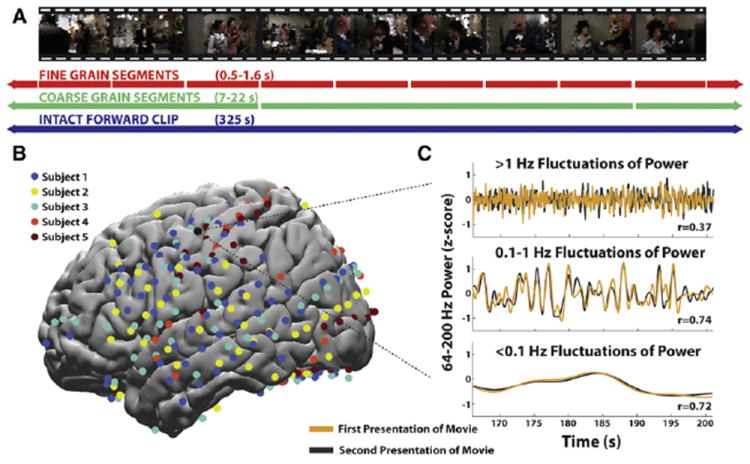
(A) Illustration of the coherent segments used in the intact, coarse-scrambled and fine-scrambled movies. Movie stills are pixelated in this panel for copyright reasons.
(B) Electrode coverage from five subjects, illustrated on an average MNI brain. Electrode colors indicate different subjects.
(C) Example time courses from an early auditory region, illustrating the fast, medium and slow components of the single-trial neural response to a complex audiovisual stimulus. The responses to the first and second presentations are shown in yellow and gray, and Pearson correlation values across presentations are shown for each component.
By measuring the ECoG responses to intact and scrambled movie clips, we confirmed, first, the presence of shorter TRWs in more sensory areas, and longer TRWs in higher order perceptual and cognitive cortices. Second, we observed that regions with long TRWs exhibit relatively more slow (<0.1 Hz) fluctuations of high-frequency power for both intact and scrambled movie clips. Third, we observed that these slow fluctuations of power were modulated with reliable time courses across repeated presentations of the movie. The slow fluctuations were more reliable for the intact than for the scrambled movie, suggesting that they may be connected to the processing of information over long timescales.
RESULTS
We measured neural responses to stimuli with intact information and with scrambled information structure. An intact audiovisual movie clip (330 s of continuous narrative content from Dog Day Afternoon (Lumet, 1975) was scrambled at two timescales (Figure 1A): coarse-scale (reordering of 7–20 s segments) or fine-scale (reordering of 0.5–1.5 s segments).
Electrocorticographic (ECoG) field potentials were recorded from subdural arrays in five patients with intractable epilepsy, each of whom watched the intact, coarse-scrambled and fine-scrambled movie clips twice (see Experimental Procedures). Between 132 and 256 subdural electrodes had been implanted in each patient (interelectrode spacing 10 mm) according to their clinical needs (total of 922 electrodes; Figure 1B; additional information in Table S1 available online). Aggregating data across subjects produced dense coverage of ventral and lateral temporal and occipitotemporal cortex, extensive coverage of somatomotor cortex, and sparse coverage of prefrontal and parietal regions. Voltage signals were amplified and digitally sampled at 30 kHz using a custom-built 256-channel digital acquisition stream and subsequently downsampled to 400 Hz. Power fluctuations over time were calculated for the θ (4–8 Hz), α (8–12 Hz), low β (12–20 Hz), high β (20–28 Hz), and γ (28–56 Hz) bands. In addition, power fluctuations across a range of high-frequency (64–200 Hz) bands were calculated, and normalized signals were averaged to produce an estimate of “broadband” power fluctuations (see Experimental Procedures). Finally, we also calculated band-passed voltage time courses in the ranges 0–4 Hz, 4–8 Hz, and 8–12 Hz up to 196–200 Hz.
We estimated the repeat reliability of the power time courses and the voltage time courses evoked by the intact movie. Repeat reliability was operationalized as the Pearson correlation between the time courses elicited by the first and second presentations of each clip. Higher repeat reliability for a particular movie clip at a particular site indicates that nearby neural circuits exhibited more consistent response time courses that were time locked to that movie. Statistical significance was assessed using a nonparametric permutation procedure and was corrected for multiple comparisons by controlling the false discovery rate (FDR, q < 0.01).
Response Reliability of Different Signal Components
Fluctuations of power were more reliable than fluctuations in raw voltage, and the broadband power fluctuations were the most reliable overall. Significantly reliable responses (q < 0.01, FDR corrected) were observed within auditory, visual, multimodal, and higher order brain regions for the θ power (39 electrodes; Figure 2A), α power (28 electrodes; Figure 2B), low β power (35 electrodes, Figure 2C), and γ power (50 electrodes, 28–56 Hz; Figure 2E). The band with the least reliable and least widespread responses was the high β band (seven electrodes; Figure 2D), while the most reliable and most widespread responses were observed for the broadband power time courses (74 electrodes; Figure 2F). The reliability of the voltage time course was much weaker than the reliability of the power time courses (Figure S1).
Figure 2. Topography of Reliable Movie-Evoked Responses.
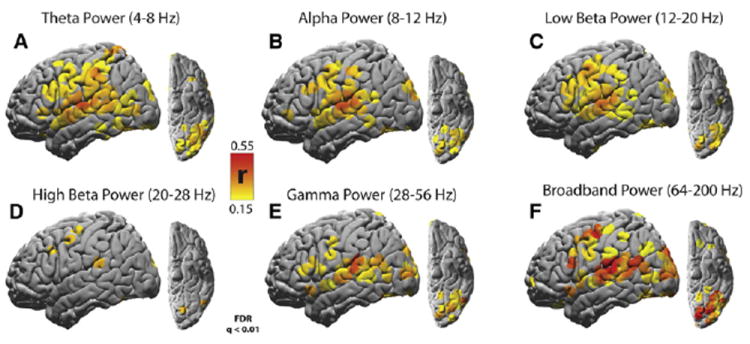
(A) Reliability of 4–8 Hz θ power time courses across two presentations of the intact movie clip.
(B) Reliability of 8–12 Hz α power time courses.
(C) Reliability of 12–20 Hz low β power time courses.
(D) Reliability of 20–28 Hz high β power time courses.
(E) Reliability of 28–56 Hz γ power time courses.
(F) Reliability of 64–200 Hz broadband power time courses. For each signal component, only electrodes reliable at the level q < 0.01 after FDR correction are shown.
See also Figure S1.
Because the broadband power fluctuations provided the most robust signal component and because they index the population firing rate (Manning et al., 2009; Miller, 2010; Nir et al., 2007; Ray and Maunsell, 2011; Whittingstall and Logothetis, 2009), we focused on the broadband component as our measure of neural activity in the main text and figures. The Supplemental Information contains additional analyses of other signal components.
Response Reliability and Coupling to the Stimulus
In early sensory areas the reliability of broadband power was similar for the scrambled and intact movies, while in higher order areas the response reliability was greater for the intact movie. For the intact movie, reliable broadband power fluctuations were observed throughout the lateral cerebral cortex (Figure 3A). The most reliable responses were in early auditory and visual areas, but significant reliability extended to the superior temporal gyrus, ventral occipitotemporal cortex, somatomotor cortex, and posterior and inferior prefrontal cortices. For the scrambled movie, the reliability in early auditory and visual cortices was similar to the intact movie (Figure 3D). However, in a number of higher order areas, such as the posterior medial frontal gyrus (pMFG), the scrambled movie elicited less reliable responses than the intact movie.
Figure 3. Response Reliability and Relation to the Audio.
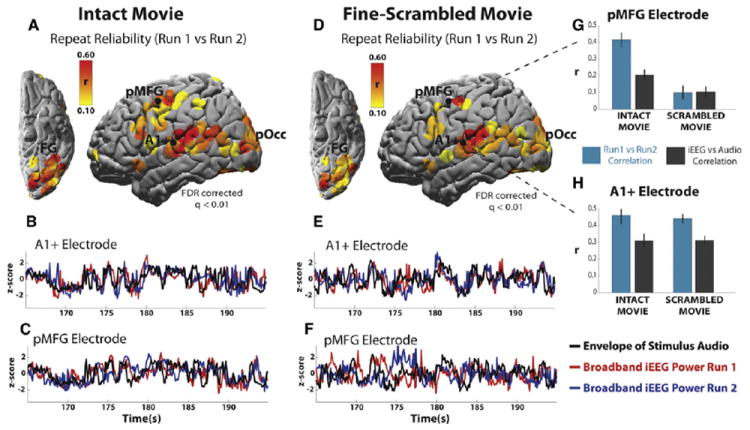
(A) Reliability of responses across two presentations of the intact movie clip. Single-subject, single-electrode data is aggregated across five subjects on an MNI surface.
(B and C) Single-electrode single-trial time courses of broadband power modulation in response to the first presentation (red curve) and second presentation (blue curve) of the stimulus, along with the time course of the audio envelope (black curve).
(D–F) Reliability map and power time courses for the fine-scrambled movie clip, with same format as (A)–(C).
(G and H) Bar plots show the correlation across stimulus repeats (blue bar), as well the correlation between ECoG power and the stimulus audio envelope (gray bar) for example electrodes in pMFG (G) and near primary auditory cortex (A1+, H). Electrodes that did not respond reliably to the intact movie are not shown. Error bars on the inset bar plots are SEM across 20 s sub-blocks. The same auditory electrode provides the example data for (B), (E), and (H); the same frontal electrode provides the example data for (C), (F), and (G).
pMFG, posterior middle frontal gyrus; pOcc, posterior occipital cortex; FG, fusiform gyrus. See also Figure S5.
Single-subject, single-trial power time courses from two electrodes illustrate the general pattern. In an electrode near primary auditory cortex (Electrode A1+; Figures 3B, 3E, and 3H) the response time courses were aligned across stimulus presentations (blue and red traces) for both the intact and scrambled stimuli. By contrast, for an electrode in the pMFG, the responses were 70% less reliable in the scrambled condition than in the intact condition (Electrode pMFG; Figures 3C, 3F, and 3G).
Gradient of Audio Correlations
The responses in early auditory areas tracked the low-level acoustic properties of the movie soundtracks, while in higher order areas the correlation with the stimulus was weak. We correlated the amplitude of the movie soundtracks (“audio envelope,” see Experimental Procedures) with the broadband component of the neural responses. It is clear from the time courses of amplitude modulation (Figures 3B and 3E, dark gray lines) that early auditory areas faithfully tracked the audio amplitude modulations, and with similar fidelity in the intact and scrambled conditions (Figure 3H). By contrast, in higher order areas such as pMFG, the relationship between neural responses and the low-level acoustic properties was weaker, especially when the movie was scrambled (Figures 3C, 3F, and 3G). Significant correlations with the soundtrack envelope were observed primarily along the superior temporal gyrus (STG) and at two pre-central sites. Within the STG, audio correlations were strongest in the vicinity of primary auditory cortex (A1+; Figure 4A; and see Nourski et al. [2009]), and they decreased along ventral, anterior and posterior gradients toward higher order brain regions (Figure 4B, top).
Figure 4. Topography of Stimulus Coupling and Temporal Receptive Windows.
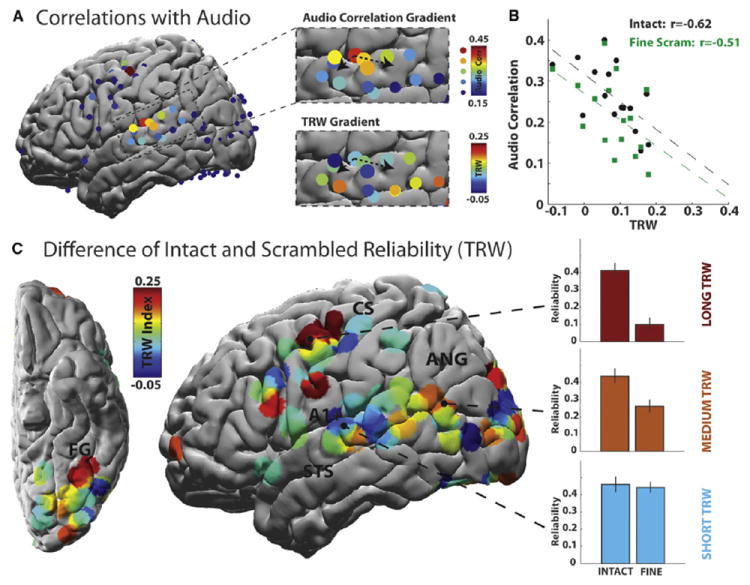
(A) Surface map showing correlation between neural responses and the amplitude of the stimulus audio. Top zoom inset: the audio correlation on the superior temporal gyrus; bottom zoom inset: TRW values on the superior temporal gyrus. The dotted arrows provide a visual reference for the proposed audio and TRW gradients.
(B) TRW values of electrodes on superior temporal gyrus, plotted versus their correlation with stimulus audio in the intact condition (black circles) and fine-scrambled condition (green squares). For both intact and scrambled clips, regions with longer TRW show a weaker coupling to the audio envelope.
(C) TRW topography aggregated across five individual subjects. Shorter TRWs are predominantly found nearer primary sensory areas, while longer TRWs predominate further away from sensory areas. The TRW index is defined as the difference in response reliability between the intact and scrambled stimuli. Error bars on bar plots indicate the SEM across 20 s sub-blocks of the data.
STS, superior temporal sulcus; ANG, angular gyrus; CS, central sulcus. See also Figure S4.
Topography of TRWs
The observation that correlations with the audio envelope decrease from early to higher order auditory processing areas is consistent with hierarchical models of auditory processing in which early auditory areas encode the lower level acoustic properties while higher order areas extract more abstract information (Chevillet et al., 2011; Hickok and Poeppel, 2004; Pallier et al., 2011). Previous work suggests that the capacity to accumulate information over time increases gradually from early sensory areas to higher order perceptual and cognitive areas (Hasson et al., 2008; Lerner et al., 2011). Therefore, the gradient of weakening audio correlations within the STG should correspond to a gradient of lengthening temporal receptive windows (TRWs). To examine this relationship in our data, we defined the “TRW index” of each electrode as the difference of its repeat reliability for the intact and fine-scrambled movie clips. Thus, TRW(i) = rINTACT(i) – rFINE(i) where rINTACT(i) and rFINE(i) are the repeat reliability of the i-th electrode in the intact and fine-scrambled conditions (Figure 4A, bottom inset).
Within the STG, areas with longer TRWs exhibited smaller audio correlations (Figures 4A–4C). A strong and significant anti-correlation was found between the TRW index of each electrode in the STG and the strength of its coupling to the intact movie soundtrack (Figure 4B, black dashed line; r = −0.62, p = 0.010, n = 16) and scrambled movie soundtrack (Figure 4B, green dashed line; r = −0.51, p = 0.04, n = 16). These results support the existence of a hierarchy of progressively longer TRWs within the STG. Areas nearer primary auditory cortex have shorter TRWs and are more sensitive to instantaneous transients of the stimulus, while areas with longer TRWs respond less to instantaneous stimulus transients, and more to the long-range temporal structure that is needed to follow the meaning of the story.
Within the cerebral cortex as a whole, TRW values tended to be smaller in the vicinity of early sensory cortices and larger in higher order brain regions. Thus, by and large, the broadband response reliability in early auditory and visual regions was high at all scrambling levels (Figure 4C, blue). By contrast, in higher order areas nearer the anterior fusiform gyrus, the angular gyrus and frontal cortex (Figure 4C, red), the response reliability to the intact clip was larger than the reliability to the scrambled clips. Three visual electrodes exhibited significantly greater reliability for the scrambled movie than for the intact movie clip, possibly because the discontinuous fine-scrambled condition provided more opportunities to respond to the onset of a preferred stimulus.
We confirmed the presence of a TRW gradient by clustering electrodes into regions of interest (ROIs) based on their anatomical location (Figure 5A). In the auditory pathway, the ROI analysis revealed an increase in average TRW values from early to mid-level areas (t11 = 2.0, p = 0.04) and higher order areas (t10 = 2.6, p = 0.01). Although we lacked coverage of early visual areas in the medial and posterior cortex, we observed a trend from midlevel visual areas in the ventral and dorsal stream toward larger TRWs in higher order visual areas. The TRW values from frontal cortical electrodes were higher than in all other ROIs (Figure 5B).
Figure 5. ROI Analysis of TRW Differences.
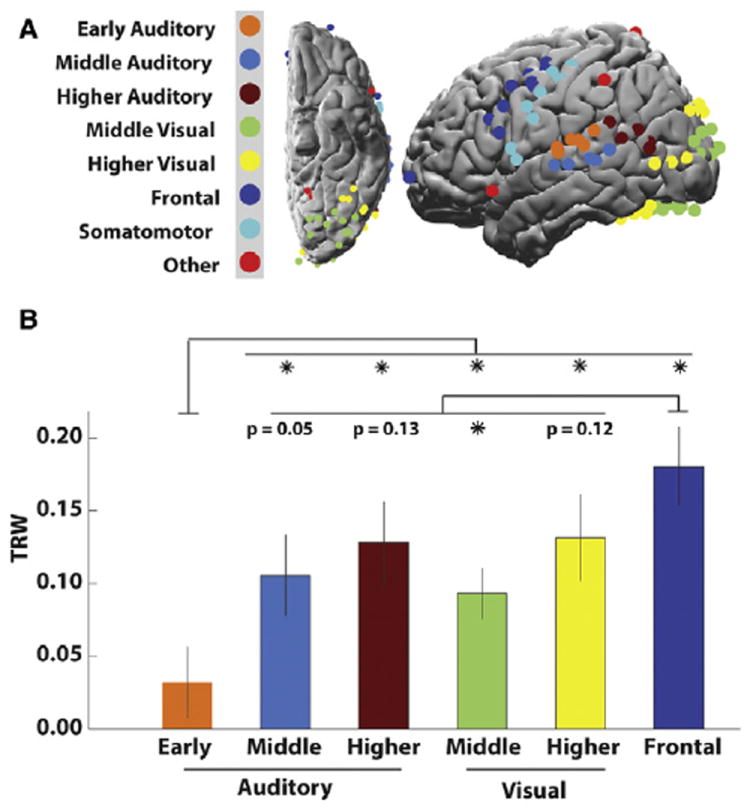
(A) Parcellation of reliable electrodes into ROIs.
(B) Average TRW index within each ROI. We noted a progression of larger TRW indices for higher order cortical areas, with largest TRWs observed in frontal cortex. Error bars indicate SEM across electrodes within ROIs. *p < 0.05.
Slow Fluctuations Are More Pronounced in Areas with Long TRWs
Having found TRW patterns in ECoG that substantially match prior neuroimaging results (Hasson et al., 2008; Lerner et al., 2011), we next tested the hypothesis that regions with longer TRWs should exhibit a shift toward a slower timescale of dynamics. We assessed the timescales of neuronal population dynamics using two metrics: first, a measure of low-frequency variance in the power time courses, and second, a measure of temporal autocorrelation in the power time courses.
To measure the low-frequency variance in the power fluctuations, we first calculated the “modulation spectrum” of each electrode: this is the power spectrum of the 64–200 Hz power fluctuations at each site. After dividing the electrodes via a median split on TRW values (median TRW value = 0.11), we averaged the modulation spectra within the “long TRW” and “short TRW” groups.
The group of long TRW electrodes showed relatively more slow fluctuations than the group of short TRW electrodes (Figure 6A). The increase was most apparent below 0.1 Hz, and was seen in both the intact and fine-scrambled conditions. To quantify the strength of the slow fluctuations, we computed the fraction of the modulation spectrum that was below 0.1 Hz at each site. We refer to this normalized amplitude of slow fluctuations as “LowFq” (see Experimental Procedures; and also Zuo et al. [2010]). LowFq values range from 0 (indicating faster dynamics) to 1 (indicating slower dynamics).
Figure 6. Intrinsic Slow Dynamics and the TRW.
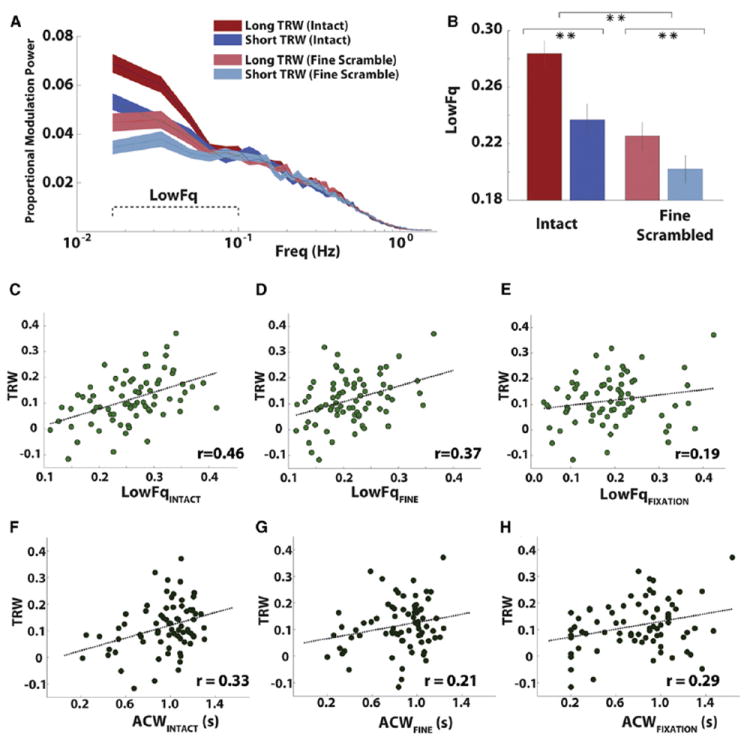
(A) Spectra showing the fraction of variance in the broadband fluctuations at frequencies between 0.01–1 Hz. Lines show the average of the normalized modulation spectra for two groups of electrode (long TRW in red and short TRW in blue) in two conditions (intact clip and fine-scrambled clip). Colored areas indicate SEM across 18 data samples, each 60 s.
(B) The average amplitude of low-frequency fluctuations (LowFq, fraction of variance <0.1 Hz) for short TRW and long TRW electrodes. Error bars are SEM across electrodes. Asterisks indicate the significance of the comparison across electrode groups or conditions; *p < 0.05; **p < 0.01. The asterisk across the two pairs of bars indicates the aggregate difference across the intact and fine-scrambled conditions.
(C–H) TRW of individual electrodes plotted versus their LowFq values in the intact movie (C) fine-scrambled movie (D) and fixation (E) conditions. (F–H) are for (C–E) with TRW plotted against ACW values.
See also Figures S2–S6.
LowFq values were higher in the long TRW group than in the group of short TRW electrodes (Figure 6B). This was evident for both the intact and fine-scrambled movie conditions. These observations were confirmed in a 2-way ANOVA with factors of stimulus (intact/fine-scrambled) and TRW (long/short): both factors significantly modulated LowFq (p < 0.01) but the interaction was not significant (p = 0.24).
The fraction of slow fluctuations in power was also associated with TRWs on an electrode-by-electrode basis. LowFq values measured during the intact movie were robustly correlated across electrodes with TRW values (r = 0.46, p = 3e-5; Figure 6C). The same effect was observed when measuring LowFq in the fine-scrambled movie (r = 0.37, p = 0.001; Figure 6D). Partial correlations between LowFq and TRW values, with repeat reliability (rINTACT or rFINE) included as a covariate, were also highly significant (p < 0.01 all comparisons). This indicates that the relationship between LowFq and TRW was not due to a link between LowFq and electrode responsiveness within a single condition. Electrodes with longer TRWs also exhibited greater temporal autocorrelation in their dynamics. The temporal autocorrelation function indexes the timescale over which prior states of the dynamics predict future states (see Experimental Procedures). We calculated autocorrelation width (ACW) values by measuring the full-width-at-half-maximum of the temporal autocorrelation function of each electrode, and found that electrodes with longer TRWs had greater autocorrelation width, regardless of whether ACW was measured during the intact clip (r = 0.33, p < 0.01; Figure 6F), the coarse-scrambled clip (r = 0.25, p < 0.05), or the fine-scrambled clip (r = 0.21, p = 0.07; Figure 6G). The LowFq and ACW measures are connected via the Wiener-Khinchin theorem, but this relationship is not always simple. In the current data, we found that the ACW and LowFq parameters were robustly positively correlated (Figure S2), and the ACW analysis confirmed the finding that power fluctuations occurred more slowly on average in regions that accumulate information over longer timescales.
Together, the results above identify features of neural dynamics (LowFq and ACW) that are associated on a site-by-site basis with the processing of temporal information in a stimulus (TRW). A similar relationship between dynamic timescale and the TRW index was observed in the power fluctuations of the θ, α, low β, and γ bands, although the smaller number of reliable electrodes in these bands diminished the statistical power (Figure S3). In addition, a comparable relationship between LowFq and the TRW parameter was observed when the TRW index was defined as rCOARSE – rFINE rather than as rINFACT – rFINE (Figure S4).
Dynamic Timescales Measured During Fixation Predict TRWs
To rule out the possibility that the relationship between the timescale of neural dynamics and the TRW index was driven by temporal statistics of the stimulus (which differ across conditions; Figure S5), we measured LowFq and ACW values during 30 s fixation periods that preceded each stimulus (see Experimental Procedures). The fixation-period ACW parameter showed a robust correspondence with the TRW index (r = 0.29, p = 0.01; Figure 6H); this correlation between ACW and TRW values was as strong as those in the movie-stimulated data. Estimates of LowFq parameter during fixation were less precise, because of shorter data windows and fewer overall data points, but we nonetheless observed a weak correlation across electrodes between fixation-period LowFq and the TRW index computed from the movie-viewing data (r = 0.19, p = 0.10; Figure 6E). In addition, both LowFq and ACW values in each electrode were highly correlated between states of fixation and movie viewing (Figure S6).
Both short TRW and long TRW regions exhibited increased values of LowFq for the intact stimulus relative to the fine-scrambled stimulus (Figure 6B), which indicated that the dynamics of the stimulus can alter the timescales of the neural responses. However, the fixation data demonstrated that, while environmental stimuli may induce widespread increases or decreases in the timescales of neural dynamics, the relative ordering of regional timescales was preserved across states of task and fixation. Thus, although stimulus dynamics modulated neural dynamics, they did not drive the relationship between the dynamic timescale and the TRW index.
Increase in Reliability of Slow Power Fluctuations for the Intact Movie
The LowFq and ACW properties of the dynamics during movie viewing reflect a mixture of stimulus-locked and stimulus-independent dynamics at each electrode, and so we next aimed to extract the component of the dynamics that was time-locked to the stimuli. We therefore separately computed the repeat reliability of slow (<0.1 Hz) and fast (>0.1 Hz) dynamics in each condition. The repeat reliability within each electrode in each condition was recomputed after low-pass filtering (slow) or high-pass filtering (fast) the broadband power fluctuations at 0.1 Hz (see Experimental Procedures; Figure 1C shows a slow time course).
Slow fluctuations of power showed larger changes in reliability across conditions than did the faster fluctuations (Figure 7A). In the fine-scrambled movie, the slower and faster dynamics exhibited the same average level of reliability (t73 = 0.94, p = 0.35); however, in the intact movie the slow component of the signal was far more reliable than the fast component (t73 = 12.6, p ≪ 0.01). A reliability advantage was also observed for the slow dynamics over faster dynamics within the coarse-scrambled condition (t73=7.95, p ≪ 0.01), but this advantage was smaller than it was in the intact movie condition (t73 = 3.37, p ≪ 0.01). Together these data suggest that when long timescale information is present in a stimulus, then neural activity is increasingly dominated by slow fluctuations that are specific to the stimulus.
Figure 7. Fast and Slow Components of Response Reliability.
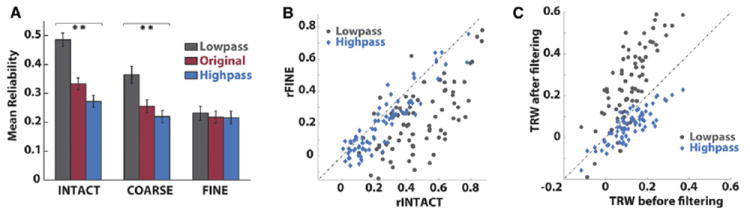
(A) Average reliability across electrodes for all conditions. The reliability of power time courses (red bars) is increased after low-pass filtering at 0.1 Hz (gray bars) and decreased after high-pass filtering (blue bars), and this effect is strongest in the intact movie condition. Error bars indicate the SEM across electrodes. Asterisks indicate the significance of the comparison between low-pass and high-pass; *p < 0.05; **p < 0.01.
(B) Reliability of individual electrodes to the intact stimulus versus their reliability in response to the fine-scrambled stimulus, with reliability computed after low-passing (gray dots) and high-passing (blue dots). The faster component of the power time course shows only a small difference in reliability between intact and scrambled movie, while the slow component shows a large difference.
(C) Comparison of TRW values computed after low-pass and high-pass filtering plotted as a function of the original TRW values. Electrodes with large TRW values exhibited even larger TRW values after low-pass filtering.
See also Figures S5 and S6.
The same enhancement in stimulus-specific slow fluctuations can be seen in individual electrodes. Figure 7B shows the reliability of each electrode in the intact and fine-scrambled movies before and after low-pass and high-pass filtering. After high-passing the broadband fluctuations most of the electrodes have values near the main diagonal of the scatter plot. By contrast, for the slow component of the signals most electrodes are found in the lower quadrant of the scatter plot, indicating greater response reliability for the intact movie clip. Thus, the faster dynamics were elicited with equal reliability by intact and scrambled movie clips, while the slower dynamics were far more reliable for the intact clip. This was confirmed in a 2-way ANOVA on repeat reliability with factors of condition (intact/fine-scrambled) and timescale (faster/slower); the interaction term was highly significant (p < 0.01), confirming that the difference in reliability between the fast and slow components was greater for the intact movie clip.
Regions with the longest TRWs showed the least coupling to low-level stimulus properties (Figure 3B), and yet they showed the largest changes in the reliability of their slow dynamics, as measured by the reliability after low-passing the power fluctuations (Figure 7C, gray dots). This suggests that the changes across conditions in the reliability of slow dynamics (Figures 7A and 7B) are not driven by differences in low-level properties (e.g., the audio envelope; Figure S5) of the stimuli.
DISCUSSION
Slow (<0.1 Hz) fluctuations in population activity are a ubiquitous feature of neural dynamics, but their functional role is uncertain (Bullmore et al., 2001; He, 2011; He et al., 2010; Leopold et al., 2003; Nir et al., 2008; Weisskoff et al., 1993; Zarahn et al., 1997). We mapped the TRWs of human cortical regions using ECoG and tested whether regions with shorter and longer TRWs differ in their slow dynamics. Consistent with fMRI studies (Hasson et al., 2008; Lerner et al., 2011), the electrophysiological measurements revealed that TRWs increased from sensory toward higher order cortices. Notably, regions with longer TRWs exhibited relatively more slow fluctuations and greater temporal autocorrelation, even during resting fixation. Although the slow fluctuations were observed in the absence of any stimulus, they became time-locked to the content of audiovisual movie stimuli. Moreover, the slow timecourses were highly reliable in response to movie clips that contained long-range contextual information structure, but they were significantly less reliable in response movie clips had been scrambled.
The relationship between long TRWs and slow fluctuations of power was observed regardless of whether the slow fluctuations were measured during the intact or scrambled movie clips (Figures 6C, 6D, 6F, and 6G) or during a fixation period (Figures 6E and 6H). In addition, the LowFq and ACW values were highly correlated across states of fixation and movie viewing (Figure S6). These data suggest that the dynamic timescale in each region is determined in part by circuit properties which shape dynamics in a similar way, regardless of the state of external stimulation. This finding is also consistent with the idea that sensory circuits, which tend to have shorter TRWs, are optimized for rapid transient responses to the environmental state, while higher order circuits, which tend to have longer TRWs, more readily maintain and accumulate information over time (Huk and Shadlen, 2005; Ogawa and Komatsu, 2010; Romo et al., 1999; Shadlen and Newsome, 2001; Wang, 2002).
Although the regional ordering of dynamic timescales was well-preserved across states of task and fixation, the dynamic timescales in individual electrodes did change across conditions. Both short TRW and long TRW regions exhibited relatively more slow fluctuations of broadband power during the intact than during the scrambled stimuli (Figures 6A and 6B). Electrodes with short TRWs responded to low-level stimulus properties such as the audio amplitude (Figure 4A), which changes more rapidly in the scrambled condition (Figure S5). Thus, the change in slow fluctuations in short TRW areas may be attributable to changes in low-level stimulus properties. However, a comparable increase in slow fluctuations was observed for areas with long TRWs, despite the fact that these areas showed little coupling to low-level stimulus properties (Figure 4B). Thus, because the boost in slow fluctuations in the intact-movie is widespread, it may reflect a process in which sensory and higher order areas work together to understand a temporally complex real-life stimulus.
What is the origin of the slow fluctuations of power observed in sensory and higher order cortical regions? One mechanism for lengthening time-constants is to introduce recurrent feedback into a neural circuit (Brody et al., 2003; Durstewitz et al., 2000; Shu et al., 2003; Wang, 2002). Differences in the tuning of recurrent activity could account for the differences in the amplitude of slow fluctuations across brain regions. However, we cannot rule out other causes for slow neural change, such as short-term synaptic plasticity (Zucker and Regehr, 2002) or relaxation processes in membrane excitability (Marom, 1998). In addition, slow fluctuations of power are coupled across brain regions even in the absence of stimulation (Leopold and Maier, 2012; Leopold et al., 2003; Nir et al., 2008; Schölvinck et al., 2010), which indicates that the dynamic timescale of each region is influenced by interregional interactions.
Although their mechanistic basis is uncertain, the slow fluctuations of power are reliable across stimulus repetitions (Figure 7A), which immediately suggests that they are not simply noise. In addition, the slow dynamics in response to the intact stimulus were significantly more reliable than those evoked by the scrambled stimulus, which lacks the contextual information structure of a real-life narrative. Finally, the faster fluctuations of broadband power showed a much smaller change in reliability between the intact and scrambled stimuli (Figure 7B). These data suggest a connection between slow fluctuations of neuronal population activity and temporally extended information processing. Similarly, it has been proposed that slow changes in the spatial pattern of high-frequency power reflect a gradually drifting mental context (Manning et al., 2011). If slow fluctuations of power reflect a drifting mental context, this may explain why they are larger and more reliable during the intact movie, whose context shifts gradually as narrative information is accumulated.
We have focused on the slow fluctuations that compose the dominant portion of the variance in neural activity (Figure 6, and see Leopold et al., 2003). Firing rates and high-frequency power are not only modulated on these slow timescales: they also vary with the phase of cortical rhythms on the scale of tens to hundreds of milliseconds (Canolty et al., 2006; He et al., 2010; Miller et al., 2010; Murthy and Fetz, 1992; Osipova et al., 2008; Panzeri et al., 2010). However, these faster rhythmic effects do not dominate the variance of high-frequency power: the peak-to-trough effect of rhythmic modulation is typically <20% of the SD of the power time course (Miller et al., 2010) and phase-amplitude coupling strength is typically <10% of the maximum possible coupling (Voytek et al., 2010). Thus, although the faster rhythmic modulations may be important for regulating neural activity (Canolty and Knight, 2010; Miller et al., 2012; van der Meij et al., 2012) they have little direct effect on the measurements that are our focus here.
Power fluctuations occur on both fast and slow timescales in all regions. Thus, the 0.1 Hz cutoff employed in the LowFq parameter is somewhat arbitrary, and the ACW parameter does not identify a single, dominant timescale for any cortical region. Moreover, timescales of neural dynamics can be affected by stimulus dynamics and by the temporal smoothing used when estimating power time courses. For these reasons, the differences in timescale we report (Figures 6 and 7) do not indicate the absence of fast or slow dynamics in any area, but rather differences in the balance of faster and slower dynamics.
Finally, we note the promising implications of these findings for functional neuroimaging research. During real-life cognition and perception, very slow fluctuations in population activity make up a large fraction of the neural population dynamics (Figure 6A) and real-life cognition reliably modulates these slow dynamics (Figure 7A). Hemodynamic mediation of the BOLD signal reduces the signal-to-noise of more transient (>1 Hz) neural dynamics, but should have a much smaller effect on the slow (<0.1 Hz) dynamics whose reliability we report here. Therefore, given the relationship between ECoG power fluctuations and the BOLD signal (He et al., 2008; Hermes et al., 2012; Logothetis et al., 2001; Mukamel et al., 2005; Niessing et al., 2005) it is likely that a substantial fraction of the dynamics relevant to real-life cognition are not obscured by hemodynamic filtering.
To conclude, the electrophysiological data presented here establish that slow (<0.1 Hz) fluctuations of broadband power are disproportionately expressed in regions with long TRWs, and that these slow fluctuations of population activity are reliably modulated by real-life stimuli that require the accumulation of information over long timescales.
EXPERIMENTAL PROCEDURES
Subjects
Five patients (four female; 20–47 years old) experiencing pharmacologically refractory complex partial seizures were recruited via the Comprehensive Epilepsy Center of the New York University School of Medicine. Their clinical and demographic information is summarized in Table S1. Patients had elected to undergo intracranial monitoring for clinical purposes and provided informed consent both pre- and postelectrode implantation in accordance with National Institutes of Health guidelines administered by the local Institutional Review Board. For each patient, electrode placement was determined by clinicians based on clinical criteria. We focus here on patients with entirely or predominantly left-lateralized coverage, all of whom had left-lateralized language function, excluding data from two patients with right-hemisphere-only coverage.
Stimuli
Audiovisual stimuli were generated from a 325 s clip selected from the 1975 commercial film Dog Day Afternoon (Lumet, 1975). The original intact clip was segmented into 24 coarse units (length 7.1–22.3 s) that were temporally permuted to produce a coarse-scrambled stimulus. The coarse clips were further subdivided to produce a total of 334 fine units (length 0.53–1.62 s) which were permuted to produce a fine-scrambled stimulus. The boundaries between the coarse and fine subsegments were manually selected to coincide with the natural boundaries created by cuts in the movie or by word and sentence onsets and offsets.
Experimental Design
Subjects viewed six movie clips (three clips, two presentations per clip) at bedside on a MacBook laptop located 40–60 cm from their eyes. PsychToolbox Extensions (Kleiner et al., 2007) extensions for MATLAB (MathWorks, Natick, MA) were used to display the movies and trigger their onsets. Clips were presented in a fixed order: Intact, Coarse, Intact, Fine, Coarse, Fine. Presentation of each clip was preceded by a 30 s period in which participants fixated on a central white square (<1° visual angle) on a black background.
ECoG Acquisition
Signals were recorded from 922 electrodes across all five subjects (see Table S1 for subject-level details). Subdural arrays of platinum electrodes embedded in silastic sheeting (8 × 8 square grids, 4 × 8 rectangular grids, or 1 × 8 strips) were placed purely according to clinical criteria. Electrodes had an exposed diameter of 2.3 mm and were spaced 10 mm center-to-center. Depth recordings were not analyzed in the present study. Screws in the skull served as reference and ground. Signals were sampled at 30 kHz using a custom-built digital acquisition system (based on the open-source NSpike framework (L.M. Frank and J. MacArthur, Harvard University Instrument Design Laboratory, Cambridge, MA) that included a 0.6 Hz high-pass filter in hardware. Note that this high-pass filter applies to the raw voltage signal, and does not affect the detection of slow fluctuations in 64–200 Hz power.
Electrode Localization
T1-weighted images were acquired from each subject both before and after the implantation of electrodes. Electrodes were localized on the individual cortical surfaces using a combination of manual identification in the T1images, intraoperative photographs, and a custom MATLAB tool based on the known physical dimensions of the grids and strips (Yang et al., 2012). Subsequently, the individual-subject T1 images were nonlinearly registered to an MNI template using the DARTEL algorithm via SPM (Ashburner, 2007), and the same transformation was applied to map individual electrode coordinates into MNI space.
ROI Assignment
Electrodes were manually assigned to clusters according to their proximity to anatomical landmarks (Figure 5A). Auditory stream electrodes were assigned to Early (n = 7), Middle (n = 6), and Higher (n = 8) clusters. Visual stream electrodes were assigned only to Middle (n = 17) and Higher (n = 14) clusters, as coverage of the medial occipital wall was lacking. Frontal electrodes were defined as those anterior of the posterior bank of the precentral gyrus (n = 12). Five electrodes could not be designated to a sensory pathway and were labeled Other (n = 5).
Preprocessing
Data were analyzed in MATLAB R2010a using custom scripts and the FieldTrip signal processing toolbox (Oostenveld et al., 2011). The raw voltage signals were downsampled to 400 Hz using a set of anti-aliasing finite impulse response filters.
Electrode Exclusion Procedure
Because our measure of repeat reliability is a correlation across only two individual presentations of a stimulus, with no averaging, it was important to exclude electrodes with signal contamination. Electrodes were excluded in the following order: (1) electrodes from the right hemisphere, (2) electrodes exhibiting manifestly artifactual or epileptiform signals, (3) electrodes exhibiting no signal, and (4) electrodes for which conclusive MRI localization was not possible. After these exclusions, 573 of the original 922 electrodes remained.
In an approach similar to global average referencing, the mean voltage time course across all remaining channels within each subject was then projected (via linear regression) from the time course of each individual channel.
Subsequently, power time courses were calculated in each channel (see below). An analysis was performed on each individual channel, to detect spectral bursts, which may indicate epileptiform activity or an intermittent electrode contact. A spectral burst was defined as a power value more than six times the interquartile range away from the median of the power time course in any frequency band. Of the 573 channels entered into spectral analysis, 291 electrodes exhibited at least one spectral burst during the experiment and were excluded.
The remaining 231 electrodes were entered into an analysis of repeat reliability. Of the 231 electrodes entered into the reliability analysis, 74 exhibited significantly (false-discovery rate, q < 0.01) correlated response time courses between the first and second presentations of the intact movie clip in single subjects. These 74 electrodes are used for the analyses presented in Figures 3, 4, 5, 6, and 7.
Calculations of Power Time Courses
Time courses of signal power modulation generally constitute a useful currency for characterizing neural dynamics (Donner and Siegel, 2011). In particular, the broadband power fluctuations observable in the high-frequency 64–200 Hz range provide a spatiotemporally local estimate of variations in population spike rate near each electrode (Manning et al., 2009; Miller, 2010; Nir et al., 2007; Ray and Maunsell, 2011; Whittingstall and Logothetis, 2009).
Using FieldTrip, power spectra were estimated every 100 ms using 3 Slepian tapers in windows with 1 s temporal width and 4 Hz frequency width, with center frequencies of 2, 6, 10, …, 198 Hz. Power modulation in the 56–64, 116–124, and 176–184 Hz bands were excluded from analysis because of their proximity to line noise and its harmonics.
Power estimates are not normally distributed across time samples, and thus we took the logarithm of power estimates in order to normalize their distributions (Miller et al., 2009). Prior to computing logarithms, each time course was divided by its mean value. This effective whitening of the high-frequency spectrum is not essential, but it slightly improved signal-to-noise in the estimate of high-frequency power, because it corrects for the fact that lower frequencies exhibit larger fluctuations than higher frequencies. After whitening, one is combining spectral estimates across equally weighted independent samples of the underlying broadband process. Without whitening, the independent samples of the broadband process are not equally weighted. Broadband power was thus calculated as the average across all normalized time courses with center frequencies in the range 64–200 Hz.
High-Pass, Low-Pass, and Band-Pass Filtering
High-pass, low-pass, and band-pass filtering of power time courses (Figure 7) and voltage time courses (Figure 2) was performed directly in Fourier space, by computing a discrete fast Fourier transform (DFFT), separating the phase and amplitude of each Fourier component, multiplying the set of component amplitudes with the desired spectral profile, and then inverting the DFFT. To attenuate time-domain ripples, a Gaussian taper was applied. For the 0.1 Hz cutoff, this taper produced 75% signal attenuation at 0.11 Hz, and >99% attenuation at 0.13 Hz. Comparable results were obtained using a time-domain Butterworth filter.
Repeat Reliability Analysis
The reliability of the power time courses evoked by each movie clips was then assessed using the Pearson correlation coefficient
where P1(t) and P2(t) are time courses of broadband power modulation evoked by the first and the second presentation of each clip. To avoid onset transients and horizon effects, the first 15 s and last 10 s of power modulation in response to each movie clip were excluded from all analyses. For analyses of the 30 s fixation periods, the first 5 s and last 5 s of each period were excluded.
Correlating ECoG Power and Audio Amplitude
An audio amplitude time course was calculated separately for each sound-track and then compared against the neural response time courses. Audio power modulations were estimated within 25 frequency bands (200 Hz to 5 kHz center frequencies, 200 Hz frequency width, 50 ms time width) using multi-tapers in FieldTrip. The logarithm was taken of the audio power time course in each band, and the “audio envelope” was computed as the mean across the audio power time courses in all bands. The audio envelope was then downsampled to the 10 Hz sampling rate of the neural power time courses. Finally, for each movie clip and each electrode, a Pearson correlation was computed between (1) the time course of the audio envelope, and (2) the average time course of broadband power for the first and second presentations of the clip.
Computing LowFq
LowFq was defined as the fraction of the modulation spectrum of broadband ECoG power time courses below 0.1 Hz. To calculate LowFq, each 64–200 Hz power time courses was decomposed into nine 60 s blocks, with 30 s overlap of consecutive blocks. First, the mean time course value was subtracted from each 60 s block. Second, each block was multiplied by a 60 s Hamming window. Third, a 600-point DFFT was computed for each block. Fourth, to compute the modulation spectrum of each block, we averaged the power spectra across all blocks in the first and second presentations of the movie. Finally, using this averaged modulation spectrum, we computed LowFq as the power in the modulation spectrum below 0.1 Hz divided by the total power in the modulation spectrum. Estimations of LowFq in the fixation data were performed in the same way, but using 20 s data windows with 10 s overlap.
Computing ACW
The ACW was defined as the full-width-at-half-maximum of the temporal autocorrelation function of the power time course. To calculate ACW, each 64–200 Hz power time courses was decomposed into 20 s blocks with 10 s of overlap. We computed the autocorrelation function, Ri(τ), of the power fluctuations of the i-th electrode within each block:
and then averaged the Ri(τ) functions across all blocks obtained from all runs within a condition. Finally, the ACW for the i-th electrode was defined as
where R̄i(τ) is the average of all autocorrelation functions Ri(τ) computed within individual blocks for that electrode. Spectral power was estimated in 1 s windows stepping by 0.1 s, so that τ values increment by 0.1 s and the minimum value of ACW is 0.2 s.
The Wiener-Khinchin theorem connects the autocorrelation function and power spectrum of a time series, and so the LowFq and the ACW parameters are related measures of the dynamical timescale. In the present data the LowFq and ACW parameters are robustly correlated (Figure S2), but we present both measures because they are differently parameterized (LowFq requires a frequency cutoff while the ACW measure requires an autocorrelation cutoff) and they do not always provide the same information.
Statistical Testing of Correlation Values
Because of the autocorrelation in the power modulation time courses, the statistical significance of r-values was assessed using a permutation procedure (Efron and Tibshirani, 1993) that preserved the autocorrelation structure of the original data within the surrogate data. Time courses were subdivided into blocks of 20 s length and the blocks were randomly permuted to produce a surrogate time course. For each empirical time course a set of 2,000 surrogate time courses was generated. For every empirical correlation, 2,000 surrogate correlations were computed using the surrogate time courses. p values were assigned to each r-value by comparing the observed correlation against the distribution of correlations under the null model. Comparable results were obtained when surrogate data were generated by phase-randomization of empirical time courses (Theiler et al., 1992). The Benjamini-Hochberg FDR procedure was applied (qcrit = 0.01) to correct for multiple statistical comparisons (Benjamini and Hochberg, 1995).
To estimate the error of correlation calculations, time courses were partitioned into 20 s blocks, and correlations were computed within each block to produce a sampling distribution of correlations. The SE of the sampling distribution provides the half-width of the error bars in Figures 3G and 3H.
Supplementary Material
Acknowledgments
This work was supported by US National Institutes of Health grants R21-DA024423 (D.J.H.), the R01-MH094480 (U.H., C.J.H.), and Leopoldina National Academy of Science grant BMBF-LPD 9901/8-136 (T.H.D.). We thank Erez Simony, Yuval Nir, and three anonymous reviewers for their insightful comments on the manuscript.
Footnotes
SUPPLEMENTAL INFORMATION
Supplemental Information includes six figures and one table and can be found with this article online at http://dx.doi.org/10.1016/j.neuron.2012.08.011.
References
- Ashburner J. A fast diffeomorphic image registration algorithm. NeuroImage. 2007;38:95–113. doi: 10.1016/j.neuroimage.2007.07.007. [DOI] [PubMed] [Google Scholar]
- Ben-Yakov A, Honey CJ, Lerner Y, Hasson U. Loss of reliable temporal structure in event-related averaging of naturalistic stimuli. Neuroimage. 2012;63:501–506. doi: 10.1016/j.neuroimage.2012.07.008. [DOI] [PMC free article] [PubMed] [Google Scholar]
- Benjamini Y, Hochberg Y. Controlling the false discovery rate—a practical and powerful approach to multiple testing. J R Stat Soc Ser B. 1995;57:289–300. [Google Scholar]
- Bernacchia A, Seo H, Lee D, Wang XJ. A reservoir of time constants for memory traces in cortical neurons. Nat Neurosci. 2011;14:366–372. doi: 10.1038/nn.2752. [DOI] [PMC free article] [PubMed] [Google Scholar]
- Brody CD, Romo R, Kepecs A. Basic mechanisms for graded persistent activity: discrete attractors, continuous attractors, and dynamic representations. Curr Opin Neurobiol. 2003;13:204–211. doi: 10.1016/s0959-4388(03)00050-3. [DOI] [PubMed] [Google Scholar]
- Bullmore E, Long C, Suckling J, Fadili J, Calvert G, Zelaya F, Carpenter TA, Brammer M. Colored noise and computational inference in neurophysiological (fMRI) time series analysis: resampling methods in time and wavelet domains. Hum Brain Mapp. 2001;12:61–78. doi: 10.1002/1097-0193(200102)12:2<61::AID-HBM1004>3.0.CO;2-W. [DOI] [PMC free article] [PubMed] [Google Scholar]
- Canolty RT, Knight RT. The functional role of cross-frequency coupling. Trends Cogn Sci. 2010;14:506–515. doi: 10.1016/j.tics.2010.09.001. [DOI] [PMC free article] [PubMed] [Google Scholar]
- Canolty RT, Edwards E, Dalal SS, Soltani M, Nagarajan SS, Kirsch HE, Berger MS, Barbaro NM, Knight RT. High gamma power is phase-locked to theta oscillations in human neocortex. Science. 2006;313:1626–1628. doi: 10.1126/science.1128115. [DOI] [PMC free article] [PubMed] [Google Scholar]
- Caplan R, Dapretto M. Making sense during conversation: an fMRI study. Neuroreport. 2001;12:3625–3632. doi: 10.1097/00001756-200111160-00050. [DOI] [PubMed] [Google Scholar]
- Chevillet M, Riesenhuber M, Rauschecker JP. Functional correlates of the anterolateral processing hierarchy in human auditory cortex. J Neurosci. 2011;31:9345–9352. doi: 10.1523/JNEUROSCI.1448-11.2011. [DOI] [PMC free article] [PubMed] [Google Scholar]
- Crone NE, Korzeniewska A, Franaszczuk PJ. Cortical gamma responses: searching high and low. International Journal of Psychophysiology. 2011;79:9–15. doi: 10.1016/j.ijpsycho.2010.10.013. [DOI] [PMC free article] [PubMed] [Google Scholar]
- de Lange FP, Jensen O, Dehaene S. Accumulation of evidence during sequential decision making: the importance of top-down factors. J Neurosci. 2010;30:731–738. doi: 10.1523/JNEUROSCI.4080-09.2010. [DOI] [PMC free article] [PubMed] [Google Scholar]
- Lumet S. Dog Day Afternoon. Burbank, CA: Warner Brothers; 1975. [Google Scholar]
- Donner TH, Siegel M. A framework for local cortical oscillation patterns. Trends Cogn Sci. 2011;15:191–199. doi: 10.1016/j.tics.2011.03.007. [DOI] [PubMed] [Google Scholar]
- Donner TH, Siegel M, Fries P, Engel AK. Buildup of choice-predictive activity in human motor cortex during perceptual decision making. Curr Biol. 2009;19:1581–1585. doi: 10.1016/j.cub.2009.07.066. [DOI] [PubMed] [Google Scholar]
- Durstewitz D, Seamans JK, Sejnowski TJ. Neurocomputational models of working memory. Nat Neurosci Suppl. 2000;3:1184–1191. doi: 10.1038/81460. [DOI] [PubMed] [Google Scholar]
- Efron B, Tibshirani R. An Introduction to the Bootstrap. New York: Chapman & Hall; 1993. [Google Scholar]
- Fonlupt P. Perception and judgement of physical causality involve different brain structures. Brain Res Cogn Brain Res. 2003;17:248–254. doi: 10.1016/s0926-6410(03)00112-5. [DOI] [PubMed] [Google Scholar]
- Gold JI, Shadlen MN. The neural basis of decision making. Annu Rev Neurosci. 2007;30:535–574. doi: 10.1146/annurev.neuro.29.051605.113038. [DOI] [PubMed] [Google Scholar]
- Hasson U, Yang E, Vallines I, Heeger DJ, Rubin N. A hierarchy of temporal receptive windows in human cortex. J Neurosci. 2008;28:2539–2550. doi: 10.1523/JNEUROSCI.5487-07.2008. [DOI] [PMC free article] [PubMed] [Google Scholar]
- He BJ. Scale-free properties of the functional magnetic resonance imaging signal during rest and task. J Neurosci. 2011;31:13786–13795. doi: 10.1523/JNEUROSCI.2111-11.2011. [DOI] [PMC free article] [PubMed] [Google Scholar]
- He BJ, Snyder AZ, Zempel JM, Smyth MD, Raichle ME. Electrophysiological correlates of the brain’s intrinsic large-scale functional architecture. Proc Natl Acad Sci USA. 2008;105:16039–16044. doi: 10.1073/pnas.0807010105. [DOI] [PMC free article] [PubMed] [Google Scholar]
- He BJ, Zempel JM, Snyder AZ, Raichle ME. The temporal structures and functional significance of scale-free brain activity. Neuron. 2010;66:353–369. doi: 10.1016/j.neuron.2010.04.020. [DOI] [PMC free article] [PubMed] [Google Scholar]
- Hermes D, Miller KJ, Vansteensel MJ, Aarnoutse EJ, Leijten FS, Ramsey NF. Neurophysiologic correlates of fMRI in human motor cortex. Hum Brain Mapp. 2012;33:1689–1699. doi: 10.1002/hbm.21314. [DOI] [PMC free article] [PubMed] [Google Scholar]
- Hickok G, Poeppel D. Dorsal and ventral streams: a framework for understanding aspects of the functional anatomy of language. Cognition. 2004;92:67–99. doi: 10.1016/j.cognition.2003.10.011. [DOI] [PubMed] [Google Scholar]
- Huk AC, Shadlen MN. Neural activity in macaque parietal cortex reflects temporal integration of visual motion signals during perceptual decision making. J Neurosci. 2005;25:10420–10436. doi: 10.1523/JNEUROSCI.4684-04.2005. [DOI] [PMC free article] [PubMed] [Google Scholar]
- Kleiner M, Brainard D, Pelli D. What’s new in Psychtoolbox-3? Perception. 2007;36 ECVP Abstract Supplement. [Google Scholar]
- Leopold DA, Maier A. Ongoing physiological processes in the cerebral cortex. Neuroimage. 2012;62:2190–2200. doi: 10.1016/j.neuroimage.2011.10.059. [DOI] [PMC free article] [PubMed] [Google Scholar]
- Leopold DA, Murayama Y, Logothetis NK. Very slow activity fluctuations in monkey visual cortex: implications for functional brain imaging. Cereb Cortex. 2003;13:422–433. doi: 10.1093/cercor/13.4.422. [DOI] [PubMed] [Google Scholar]
- Lerner Y, Honey CJ, Silbert LJ, Hasson U. Topographic mapping of a hierarchy of temporal receptive windows using a narrated story. J Neurosci. 2011;31:2906–2915. doi: 10.1523/JNEUROSCI.3684-10.2011. [DOI] [PMC free article] [PubMed] [Google Scholar]
- Logothetis NK, Pauls J, Augath M, Trinath T, Oeltermann A. Neurophysiological investigation of the basis of the fMRI signal. Nature. 2001;412:150–157. doi: 10.1038/35084005. [DOI] [PubMed] [Google Scholar]
- Maass W, Joshi P, Sontag ED. Computational aspects of feedback in neural circuits. PLoS Comput Biol. 2007;3:e165. doi: 10.1371/journal.pcbi.0020165. [DOI] [PMC free article] [PubMed] [Google Scholar]
- Manning JR, Jacobs J, Fried I, Kahana MJ. Broadband shifts in local field potential power spectra are correlated with single-neuron spiking in humans. J Neurosci. 2009;29:13613–13620. doi: 10.1523/JNEUROSCI.2041-09.2009. [DOI] [PMC free article] [PubMed] [Google Scholar]
- Manning JR, Polyn SM, Baltuch GH, Litt B, Kahana MJ. Oscillatory patterns in temporal lobe reveal context reinstatement during memory search. Proc Natl Acad Sci USA. 2011;108:12893–12897. doi: 10.1073/pnas.1015174108. [DOI] [PMC free article] [PubMed] [Google Scholar]
- Marom S. Slow changes in the availability of voltage-gated ion channels: effects on the dynamics of excitable membranes. J Membr Biol. 1998;161:105–113. doi: 10.1007/s002329900318. [DOI] [PubMed] [Google Scholar]
- Mazoyer B, Tzourio N, Frak V, Syrota A, Murayama N, Levrier O, Salamon G, Dehaene S, Cohen L, Mehler J. The cortical representation of speech. J Cogn Neurosci. 1993;5:467–479. doi: 10.1162/jocn.1993.5.4.467. [DOI] [PubMed] [Google Scholar]
- Miller KJ. Broadband spectral change: evidence for a macroscale correlate of population firing rate? J Neurosci. 2010;30:6477–6479. doi: 10.1523/JNEUROSCI.6401-09.2010. [DOI] [PMC free article] [PubMed] [Google Scholar]
- Miller KJ, Zanos S, Fetz EE, den Nijs M, Ojemann JG. Decoupling the cortical power spectrum reveals real-time representation of individual finger movements in humans. J Neurosci. 2009;29:3132–3137. doi: 10.1523/JNEUROSCI.5506-08.2009. [DOI] [PMC free article] [PubMed] [Google Scholar]
- Miller KJ, Hermes D, Honey CJ, Sharma M, Rao RP, den Nijs M, Fetz EE, Sejnowski TJ, Hebb AO, Ojemann JG, et al. Dynamic modulation of local population activity by rhythm phase in human occipital cortex during a visual search task. Front Hum Neurosci. 2010;4:197. doi: 10.3389/fnhum.2010.00197. [DOI] [PMC free article] [PubMed] [Google Scholar]
- Miller KJ, Hermes D, Honey CJ, Hebb AO, Ramsey NF, Knight RT, Ojemann JG, Fetz EE. Human motor cortical activity is selectively phase-entrained on underlying rhythms. PLoS Comput Biol. 2012;8:e1002655. doi: 10.1371/journal.pcbi.1002655. [DOI] [PMC free article] [PubMed] [Google Scholar]
- Mukamel R, Gelbard H, Arieli A, Hasson U, Fried I, Malach R. Coupling between neuronal firing, field potentials, and FMRI in human auditory cortex. Science. 2005;309:951–954. doi: 10.1126/science.1110913. [DOI] [PubMed] [Google Scholar]
- Murthy VN, Fetz EE. Coherent 25- to 35-Hz oscillations in the sensorimotor cortex of awake behaving monkeys. Proc Natl Acad Sci USA. 1992;89:5670–5674. doi: 10.1073/pnas.89.12.5670. [DOI] [PMC free article] [PubMed] [Google Scholar]
- Niessing J, Ebisch B, Schmidt KE, Niessing M, Singer W, Galuske RA. Hemodynamic signals correlate tightly with synchronized gamma oscillations. Science. 2005;309:948–951. doi: 10.1126/science.1110948. [DOI] [PubMed] [Google Scholar]
- Nir Y, Fisch L, Mukamel R, Gelbard-Sagiv H, Arieli A, Fried I, Malach R. Coupling between neuronal firing rate, gamma LFP, and BOLD fMRI is related to interneuronal correlations. Curr Biol. 2007;17:1275–1285. doi: 10.1016/j.cub.2007.06.066. [DOI] [PubMed] [Google Scholar]
- Nir Y, Mukamel R, Dinstein I, Privman E, Harel M, Fisch L, Gelbard-Sagiv H, Kipervasser S, Andelman F, Neufeld MY, et al. Interhemispheric correlations of slow spontaneous neuronal fluctuations revealed in human sensory cortex. Nat Neurosci. 2008;11:1100–1108. doi: 10.1038/nn.2177. [DOI] [PMC free article] [PubMed] [Google Scholar]
- Nourski KV, Reale RA, Oya H, Kawasaki H, Kovach CK, Chen H, Howard MA, 3rd, Brugge JF. Temporal envelope of time-compressed speech represented in the human auditory cortex. J Neurosci. 2009;29:15564–15574. doi: 10.1523/JNEUROSCI.3065-09.2009. [DOI] [PMC free article] [PubMed] [Google Scholar]
- Ogawa T, Komatsu H. Differential temporal storage capacity in the baseline activity of neurons in macaque frontal eye field and area V4. J Neurophysiol. 2010;103:2433–2445. doi: 10.1152/jn.01066.2009. [DOI] [PubMed] [Google Scholar]
- Oostenveld R, Fries P, Maris E, Schoffelen JM. FieldTrip: Open source software for advanced analysis of MEG, EEG, and invasive electrophysiological data. Comput Intell Neurosci. 2011;2011:156869. doi: 10.1155/2011/156869. [DOI] [PMC free article] [PubMed] [Google Scholar]
- Osipova D, Hermes D, Jensen O. Gamma power is phase-locked to posterior alpha activity. PLoS ONE. 2008;3:e3990. doi: 10.1371/journal.pone.0003990. [DOI] [PMC free article] [PubMed] [Google Scholar]
- Pallier C, Devauchelle AD, Dehaene S. Cortical representation of the constituent structure of sentences. Proc Natl Acad Sci USA. 2011;108:2522–2527. doi: 10.1073/pnas.1018711108. [DOI] [PMC free article] [PubMed] [Google Scholar]
- Panzeri S, Brunel N, Logothetis NK, Kayser C. Sensory neural codes using multiplexed temporal scales. Trends Neurosci. 2010;33:111–120. doi: 10.1016/j.tins.2009.12.001. [DOI] [PubMed] [Google Scholar]
- Ray S, Maunsell JH. Different origins of gamma rhythm and high-gamma activity in macaque visual cortex. PLoS Biol. 2011;9:e1000610. doi: 10.1371/journal.pbio.1000610. [DOI] [PMC free article] [PubMed] [Google Scholar]
- Romo R, Brody CD, Hernández A, Lemus L. Neuronal correlates of parametric working memory in the prefrontal cortex. Nature. 1999;399:470–473. doi: 10.1038/20939. [DOI] [PubMed] [Google Scholar]
- Schölvinck ML, Maier A, Ye FQ, Duyn JH, Leopold DA. Neural basis of global resting-state fMRI activity. Proc Natl Acad Sci USA. 2010;107:10238–10243. doi: 10.1073/pnas.0913110107. [DOI] [PMC free article] [PubMed] [Google Scholar]
- Shadlen MN, Newsome WT. Neural basis of a perceptual decision in the parietal cortex (area LIP) of the rhesus monkey. J Neurophysiol. 2001;86:1916–1936. doi: 10.1152/jn.2001.86.4.1916. [DOI] [PubMed] [Google Scholar]
- Shu Y, Hasenstaub A, McCormick DA. Turning on and off recurrent balanced cortical activity. Nature. 2003;423:288–293. doi: 10.1038/nature01616. [DOI] [PubMed] [Google Scholar]
- Sugrue LP, Corrado GS, Newsome WT. Matching behavior and the representation of value in the parietal cortex. Science. 2004;304:1782–1787. doi: 10.1126/science.1094765. [DOI] [PubMed] [Google Scholar]
- Tauroza S, Allison D. Speech rates in British English. Appl Linguist. 1990;11:90–105. [Google Scholar]
- Theiler J, Eubank S, Longtin A, Galdrikian B, Farmer J. Testing for nonlinearity in time-series—the method of surrogate data. PhysD. 1992;58:77–94. [Google Scholar]
- van der Meij R, Kahana M, Maris E. Phase-amplitude coupling in human electrocorticography is spatially distributed and phase diverse. J Neurosci. 2012;32:111–123. doi: 10.1523/JNEUROSCI.4816-11.2012. [DOI] [PMC free article] [PubMed] [Google Scholar]
- Voytek B, Canolty RT, Shestyuk A, Crone NE, Parvizi J, Knight RT. Shifts in gamma phase-amplitude coupling frequency from theta to alpha over posterior cortex during visual tasks. Front Hum Neurosci. 2010;4:191. doi: 10.3389/fnhum.2010.00191. [DOI] [PMC free article] [PubMed] [Google Scholar]
- Wang XJ. Probabilistic decision making by slow reverberation in cortical circuits. Neuron. 2002;36:955–968. doi: 10.1016/s0896-6273(02)01092-9. [DOI] [PubMed] [Google Scholar]
- Weisskoff R, Baker J, Belliveau J, Davis T, Kwong K, Cohen M, Rosen B. Power spectrum analysis of functionally-weighted MR data: what’s in the noise. Proc Int Soc Magn Reson Med. 1993;1:7. [Google Scholar]
- Whittingstall K, Logothetis NK. Frequency-band coupling in surface EEG reflects spiking activity in monkey visual cortex. Neuron. 2009;64:281–289. doi: 10.1016/j.neuron.2009.08.016. [DOI] [PubMed] [Google Scholar]
- Xu J, Kemeny S, Park G, Frattali C, Braun A. Language in context: emergent features of word, sentence, and narrative comprehension. Neuroimage. 2005;25:1002–1015. doi: 10.1016/j.neuroimage.2004.12.013. [DOI] [PubMed] [Google Scholar]
- Yang AI, Wang X, Doyle WK, Halgren E, Carlson C, Belcher TL, Cash SS, Devinsky O, Thesen T. Localization of dense intra-cranial electrode arrays using magnetic resonance imaging. Neuroimage. 2012;63:157–165. doi: 10.1016/j.neuroimage.2012.06.039. [DOI] [PMC free article] [PubMed] [Google Scholar]
- Zacks JM, Braver TS, Sheridan MA, Donaldson DI, Snyder AZ, Ollinger JM, Buckner RL, Raichle ME. Human brain activity time-locked to perceptual event boundaries. Nat Neurosci. 2001;4:651–655. doi: 10.1038/88486. [DOI] [PubMed] [Google Scholar]
- Zarahn E, Aguirre GK, D’Esposito M. Empirical analyses of BOLD fMRI statistics. I. Spatially unsmoothed data collected under null-hypothesis conditions. Neuroimage. 1997;5:179–197. doi: 10.1006/nimg.1997.0263. [DOI] [PubMed] [Google Scholar]
- Zucker RS, Regehr WG. Short-term synaptic plasticity. Annu Rev Physiol. 2002;64:355–405. doi: 10.1146/annurev.physiol.64.092501.114547. [DOI] [PubMed] [Google Scholar]
- Zuo XN, Di Martino A, Kelly C, Shehzad ZE, Gee DG, Klein DF, Castellanos FX, Biswal BB, Milham MP. The oscillating brain: complex and reliable. Neuroimage. 2010;49:1432–1445. doi: 10.1016/j.neuroimage.2009.09.037. [DOI] [PMC free article] [PubMed] [Google Scholar]
Associated Data
This section collects any data citations, data availability statements, or supplementary materials included in this article.