

Abstract
We explored the potential value of amyloid imaging in patients with atypical presentations of dementia. Twenty-eight patients with atypical dementia underwent PET imaging with the amyloid imaging tracer Pittsburgh Compound-B (PiB). Twenty-six had [18F]fluoro-2-deoxy-D-glucose (FDG) PET scans. After extensive clinical evaluation, this group of patients generated considerable diagnostic uncertainty and received working diagnoses that included possible AD (pAD), focal dementias [e.g. posterior cortical atrophy (PCA)], or cases in which no clear diagnostic category could be determined (dementia of uncertain etiology; DUE). Patients were classified as PiB-positive, -negative, or -intermediate based on objective criteria. Anterior-posterior (A-P) and left-right (L-R) indices of PiB and FDG uptake were calculated to examine differences in distribution of amyloid pathology and metabolic changes associated with clinical phenotype. Eleven patients (39%) were PiB-positive, 16 were PiB-negative (57%) and one (4%) was intermediate. By diagnostic category, 3/10 patients (30%) with DUE, 1/5 (20%) with primary progressive aphasia (PPA), 3/5 (60%) with posterior cortical atrophy (PCA), and 4/7 (57%) with pAD were PiB-positive. Brain metabolism of both PiB-positive and -negative patients were generally similar by phenotype, but differed from typical AD. PCA patients also appeared to differ in their relative distribution of PiB compared to typical AD, consistent with their atypical phenotype. AD pathology is frequently present in atypical presentations of dementia and can be identified by amyloid imaging. Clinical phenotype is more related to the pattern of cerebral hypometabolism than the presence/absence of amyloid pathology. These findings have diagnostic, prognostic, and therapeutic implications.
Keywords: Amyloid imaging, PiB, PET, Alzheimer’s Disease, Posterior Cortical Atrophy, dementia, focal dementia
Introduction
An accurate in vivo biomarker of Alzheimer’s disease (AD) is needed in cases of cognitive decline in which the underlying etiology is clinically uncertain. One pathologically heterogeneous population that has received considerable attention in this regard is mild cognitive impairment (MCI).1, 2 Less work has focused on ‘atypical’ presentations of what is subsequently determined to be pathological AD. While patients with the clinical phenotype of less common forms of dementia, such as progressive aphasias and corticobasal degeneration, are often associated with non-AD pathological changes, several recent clinicopathologic series have reported a significant percentage with primarily AD histological features.3–6 For example, in the series by Alladi et al., over 40% of patients with progressive nonfluent aphasia (PNFA) had AD pathology rather than the expected frontotemporal lobar degeneration (FTLD) pathology. In many cases clinical features do not correctly predict the underlying pathology. These findings conform with reports that a sizable minority of patients with AD present with an atypical phenotype in which amnesia is not the sole initial or predominant clinical feature.7, 8
The potential emergence of AD-specific therapeutic interventions underscores the need for early and accurate determination of the underlying pathological features in these cases. The PET tracer N-methyl [11C] 2-(4′-methylaminophenyl)-6-hydroxybenzothiazole, or Pittsburgh Compound-B (PiB), is a thioflavin-T derivative that binds to fibrillar amyloid, allowing for in vivo visualization of amyloid plaques, a hallmark of AD.9 Findings of PiB retention in a pattern consistent with pathologic descriptions of amyloid plaque distribution in AD,9–12 high correlations between autopsy-determined regional concentrations of plaque load and in vivo PiB PET,13, 14 and an increased risk of conversion to AD in MCI patients with increased PiB retention all support the validity of this imaging technique.15–19
Limited findings have been reported on the use of PiB PET in populations with non-AD forms of dementia.20–24 Consistent with the clinicopathologic series noted above, some of these patients have had levels of PiB retention indistinguishable from patients with AD. Only two studies have examined the amyloid distribution of these atypical patients compared to more typical presentations of clinical AD.23, 25 In one report, two PiB-positive patients, one with the clinical phenotype of posterior cortical atrophy (PCA) and the other with primary progressive aphasia (PPA), had distribution of PiB binding similar to patients with probable AD, but with increased occipital and left temporal retention, respectively.25 Alternatively, another group found that the pattern of PiB uptake in PiB-positive PPA patients was indistinguishable from patients with typical AD.23
The goal of the present descriptive study was to characterize PiB PET imaging in a clinically heterogeneous population of patients with dementia in which there was diagnostic uncertainty after a thorough clinical evaluation. Diagnostic ‘uncertainty’ was construed broadly to include patients felt to have atypical presentations of AD, focal degenerative syndromes sometimes associated with AD pathology, or cases upon which no consensus diagnostic category could be agreed. The heterogeneity of the sample was thought to reflect one clinical context in which amyloid imaging might prove very useful. To provide additional characterization of these patients, we also examined patterns of hypometabolism, which could provide further support for the atypical nature of these cases relative to patients with probable AD. Finally, we also explored whether PiB uptake distribution also varied based on clinical phenotype.
Materials and Methods
Participants
Twenty-eight patients with an atypical or focal form of dementia [mean 64.6 ± 10.3 (SD) years; 14 female] were recruited for PiB PET imaging. Data from 39 patients with probable AD [mean 71.3 ± 10.2 (SD) years; 12 female] were used for comparison of PET imaging measures. The majority of atypical dementia patients (n=24) and all those with probable AD were evaluated in the University of Pittsburgh’s Alzheimer’s Disease Research Center (ADRC). Four additional patients were evaluated outside the ADRC by either of two investigators (DAW, STDeK) in their outpatient neurology clinic. All patients who participated in the ADRC underwent an extensive evaluation, including medical and neurological history and examination, a semi-structured psychiatric evaluation, and psychometric testing. Blood and brain imaging studies were performed for each participant. Clinical diagnosis was made by consensus at a conference attended by neurologists, psychiatrists, and neuropsychologists experienced in the diagnosis of dementia (see 7). The evaluation was repeated annually. The patients evaluated in neurology clinic also had an extensive evaluation, but were felt by the clinician not to fall into the diagnostic category of probable AD.
Patients qualified as having an atypical dementia if they fell into any of the following categories: 1. Possible AD (pAD): patients with a diagnosis of possible AD due to an atypical presentation, usually reflecting non-memory cognitive symptoms or behavioral issues more prominent than typical AD; 2. Patients with posterior cortical atrophy (PCA) syndrome; 3. Patients with PPA; 4. Patients in whom no diagnosis could be determined (dementia of uncertain etiology; DUE). Patients with PPA were classified further into categories based on the National Alzheimer’s Coordinating Center’s (NACC) Uniform Data Set (UDS),26 including progressive nonfluent aphasia (PNFA), semantic dementia – anomia plus word comprehension (SD-anomic), semantic dementia – agnostic variant (SD-agnostic), and ‘other.’ Patients with AD were diagnosed based on the National Institute of Neurological and Communicative Disorders and Stroke/Alzheimer’s Disease and Related Disorders Association criteria.27 Non-AD diagnoses were essentially based on commonly-used criteria for each condition.3, 28–30 All procedures involving human subjects were done in accord with the ethical standards of the Institutional Review Board of the University of Pittsburgh and the Helsinki Declaration of 1975.
PET imaging
Details of PiB PET data acquisition have been described previously.31, 32 PET imaging was conducted on a Siemens/CTI ECAT HR+ (3D mode, 15.2 cm field-of-view, 63 planes, reconstructed image resolution ~6 mm). Data were reconstructed using filtered back-projection (Fourier rebinning/2D back projection, 3 mm Hann filter) and corrected for photon attenuation (68Ge/68Ga rods), scatter 33, and radioactive decay. The subject’s head was immobilized to minimize head motion during the scan. PiB was injected intravenously (12–15 mCi, over 20 s, specific activity ~1–2 Ci/μmol), and dynamic PET scanning was performed over a maximum of 90 min (34 time frames). Most patients (26 atypical dementia; 31 AD) also underwent [18F]fluoro-2-deoxy-D-glucose (FDG) PET imaging. The FDG was injected intravenously (6–7.5 mCi) and acquired over 25 min (five 5 min frames) after a 35 min uptake period as the subjects rested quietly with their eyes open in a dimly lit room.
A spoiled gradient recalled (SPGR) MR scan was obtained for each subject for MR-PET image co-registration and anatomical region-of-interest (ROI) definition. Right and left ROIs included: frontal cortex, anterior cingulate cortex, mesial temporal cortex (includes hippocampus and amygdala), precuneus/posterior cingulate cortex, parietal cortex, lateral temporal cortex, occipital cortex, and cerebellum. Partial volume correction was applied to all PET ROIs to reduce dilutional effects of expanded CSF accompanying diseased related atrophy.34
As not all patients tolerated the full 90 minute scan, analysis of PiB-PET data utilized standardized uptake values (SUV) calculated based on the summed regional radioactivity in a late time interval (40–60 minutes). ROIs were referenced to the cerebellum to calculate standardized uptake value ratios (SUVRs). Prior work has demonstrated that SUVRs calculated in this manner produce results similar to analysis with distribution volume ratios (DVRs).31 SUVRs were also calculated for the FDG data by summing over 40 to 60 min post-injection interval and normalizing to the cerebellum.
Data analysis
We used objective criteria to define amyloid-positivity, as previously described.35 This approach involved the iterative removal of outliers among healthy control subjects from seven bilateral ROIs, based on their common association with amyloid deposition in AD. An intermediate range 2.5% above and below the cutoff for each ROI was applied. Any participant who had a PiB SUVR value that exceeded the intermediate range in any of these regions was defined as “PiB-positive” and those who fell under the intermediate range in all seven ROIs were defined as “PiB-negative”.
To grossly examine the distribution of metabolic changes (FDG) and PiB uptake associated with the different atypical presentations described above, we calculated the ratio of activity in several ROIs. The use of ratios rather than absolute values was to account, to some extent, for the fact that there was heterogeneity across the groups in disease severity and duration. To assess the relative degree of anterior versus posterior amyloid burden which may have particular relevance to patients who presented with more behavioral/executive impairment and the posterior cortical atrophy patients, a anterior-posterior (A-P) Index was calculated with the following formula: A-P Index = [(anterior ROI/posterior ROI) − 1] × 100. The anterior ROI was the mean of uptake in frontal and anterior cingulate ROI’s while the posterior ROI reflected lateral parietal, occipital and precuneus regions. To assess for hemispheric asymmetries which may influence language prominent presentations (e.g. PPA), a left-right (L-R) Index was calculated: L-R Index = [(left hemisphere ROI/right hemisphere ROI) − 1] × 100. The hemispheric ROIs were the mean of frontal, temporal, and lateral parietal regions. FDG indices were also calculated for PiB-positive and -negative atypical dementia patients and compared to the probable AD group. Student’s t-test was used to compare means of demographic data across groups. The Mann-Whitney U Test was used for comparison of imaging indices.
Results
Diagnostic and PiB status
A brief clinical summary of all of the cases can be reviewed in Table 1. Ten patients were felt to not fit any clear diagnostic category and were given a DUE designation. Seven patients were categorized as pAD, five as PCA, five as PPA, and one as FTD. Eleven patients were PiB-positive (39%); 16 were PiB-negative (58%); and one (4%) was intermediate. Three patients (30%) with DUE, one (20%) with PPA, and three (60%) with PCA were PiB-positive (see Figure 1). Interestingly, only four out of seven (57%) patients who were felt to have an atypical presentation of AD (pAD) were PiB-positive. If one combines this group with those who had PCA (often felt to be an ‘atypical’ presentation of AD), seven of twelve (58%) were PiB-positive, suggesting that the pathologic specificity of these clinical descriptive labels is limited.
Table 1.
Clinical Description of DUO Cases
| DUO Case | Age | Sex | Hand | MMSE | Dx | Clinical Comment | PiB Scan |
|---|---|---|---|---|---|---|---|
| 1 | 79 | M | R | 2 | ‘Atypical’ AD | Early word-finding difficulty 8 years prior to scan; speech progressively dysfluent, but comprehension intact; possible surface dyslexia; mild executive impairment; verbal memory was poor, but visuospatial memory was intact and family reported no evidence of memory impairment in daily life; SPECT: bilateral temporal lobe and posterior parietal involvement, as well as mild frontal | + |
| 2 | 59 | M | R | 11 | DUE | Progressive memory problems 5 years prior to scan; very slow progression; prior alcohol use; after scan aspiration led to EMG with diagnosis of MND | − |
| 3 | 59 | F | R | 12 | ‘Atypical’ AD | 4 year history of progressive language impairment; testing revealed impaired language and memory, both verbal and visual spatial; mild atrophy on MRI, most pronounced in left temporal lobe | − |
| 4 | 37 | M | L | 24 | DUE | 2 year history of language difficulty; impaired judgment and insight; significant subcortical white matter abnormalities; CSF: borderline low Aβ, normal tau | − |
| 5 | 64 | M | R | 26 | DUE | 3 year history of very slow cognitive decline relatively intact cognitive testing; functional decline; paranoia; mother had AD | − |
| 6 | 60 | F | R | na | PCA | Progressive apraxia, visuospatial dysfunction, and hesitant speech; relative sparing of memory; PET: consistent with AD. | + |
| 7 | 68 | F | R | 26 | ‘Atypical’ AD | Progressive impairment of memory and naming; increased irritability and aggressive behavior; SPECT: decreased flow to frontal lobes and left anterior temporal lobe | + |
| 8 | 80 | M | R | 12 | PPA ‘other’ | 4–5 year history of progressive word-finding difficulty, paraphasias, forgetfulness, and affective symptoms; verbal recall impaired, but recognition normal; visuospatial memory was normal; SPECT: left temporal and frontal involvement; MRI: Left > Right hemisphere atrophy and mild hippocampal atrophy. | + |
| 9 | 70 | F | R | 27 | DUE | 4 year decline associated with dysarthria, paraphasias, apathy; later right neglect; slow gait; SPECT: left temporal, orbitofrontal, and inferior parietal hypoperfusion | − |
| 10 | 62 | F | R | 21 | PPA SD ‘anomic’ | Prominent expressive and receptive language symptoms; SPECT: medial and inferolateral temporal hypoperfusion | − |
| 11 | 46 | F | R | 27 | FTD | Disinhibition; poor attention/executive functioning; myoclonus; SPECT: decreased frontal lobe and striatal perfusion | − |
| 12 | 64 | M | R | 10 | PCA | Initial visuoperceptual and visuospatial impairment, followed by language difficulty; memory involved to less of an extent; SPECT: biparietal and occipital flow abnormalities | + |
| 13 | 62 | M | R | 24 | PPA SD ‘anomic’ | 1–2 years of progressive language symptoms; memory largely intact; left temporal hypoperfusion on SPECT | − |
| 14 | 74 | M | R | 19 | DUE | 4–5 years of memory, language, and executive decline; significant history of alcohol abuse thought contributing | − |
| 15 | 70 | M | R | 28 | DUE | Executive dysfunction with impaired verbal memory encoding, but normal recognition; visuospatial memory normal; odd affect; psychometrics essentially unchanged over 18 month period except mild improvement in verbal memory; psychometrics felt not consistent with AD; SPECT: global decreased flow; CSF: low Aβ, normal tau | + |
| 16 | 74 | F | R | 27 | DUE | 10 year non-progressive dyskinesia; progressive dysexecutive syndrome | int |
| 17 | 63 | M | R | 23 | PCA | Prominent early visuospatial impairment, as well as executive dysfunction; memory less significantly involved; questionable alien limb | − |
| 18 | 58 | F | R | 28 | PPA SD ‘anomic’ | Primary word-finding deficit; subtle impairment of comprehension; PET with decreased left parietal uptake | − |
| 19 | 63 | F | R | 22 | PCA | 1 year of progressive apraxia, visuospatial impairment, astereognosis, and agraphesthesia; SPECT: bilateral posterior tempero-parietal flow deficit | − |
| 20 | 63 | M | R | na | DUE | Initial forgetfulness; developed poor judgment, dysexecutive syndrome, and apathy; SPECT: frontal hypoperfusion; CSF: nl Aβ, but elevated p-tau | − |
| 21 | 86 | F | R | 12 | DUE | Progressive decline in expressive speech/dysfluent; Orobuccal apraxia; comprehension relatively intact, but some degree of aggramatism; poor memory on testing, but not by family report; able to find objects hidden in room; CDR of 1 reflected mild functional decline despite low MMSE; PET: left anterior frontal lobe hypometabolism. | + |
| 22 | 69 | M | R | 27 | ‘Atypical’ AD | Early behavioral features, including impulsivity, disinhibition, and increased libido; followed by forgetfulness and word-finding difficulty; SPECT revealed bilateral parietal hypoperfusion | − |
| 23 | 59 | F | R | 28 | DUE | Cognitive decline with anxiety and depression; delayed verbal recall, naming, and category fluency impaired; SPECT: right greater than left frontal and parietal hypoperfusion; CSF: Aβ and tau normal | − |
| 24 | 57 | M | L | 28 | ‘Atypical’ AD | 10 years of progressive behavioral symptoms including agitation, disinhibition, rude, and grandiose thinking; impairment of memory, attention, language, and executive functioning; SPECT: bilateral posterior temporal and parietal involvement, as well as occipital lobes. | − |
| 25 | 59 | F | R | 21 | PPA SD ‘agnostic’ | Early anomia; overtime developed more significant comprehension difficulty; speech fluent; some decline in judgment; verbal and visuospatial memory impairment | − |
| 26 | 81 | F | R | 28 | ‘Atypical’ AD | Memory and organization c/o’s; testing fluctuated over 5-year period with memory, visuospatial, and executive function impairment; no clear decline despite initial diagnosis of AD; most recent testing in normal range, except Trails B; family has not noted clear decline; continues to manage real estate business. | + |
| 27 | 65 | F | R | 11 | ‘Atypical’ AD | 3 year history of forgetfulness with personality change; excessive silliness, disinhibition, and agitation; global impairment on psychometric testing, except simple attention and visuospatial function. PET: severe frontal and anterior temporal decreased uptake with mild posterior temperoparietal involvement | + |
| 28 | 57 | M | R | 25 | PCA | Early visual complaints and possible right neglect; difficulty with calculations; visual construction impaired out of proportion to other domains, but memory deficits also present. | + |
Key: AD, Alzheimer’s Disease; CBD, Corticobasal Degeneration; FTD, Fronto-temporal Dementia; NOS, not otherwise specified; PCA, Posterior Cortical Atrophy; VaD, Vascular Dementia; SD, Semantic Dementia asymmetry; Int, intermediate; na, not available
Figure 1.

PiB retention in three ROIs measured by standardized uptake value ratio (SUVR) in patients classified as Dementia of Uncertain Etiology (DUE; solid black circles), Primary Progessive Aphasia (PPA; open black squares), Posterior Cortical Atrophy (PCA; solid black diamonds), possible Alzheimer’s Disease (pAD; open black triangles), and typical Alzheimer’s Disease (typical AD; solid blue squares). The red bars represent cutoffs for determining amyloid status in each ROI. ACG: anterior cingulate gyrus; PRC: precuneus; PON: pons
MMSE score and years of education (t’s < 1.0) did not differ between the atypical dementia patients and those with probable AD (see Table 2), but the latter group was older [t(65) = 2.7, p < 0.05]. PiB-positive patients were older than PiB-negative ones [t(25) = 3.5, p < 0.01] and tended to have a lower MMSE [t(23) = 1.8, p = 0.09]. Patients with probable AD were more likely to be carriers of the apolipoprotein E (APOE) ε4 allele than those with atypical dementia (p < 0.05, Fisher’s Exact test, two-tailed). While PiB-positive atypical patients also had a lower ε4 carrier rate than typical probable AD patients (42.9% vs. 71.9%), this difference did not reach statistical significance (p > 0.1, Fisher’s Exact test, two-tailed).
Table 2.
Patient Characteristics
| All Atypical (n=28) | PiB-Positive (n=11) | PiB-Negative (n=16) | Probable AD (n=39) | |
|---|---|---|---|---|
| Age | 64.6 (10.3) * | 71.3 (9.4) # | 59.4 (8.0) * | 71.3 (10.2) |
| Sex (male:female) | 14:14 | 6:5 | 8:8 | 27:12 |
| Education (years) | 14.3 (3.0) | 13.6 (2.1) | 15.1 (3.0) | 15.0 (3.5) |
| MMSE | 20.9 (7.3) | 17.6 (8.9) | 22.7 (5.5) | 20.7 (3.8) |
| APOE ε4 Carriers (%) | 40.0% | 42.9% | 33.3% | 71.9% |
Note that 7 patients with AD and 8 patients with atypical presentations did not have APOE genotyping. MMSE was not available for two atypical patients.
: p < 0.05 in comparison with probable AD;
p < 0.05 in comparison with PiB Negative patients. Standard deviations presented in parentheses.
FDG and PiB PET Distribution
The calculated FDG and PiB PET indices based on diagnostic category and amyloid status are presented in Table 3. The most salient differences between this cohort and the probable AD patients were in those with PCA and PPA. As would be expected based on their clinical phenotype, PCA patients demonstrated lower posterior metabolism (higher FDGA-P index) than those with probable AD, but this difference did not reach significance. This difference was of even greater magnitude when limited to the PiB-positive PCA patients. With regards to amyloid burden, the PiB-positive PCA patients also displayed relatively greater posterior amyloid deposition (lower PiBA-P index) than those with probable AD (p < 0.05; see Figure 2, Case #29).
Table 3.
FDG PET and PiB Distribution
| FDG | PiB | |||
|---|---|---|---|---|
| Index | A-P (%) | L-R (%) | A-P (%) | L-R (%) |
| Probable AD (n=39) | −0.2 (8.0) | 1.1 (9.0) | 18.5 (10.1) | −0.9 (6.1) |
| All pAD (n=7) | −2.7 (−12.3 – 17.9) | −4.5 (−25.4 – 7.3) | ||
| PiB− pAD (n=3) | −8.1 (−12.3 – 5.7) | −9.5 # (−25.4 – −0.3) | ||
| PiB+ pAD (n=4) | 2.7 (−8.5 – 17.9) | 0.4 (−4.0 – 7.3) | 14.2 (−1.2 – 27.7) | −2.3 (−13.7 – 5.4) |
| All DUE (n=10) | −5.8 (−28.5 – 5.4) | −1.4 (−14.0 – 14.3) | ||
| PiB− DUE (n=7) | −6.6 (−28.5 – 5.4) | −3.2 (−14.0 – 14.3) | ||
| PiB+ DUE (n=3) | −4.4 (−5.0 – −3.7) | 1.2 (−0.1 – 2.6) | 23.4 (12.3 – 36.7) | 5.1 (0.5 – 10.3) |
| All PCA (n=5) | 7.6 (−2.2 – 38.7) | −5.4 (−17.1 – 3.7) | ||
| PiB− PCA (n=2) | 1.4 (1.0 – 1.8) | −1.2 (−6.1 – 3.7) | ||
| PIB+ PCA (n=3) | 11.7 (−2.2 – 38.7) | −8.2 (−17.1 – 3.3) | 2.1* (−7.5 – 10.1) | 2.7 (−2.8 – 6.5) |
| All PPA (n=5) | −4.0 (−9.3 – 3.3) | −7.3 # (−19.1 – 6.6) | ||
| PiB− PPA (n=4) | −5.8 (−9.3 – −0.4) | −4.4 (−15.6 – 6.63) | ||
| PiB+ PPA (n=1) | 3.3 | −19.1 | 43.3 | −4.3 |
Note that 1 aAD (PiB+ patient), 1 DUE (PiB+ patient), and 8 probable AD patients did not have an FDG PET scan;
: p < 0.05,
p < 0.1 vs. probable AD.
Standard deviation and range presented in parentheses for the probable AD and other diagnostic categories, respectively.
Figure 2.
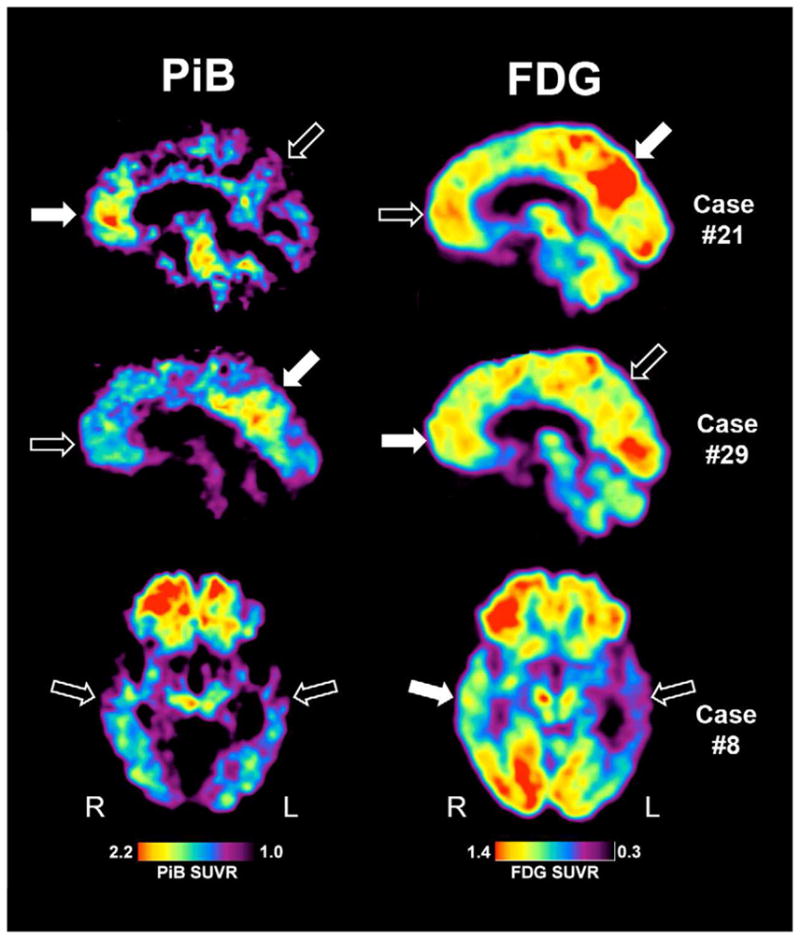
PiB (left) and FDG (right) images for three exemplar cases. Case #21 was classified as DUE, Case #29 was classified as PCA, and Case #8 was classified as PPA. Solid arrows represent areas of relatively high PiB or FDG uptake while open areas represent relatively lower areas. Images are quantified by standardized uptake volume ratio (SUVR) with the respective displayed color scales.
Cerebral metabolism was also lower in the left temporal cortex (more negative FDGL-R index) in the 5 PPA patients relative to those with probable AD, which reached marginal significance (p < 0.1) and is consistent with the language impairment of this group. Interestingly, despite the fact that the single PiB positive PPA patient displayed the most left temporal metabolic asymmetry (most negative FDGL-R index) of the entire group (see Table 2), this patient did not have evidence of greater left temporal amyloid burden on the PiB scan. Indeed, the PiB L-R Index was negative (−4.3%) suggesting somewhat more prominent right hemisphere amyloid burden (see Figure 2, Case #8). Interestingly, this patient also displayed relatively greater frontal involvement as well.
There were less clear trends in metabolism distribution in the patients with pAD and DUE, likely reflecting their heterogeneous nature. It is worth noting that the pAD patients displayed evidence of somewhat more relative left hypometabolism than the probable AD cases perhaps reflecting the relatively frequent prominent language symptoms in these patients contributing to the atypical presentation, but appeared largely driven by the PiB negative patients (see Table 2). The DUE patients exhibited some evidence for greater relative frontal hypometabolism (more negative FDGFr-P index) compared to the probable AD group, which may reflect the fact that many of these patients had significant executive/behavioral symptoms. Note that at least one of these cases also had a more focal pattern of frontal PiB uptake (see Figure 2, Case #21). However, none of the group differences for either FDG or PiB PET reached statistical significance in these groups (pAD and DUE).
Discussion
One of the goals of this work was to assess the potential clinical utility of PiB PET imaging in difficult-to-diagnose dementia patients. Given the frequency with which less common focal presentations of dementia (e.g. PPA, PCA, FTD) are associated primarily with AD pathology, we focused on this population. 3–5, 36–38 The uncertainty in these cases refers to the underlying pathology rather than the clinical syndrome, which may be quite clear. Given the development of disease-specific therapeutic approaches, determination of pathologic etiology will become increasingly important. While some progress has been made in predicting the pathological basis of these focal dementias based on clinical or radiologic features, there remains much overlap and such categorizations are often probabilistic at best.36, 39 Thus, more specific markers of pathology clearly need to be incorporated into the diagnostic process. While CSF biomarkers (e.g. Aβ and tau) offer one promising approach,40–42 amyloid imaging represents another potential pathology-specific tool that, not only provides information on the presence or absence of amyloid deposition, but also provides information on the relative regional distribution of plaque burden.
In this heterogeneous sample, 16 (58%) of these patients fell into the conservatively defined PiB-negative range, suggesting that it is unlikely that these patients have the Aβ pathology of AD as the cause of their dementia. In contrast, those who were PiB-positive (39%), including patients phenotypically described as pAD, PCA, PPA, and DUE, likely have underlying AD pathology. That only 57% of patients felt to have an atypical form of AD (pAD) were PiB-positive underscores the pathologic uncertainty of this group and the potential utility of amyloid imaging techniques.
It is likely that other clinicians may have provided alternative diagnostic labels for the patients of this cohort. Indeed, many of them elicited disagreement even amongst a clinical staff who have worked together for many years in the University of Pittsburgh ADRC and have developed a similar diagnostic approach. Further, the nosology of these diagnostic constructs remain in flux (e.g. PPA) and the psychometric testing in the present work was perhaps limited in assessment of finer-grained cognitive profiles. Nonetheless, our group has extensive clinical experience, and any potential diagnostic variability across specialty dementia clinics for these cases would likely reflect their atypical nature. This study was not designed to look for other clinical or imaging characteristics (FDG PET or MRI) that would assist in prediction of the underlying pathology; however, as noted above, prior work has suggested that these phenotypic features have limited capacity to enable such prediction. For example, in the current work it is notable that the most specific phenotypic groups, PCA and PPA, FDG PET patterns were similar regardless of PiB status, suggesting that metabolism reflects the clinical status better than the underlying pathology, as well as perhaps further validating the phenotypic classification applied. However, it is possible that a more global evaluation of these scans could have assisted in further sorting these groups; assessment of the relative value of these different imaging modalities in accurate prediction of pathology is an important area for future work. It is also worth noting that some diagnostic categories were more likely to be associated with elevated PiB retention than others (e.g. pAD and PCA vs PPA or DUE), which has also be observed in the autopsy literature.
Another goal of this work was to describe the distribution of PiB retention in these atypical cases relative to a ‘normal’ AD phenotype. PiB PET offers a unique in vivo opportunity to relate one aspect of AD pathology to clinical symptoms. While autopsy studies have provided some insight in this regard, they are limited by the timing of clinical evaluation relative to death and the fact that most patients are at advanced stage of disease. Nonetheless, the current results appear to conform with the pathological literature despite the limited sample size of the individual groups. Perhaps most convincingly, patients with prominent visuo-spatial/perceptual symptoms (i.e. PCA), displayed greater relative PiB uptake in posterior relative to more anterior brain regions. While autopsy data has revealed a significantly greater burden of AD neurofibrillary tangle pathology in primary visual areas of such patients, data on the presence of increased amyloid plaque burden has been inconsistent.38, 43 The present in vivo result appears to support the notion that this condition may be associated with greater fibrillar amyloid deposition in more posterior regions and is consistent with at least two other case reports of PCA patient demonstrating increased occipital PiB uptake relative to typical AD.25, 44
Interestingly, the one PiB-positive patient classified as PPA (Figure 3, Case #8) had markedly greater left than right temporal hypometabolism, but did not display a left hemispheric predominance of PiB uptake. Strikingly, autopsy data also has not consistently revealed alterations in the distribution of AD pathology in such patients.5, 45, 46 For example, Mesulam and colleagues reported on 11 cases of PPA with primarily AD pathology at autopsy. None of the patients had evidence of a qualitative asymmetry in amyloid plaque burden in the neocortex, including superior temporal gyrus. While a few patients displayed a mild increase in left relative to right NFT burden, many did not. Such a finding is particularly curious given the significant left hemisphere atrophy in most of these patients.47 Our PiB-positive PPA patients is also consistent with a recent report of PiB and FDG PET imaging in a larger cohort of PPA patients, six of whom were PiB-positive. As found here, these patients displayed a symmetric pattern of PiB uptake despite asymmetry in phenotype and FDG metabolism.23 The lack of strong clinicopathological correlation in these cases has led some to speculate that an alternative, currently unrecognized, process may drive language impairment in these patients.5, 6 Finally, it is worth noting that the present case was classified as ‘PPA – other’ based on NACC UDS definition, and did not clearly fit into the Logopenic variant of PPA that has been recently associated with a relatively high incidence of underlying AD pathology. 5, 23, 48 Given the limited number of PPA patients in the current report, conclusions about the relative likelihood of AD pathology based on subtype cannot be made.
The current study is largely descriptive and has a number of limitations. First, the groups involved are heterogeneous with regard to clinical presentation, disease severity, and disease duration. This heterogeneity is present not only across groups, but within the diagnostic categories, most notably the DUE group. Further, as noted above, our classifications may differ from other groups limiting the generalizability of the current findings. Nonetheless, this work supports the more general notion that many of these less straightforward cases may harbor AD pathology, which is difficult to determine on a purely clinical basis even in an experienced center like our own. The rigorous and lengthy evaluations that we perform are likely impractical in non-research clinical settings and further accentuates the need for pathology-specific biomarkers in such difficult cases. Differences in disease severity and duration, as well as the small sample size for the individual subtypes, also limited a more careful exploration of specific neuropsychological measures and PET findings. Additionally, differences in degree of cognitive impairment obfuscates absolute comparisons of regional amyloid burden or hypometabolism, which prompted the employment of relative measures (i.e. the ROI ratios). Finally, it is important to emphasize that PiB PET only provides information about amyloid pathology, and, thus, cannot replace the ‘gold standard’ pathological assessment, which would also allow for determination of NFT and other neurodegenerative pathologic species. Further, such evidence of amyloidosis can be seen in non-AD conditions, such as dementia with lewy bodies and cerebral amyloid angiopathy.14, 49 While histological confirmation is ultimately needed in these cases and the possibility remains that some have more than one pathology, we feel that the present findings are consistent with autopsy data in similar populations. For example, most cases of patients with PPA who display AD histological changes at autopsy do not have concomitant FTD pathology.3, 5, 6
In conclusion, the current work revealed that a significant proportion of difficult to diagnose or atypical cases of dementia are associated with high levels of PiB uptake and presumably AD pathology. As suggested by these patients and the emerging literature on atypical dementia presentations, clinical and standard imaging data do not clearly adjudicate between potential underlying pathologies. Thus, amyloid imaging techniques may be particularly useful for diagnostic purposes, as well as to contribute to our understanding of relationships between Aβ pathology and clinical presentation. With the hoped-for development of disease-specific therapies for AD and other dementias, the positive (and early) identification of diverse specific pathologies in AD and other neurodegenerative disease will assume even greater significance.
Acknowledgments
Supported by the National Institutes of Health: P50 AG005133, P01 AG025204, K23 AG028018 and the PA Department of Health: SAP 4100027294. The funders played no role in the design and conduct of the study; collection, management, analysis, and interpretation of the data; and preparation, review, or approval of the manuscript.
Dr. Wolk has received consulting fees from GE Healthcare. GE Healthcare holds a license agreement with the University of Pittsburgh based on the technology (PiB PET) described in this article. Drs. Klunk and Mathis are coinventors of PiB and, as such, have a financial interest in this license agreement. GE Healthcare provided no grant support for this project and had no role in its preparation.
Footnotes
Publisher's Disclaimer: This is a PDF file of an unedited manuscript that has been accepted for publication. As a service to our customers we are providing this early version of the manuscript. The manuscript will undergo copyediting, typesetting, and review of the resulting proof before it is published in its final citable form. Please note that during the production process errors may be discovered which could affect the content, and all legal disclaimers that apply to the journal pertain.
References
- 1.Winblad B, Palmer K, Kivipelto M, et al. Mild cognitive impairment--beyond controversies, towards a consensus: report of the International Working Group on Mild Cognitive Impairment. J Intern Med. 2004;256:240–6. doi: 10.1111/j.1365-2796.2004.01380.x. [DOI] [PubMed] [Google Scholar]
- 2.Petersen RC. Mild cognitive impairment as a diagnostic entity. Journal of Internal Medicine. 2004;256:183–94. doi: 10.1111/j.1365-2796.2004.01388.x. [DOI] [PubMed] [Google Scholar]
- 3.Alladi S, Xuereb J, Bak T, et al. Focal cortical presentations of Alzheimer’s disease. Brain. 2007;130:2636–45. doi: 10.1093/brain/awm213. [DOI] [PubMed] [Google Scholar]
- 4.Forman MS, Farmer J, Johnson JK, et al. Frontotemporal dementia: clinicopathological correlations. Ann Neurol. 2006;59:952–62. doi: 10.1002/ana.20873. [DOI] [PMC free article] [PubMed] [Google Scholar]
- 5.Mesulam M, Wicklund A, Johnson N, et al. Alzheimer and frontotemporal pathology in subsets of primary progressive aphasia. Ann Neurol. 2008;63:709–19. doi: 10.1002/ana.21388. [DOI] [PMC free article] [PubMed] [Google Scholar]
- 6.Munoz DG, Woulfe J, Kertesz A. Argyrophilic thorny astrocyte clusters in association with Alzheimer’s disease pathology in possible primary progressive aphasia. Acta Neuropathol. 2007;114:347–57. doi: 10.1007/s00401-007-0266-x. [DOI] [PubMed] [Google Scholar]
- 7.Lopez OL, Becker JT, Klunk W, et al. Research evaluation and diagnosis of probable Alzheimer’s disease over the last two decades: I. Neurology. 2000;55:1854–62. doi: 10.1212/wnl.55.12.1854. [DOI] [PubMed] [Google Scholar]
- 8.Cummings JL. Cognitive and behavioral heterogeneity in Alzheimer’s disease: seeking the neurobiological basis. Neurobiol Aging. 2000;21:845–61. doi: 10.1016/s0197-4580(00)00183-4. [DOI] [PubMed] [Google Scholar]
- 9.Klunk WE, Engler H, Nordberg A, et al. Imaging brain amyloid in Alzheimer’s disease with Pittsburgh Compound-B. Ann Neurol. 2004;55:306–19. doi: 10.1002/ana.20009. [DOI] [PubMed] [Google Scholar]
- 10.Braak H, Braak E. Neuropathological staging of Alzheimer-related changes. Acta Neuropathologica. 1991;82:239–59. doi: 10.1007/BF00308809. [DOI] [PubMed] [Google Scholar]
- 11.Thal DR, Rub U, Orantes M, Braak H. Phases of A beta-deposition in the human brain and its relevance for the development of AD. Neurology. 2002;58:1791–800. doi: 10.1212/wnl.58.12.1791. [DOI] [PubMed] [Google Scholar]
- 12.Engler H, Forsberg A, Almkvist O, et al. Two-year follow-up of amyloid deposition in patients with Alzheimer’s disease. Brain. 2006;129:2856–66. doi: 10.1093/brain/awl178. [DOI] [PubMed] [Google Scholar]
- 13.Ikonomovic MD, Klunk WE, Abrahamson EE, et al. Post-mortem correlates of in vivo PiB-PET amyloid imaging in a typical case of Alzheimer’s disease. Brain. 2008;131:1630–45. doi: 10.1093/brain/awn016. [DOI] [PMC free article] [PubMed] [Google Scholar]
- 14.Bacskai BJ, Frosch MP, Freeman SH, et al. Molecular imaging with Pittsburgh Compound B confirmed at autopsy: a case report. Arch Neurol. 2007;64:431–4. doi: 10.1001/archneur.64.3.431. [DOI] [PubMed] [Google Scholar]
- 15.Forsberg A, Engler H, Almkvist O, et al. PET imaging of amyloid deposition in patients with mild cognitive impairment. Neurobiol Aging. 2008;29:1456–65. doi: 10.1016/j.neurobiolaging.2007.03.029. [DOI] [PubMed] [Google Scholar]
- 16.Wolk DA, Price JC, Saxton JA, et al. Amyloid imaging in mild cognitive impairment subtypes. Ann Neurol. 2009;65:557–68. doi: 10.1002/ana.21598. [DOI] [PMC free article] [PubMed] [Google Scholar]
- 17.Okello A, Koivunen J, Edison P, et al. Conversion of amyloid positive and negative MCI to AD over 3 years: an 11C-PIB PET study. Neurology. 2009;73:754–60. doi: 10.1212/WNL.0b013e3181b23564. [DOI] [PMC free article] [PubMed] [Google Scholar]
- 18.Jagust WJ, Bandy D, Chen K, et al. The Alzheimer’s Disease Neuroimaging Initiative positron emission tomography core. Alzheimers Dement. 6:221–9. doi: 10.1016/j.jalz.2010.03.003. [DOI] [PMC free article] [PubMed] [Google Scholar]
- 19.Koivunen J, Pirttila T, Kemppainen N, et al. PET amyloid ligand [11C]PIB uptake and cerebrospinal fluid beta-amyloid in mild cognitive impairment. Dement Geriatr Cogn Disord. 2008;26:378–83. doi: 10.1159/000163927. [DOI] [PubMed] [Google Scholar]
- 20.Ng SY, Villemagne VL, Masters CL, Rowe CC. Evaluating atypical dementia syndromes using positron emission tomography with carbon 11 labeled Pittsburgh Compound B. Arch Neurol. 2007;64:1140–4. doi: 10.1001/archneur.64.8.1140. [DOI] [PubMed] [Google Scholar]
- 21.Engler H, Santillo AF, Wang SX, et al. In vivo amyloid imaging with PET in frontotemporal dementia. Eur J Nucl Med Mol Imaging. 2008;35:100–6. doi: 10.1007/s00259-007-0523-1. [DOI] [PubMed] [Google Scholar]
- 22.Rabinovici GD, Furst AJ, O’Neil JP, et al. 11C-PIB PET imaging in Alzheimer disease and frontotemporal lobar degeneration. Neurology. 2007;68:1205–12. doi: 10.1212/01.wnl.0000259035.98480.ed. [DOI] [PubMed] [Google Scholar]
- 23.Rabinovici GD, Jagust WJ, Furst AJ, et al. Abeta amyloid and glucose metabolism in three variants of primary progressive aphasia. Ann Neurol. 2008;64:388–401. doi: 10.1002/ana.21451. [DOI] [PMC free article] [PubMed] [Google Scholar]
- 24.Rowe CC, Ng S, Ackermann U, et al. Imaging beta-amyloid burden in aging and dementia. Neurology. 2007;68:1718–25. doi: 10.1212/01.wnl.0000261919.22630.ea. [DOI] [PubMed] [Google Scholar]
- 25.Ng S, Villemagne VL, Berlangieri S, et al. Visual assessment versus quantitative assessment of 11C-PIB PET and 18F-FDG PET for detection of Alzheimer’s disease. J Nucl Med. 2007;48:547–52. doi: 10.2967/jnumed.106.037762. [DOI] [PubMed] [Google Scholar]
- 26.Morris JC, Weintraub S, Chui HC, et al. The Uniform Data Set (UDS): clinical and cognitive variables and descriptive data from Alzheimer Disease Centers. Alzheimer Dis Assoc Disord. 2006;20:210–6. doi: 10.1097/01.wad.0000213865.09806.92. [DOI] [PubMed] [Google Scholar]
- 27.McKhann G, Drachman D, Folstein M, Katzman R, Price D. Clinical diagnosis of Alzheimer’s disease: report of the NINCDS-ADRDA Work Group under the auspices of Department of Health and Human Services Task Force on Alzheimer’s Disease. Neurology. 1984;34:285–97. doi: 10.1212/wnl.34.7.939. [DOI] [PubMed] [Google Scholar]
- 28.Mesulam MM, Grossman M, Hillis A, Kertesz A, Weintraub S. The core and halo of primary progressive aphasia and semantic dementia. Ann Neurol. 2003;54 (Suppl 5):S11–4. doi: 10.1002/ana.10569. [DOI] [PubMed] [Google Scholar]
- 29.McMonagle P, Deering F, Berliner Y, Kertesz A. The cognitive profile of posterior cortical atrophy. Neurology. 2006;66:331–8. doi: 10.1212/01.wnl.0000196477.78548.db. [DOI] [PubMed] [Google Scholar]
- 30.Neary D, Snowden JS, Gustafson L, et al. Frontotemporal lobar degeneration: a consensus on clinical diagnostic criteria. Neurology. 1998;51:1546–54. doi: 10.1212/wnl.51.6.1546. [DOI] [PubMed] [Google Scholar]
- 31.Lopresti BJ, Klunk WE, Mathis CA, et al. Simplified quantification of Pittsburgh Compound B amyloid imaging PET studies: a comparative analysis. J Nucl Med. 2005;46:1959–72. [PubMed] [Google Scholar]
- 32.Price JC, Klunk WE, Lopresti BJ, et al. Kinetic modeling of amyloid binding in humans using PET imaging and Pittsburgh Compound-B. J Cereb Blood Flow Metab. 2005;25:1528–47. doi: 10.1038/sj.jcbfm.9600146. [DOI] [PubMed] [Google Scholar]
- 33.Watson CC. New, faster, image-based scatter correction for 3D-PET. IEEE Transactions of Nuclear Science. 2000;47:1587–94. [Google Scholar]
- 34.Meltzer CC, Kinahan PE, Greer PJ, et al. Comparative evaluation of MR-based partial-volume correction schemes for PET. J Nucl Med. 1999;40:2053–65. [PubMed] [Google Scholar]
- 35.Aizenstein HJ, Nebes RD, Saxton JA, et al. Frequent amyloid deposition without significant cognitive impairment among the elderly. Arch Neurol. 2008;65:1509–17. doi: 10.1001/archneur.65.11.1509. [DOI] [PMC free article] [PubMed] [Google Scholar]
- 36.Knibb JA, Xuereb JH, Patterson K, Hodges JR. Clinical and pathological characterization of progressive aphasia. Ann Neurol. 2006;59:156–65. doi: 10.1002/ana.20700. [DOI] [PubMed] [Google Scholar]
- 37.Kertesz A, McMonagle P, Blair M, Davidson W, Munoz DG. The evolution and pathology of frontotemporal dementia. Brain. 2005;128:1996–2005. doi: 10.1093/brain/awh598. [DOI] [PubMed] [Google Scholar]
- 38.Tang-Wai DF, Graff-Radford NR, Boeve BF, et al. Clinical, genetic, and neuropathologic characteristics of posterior cortical atrophy. Neurology. 2004;63:1168–74. doi: 10.1212/01.wnl.0000140289.18472.15. [DOI] [PubMed] [Google Scholar]
- 39.Josephs KA. Frontotemporal dementia and related disorders: deciphering the enigma. Ann Neurol. 2008;64:4–14. doi: 10.1002/ana.21426. [DOI] [PubMed] [Google Scholar]
- 40.Bian H, Van Swieten JC, Leight S, et al. CSF biomarkers in frontotemporal lobar degeneration with known pathology. Neurology. 2008;70:1827–35. doi: 10.1212/01.wnl.0000311445.21321.fc. [DOI] [PMC free article] [PubMed] [Google Scholar]
- 41.Engelborghs S, De Vreese K, Van de Casteele T, et al. Diagnostic performance of a CSF-biomarker panel in autopsy-confirmed dementia. Neurobiol Aging. 2008;29:1143–59. doi: 10.1016/j.neurobiolaging.2007.02.016. [DOI] [PubMed] [Google Scholar]
- 42.Koopman K, Le Bastard N, Martin JJ, Nagels G, De Deyn PP, Engelborghs S. Improved discrimination of autopsy-confirmed Alzheimer’s disease (AD) from non-AD dementias using CSF P-tau(181P) Neurochem Int. 2009;55:214–8. doi: 10.1016/j.neuint.2009.02.017. [DOI] [PubMed] [Google Scholar]
- 43.Hof PR, Bouras C, Constantinidis J, Morrison JH. Selective disconnection of specific visual association pathways in cases of Alzheimer’s disease presenting with Balint’s syndrome. J Neuropathol Exp Neurol. 1990;49:168–84. doi: 10.1097/00005072-199003000-00008. [DOI] [PubMed] [Google Scholar]
- 44.Tenovuo O, Kemppainen N, Aalto S, Nagren K, Rinne JO. Posterior cortical atrophy: a rare form of dementia with in vivo evidence of amyloid-beta accumulation. J Alzheimers Dis. 2008;15:351–5. doi: 10.3233/jad-2008-15301. [DOI] [PubMed] [Google Scholar]
- 45.Green J, Morris JC, Sandson J, McKeel DW, Jr, Miller JW. Progressive aphasia: a precursor of global dementia? Neurology. 1990;40:423–9. doi: 10.1212/wnl.40.3_part_1.423. [DOI] [PubMed] [Google Scholar]
- 46.Galton CJ, Patterson K, Xuereb JH, Hodges JR. Atypical and typical presentations of Alzheimer’s disease: a clinical, neuropsychological, neuroimaging and pathological study of 13 cases. Brain. 2000;123(Pt 3):484–98. doi: 10.1093/brain/123.3.484. [DOI] [PubMed] [Google Scholar]
- 47.Bobinski M, Wegiel J, Wisniewski HM, et al. Neurofibrillary pathology--correlation with hippocampal formation atrophy in Alzheimer disease. Neurobiol Aging. 1996;17:909–19. doi: 10.1016/s0197-4580(97)85095-6. [DOI] [PubMed] [Google Scholar]
- 48.Gorno-Tempini ML, Dronkers NF, Rankin KP, et al. Cognition and anatomy in three variants of primary progressive aphasia. Ann Neurol. 2004;55:335–46. doi: 10.1002/ana.10825. [DOI] [PMC free article] [PubMed] [Google Scholar]
- 49.Gomperts SN, Rentz DM, Moran E, et al. Imaging amyloid deposition in Lewy body diseases. Neurology. 2008;71:903–10. doi: 10.1212/01.wnl.0000326146.60732.d6. [DOI] [PMC free article] [PubMed] [Google Scholar]