Abstract
PURPOSE
The aim of this study was to evaluate the efficiency of manual polishing over autoglazed and overglazed porcelain and their effect on plaque accumulation.
MATERIALS AND METHODS
Thirty-six porcelain discs were fabricated out of which 18 each was subjected for autoglazing and overglazing. Half surface of the discs was left intact; the remaining half was roughened with medium grit diamond bur. Roughened surfaces were repolished by porcelain polishing kits (Shofu, DFS, Eve). All the surfaces were evaluated by the perthometer and SEM. Six discs from each sample were placed in human volunteer's mouth for 72 hours to evaluate the plaque accumulation. Acquired data was subjected to ANOVA comparative evaluation.
RESULTS
Roughened surfaces had average roughness value of 2.88±0.1935 µm. The repolished surfaces by porcelain correction kits Shofu, DFS and Eve, average roughness value reduced to 0.6250±0.1036, 0.9192±0.0953, 0.9017±0.1305 respectively. Autoglazed and overglazed surfaces showed the mean roughness value (Ra) of 0.4217±0.0685, 0.3450±0.0729. SEM study showed the improved surfaces when subjected for polishing. Plaque accumulation percentage was the highest on roughened surface (93.83±6.2552%), followed by porcelain discs polished by commercial kits. Autoglazed surfaces found to be the best surfaces with the least plaque accumulation (0.5237±0.4209%).
CONCLUSION
All the polishing kits used in the study reduced the average roughness by approximately 77%. Corrected porcelain surfaces should ideally be reglazed, alternatively, polish the surfaces before final cementation.
Keywords: Porcelain polishing, Clinical chair-side correction, Plaque accumulation, Average roughness, Perthometer, Scanning electron microscope
INTRODUCTION
Porcelain has been used as a restorative material in dentistry from last 150 years. It is considered as an ideal material for the restorative purpose because of its esthetic quality, low thermal conductivity, resistance to degradation and excellent biocompatibility due to its glazed surface.1 Porcelain glazing procedure produces the restoration surface with light reflection similar to natural teeth and discourages plaque accumulation. In modern dental practice, glazing can be achieved by overglaze or autoglaze procedures.
Clinical practice necessitates the correction of glazed porcelain both in pre-cementation and post-cementation stages. These circumstances include creating more favorable contours, improvement of esthetic appearance, finishing the margin of porcelain bonded restorations and correction of occlusal discrepancy. The resultant rough and ground porcelain surface due to grinding induces many biological and physical problems. Biological effects include increased tendency for deposition of plaque,2-8 inflammatory reaction on the residual ridge mucosa which is in contact with pontic,9 caries and periodontitis. Surface roughness and free energy play a very important role in supragingival plaque accumulation. Smooth and polished surface with low surface free energy minimizes plaque formation, hence reduces the initiation of caries and periodontitis.10-12
Podshadley and Harrison13 in their research work on rat connective tissue response for rough and smooth restorative surfaces reported that unglazed porcelain surface in tissue contact can arouse an adverse tissue response. While Henry et al.9 after comparative evaluation of the tissue changes beneath the fixed partial denture among different restorative materials concluded the most hygienic surface is glazed porcelain.
Deleterious effects of the rough and ground porcelain that are physical in nature includes more susceptibility for fracture due to propagation of microcracks,14,15 increase in wear of opposing restoration and/or tooth16,17 and discoloration due to more plaque accumulation. Increased wear of opposing teeth, loss of vertical dimension and interceptive contacts due to unglazed porcelain teeth induces traumatic occlusion in complete denture. Re-firing of the porcelain teeth in removable prosthesis is impossible due to thermoplastic nature of acrylic resin. Additional firing for glazing may have a deleterious effect on the porcelain itself like devitrification. Moreover, re-glazing is more time consuming as the chair side time, transportation, and laboratory time are involved. Grinding process removes glazed superficial surface. Ideally, it is advised to be re-glazed to get the smooth surface. Alternatively, it is suggested to use commercial polishing kits with diamond points, rubber wheels, and abrasive pastes to polish the surface. Quantitative assessment of this auto glazed and over glazed surface characteristics with that of the polished would assist the dentist in making an informed and proper clinical decision regarding the selection of appropriate finishing and polishing kits as well as procedures involved.
Therefore, this experimental study comprising of metal ceramic discs, which were glazed, roughened and re polished has been planned with following objectives:
To quantitatively evaluate and compare the surface roughness of autoglazed, overgalzed porcelain with polished surfaces using manual polishing kits by perthometer.
To compare the porcelain surface roughness qualitatively by scanning electron microscope (SEM).
To compare the effect of manual polishing on plaque accumulation by visual assessment with the aid of plaque disclosing agents.
MATERIALS AND METHODS
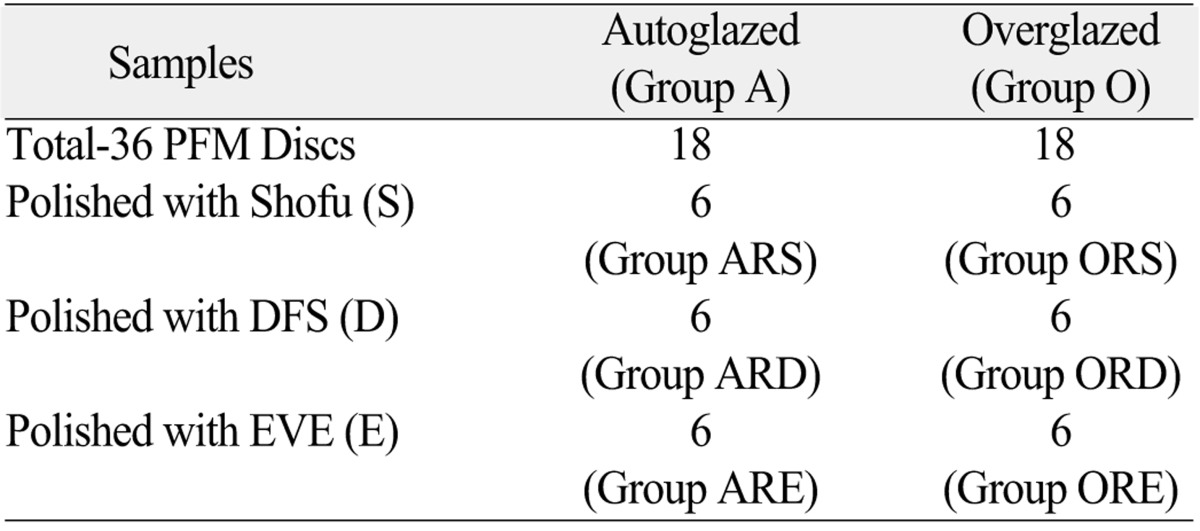
Commercial polishing kits used for porcelain polishing were Shofu (Shofu dental Corp, Menlo Park, California, USA), DFS (DFS-Diamon GmbH, Riedenberg, Germany) and Eve (Ernst Vetter GmbH, Pforzheim, Germany). They were designated as sample S, D and E, respectively (Table 1).
Table 1.
Distrbution of samples according to test condition/polishing treatment given before surface roughness evaluation
Wax patterns, which were in circular disc shape having the diameter of 10 mm and 1 mm thickness was fabricated with the aid of lubricated plastic stencil, supported by flat glass slab from bottom side. Total of 36 wax patterns were prepared as mentioned above, 12 samples each for three groups of polishing kits (polishing Kit S-12,D-12,E-12). Sprued wax patterns were invested,cast in standard method using phosphate bonded (DeguvestGF, Degussa Dental, Hanau, Germany) investment and nickel chromium metal pellets (Remenium Cse, Dentarum, Isprigen, Germany) in a high-frequency induction casting machine. Cast metal discs were detached from runner bar preserving approximately 1.5 mm sprue length. This was used as a strut for porcelain built up and mechanical retentive aid for incorporating metallic discs to acrylic resin plates. All specimens were prepared for porcelain build up by cleaning them with sand blasting with aluminum oxide at 4.5 bar pressure, and ultrasonic cleanser for 10 minutes.
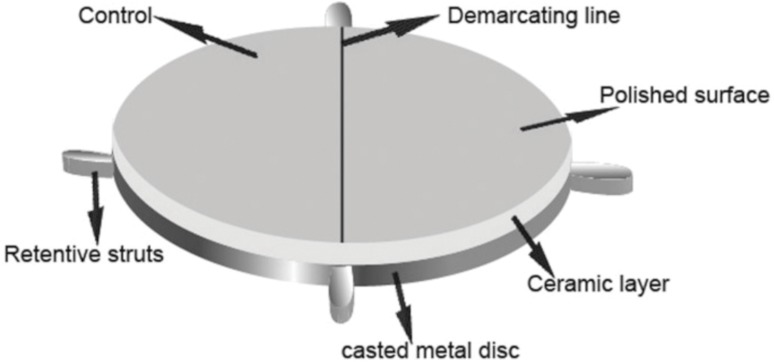
Porcelain was built up on the prepared metal discs by applying one layer of opaque layer (3R2.5) and two layer of dentin porcelain (3R2.5 VitaVMK, Vident, Brea, CA, USA) according to the manufacturer's instruction. Before subjecting the second dentine layer for firing cycle, the discs were approximately divided into two equal semilunar halves with a groove made on the surface of porcelain. Jet black porcelain stain was applied to this groove to utilize as demarcating line. This acted as a boundary for demarcating the control (overglazed/autoglazed) side from the other half which was subjected for roughening and polishing (Fig. 1). Porcelain built up was completed with a final layer of enamel (EN-3) layer over dentin porcelain.
Fig. 1.
Porcelain sample with demarcating line in the center.
Thirty six samples were divided into two groups of 18 each, while one group was over glazed and the remaining 18 samples were subjected to auto glazing at 930℃ temperature. Half sides of each porcelain sample was subjected to roughening with a medium grit sintered diamond point used in porcelain grinding under constant pressure and time (20 sec).This was done to simulate the clinical chair side adjustment, while the other half was kept intact as control. Control and the roughened surfaces were analyzed for average roughness value (Ra) with Perthometer (M4Pi, Mahr GmbH, Gottingen, Germany). This formed the first baseline data to which the later average roughness values of smoothened surfaces were compared. These roughened half surfaces (12 samples each for Kit S, D and E) were subjected to manual polishing using polishing kit as per each Kit manufacturer's instruction. During roughening as well as subsequent polishing procedure care was taken not to pass the diamond/polishing points on to the control surface. After polishing, all specimens were ultra-sonically cleaned and surface profiles were evaluated quantitatively with the aid of Perthometer. The traverse length of pick up probe was set at 4.8 mm, and Ra values were recorded. The average Ra value obtained from perthometer readings of Group-ARS/ORS, Group-ARD/ORD and Group-ARE/ORE provided the second baseline data. Above data formed the basis for statistical analysis for comparative evaluation of polished surfaces with autoglazed and overglazed surfaces for their surface roughness. The specimen's surface roughness was qualitatively evaluated with Scanning Electron Microscope (JOEL, model JSM, 840 A. Tokyo, Japan) after gold sputter coating. The resultant data collected was subjected for one-way ANOVA test to find the statistically significant difference in their average roughness value.
To evaluate the plaque accumulation on the test surfaces, twelve volunteers were selected in the age group of 18-22 years after getting their informal consent. Total 24 samples were used for plaque accumulation evaluation, three each from Group ARS/ORS, ARD/ORD and ARE/ORE. For Group R (roughened) two samples from each group were re-roughened with same medium grit diamond bur. Two specimens were embedded randomly in each autopolymerizing acrylic retention plate in the mandibular lingual anterior region (Fig. 2). These retention plates along with specimens were placed in a volunteer's mouth for three days (72 hours) requesting them not to brush and clean the specimen. Test specimens were retrieved after three days, they were stained with plaque disclosing solution (Alfa Ploc) and observed under magnifying glass. The total surface area against the plaque accumulated area of each specimen was calculated by placing the OHP graph sheet on the test specimen. Quantitative plaque accumulation percentage was evaluated by following formula-
Fig. 2.
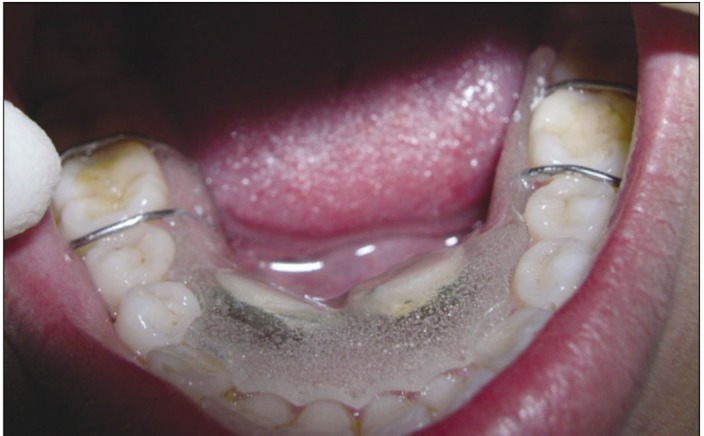
Lower retention plates with embedded porcelain samples.
 |
RESULTS
To rule out the probability of difference in amount of surface roughness value (Ra) of roughened surfaces, they were subjected for evaluation and statistical analysis. Statistically no significant difference was found within roughened groups (average roughness value 2.88 ± 0.1935 µm) with 'f' value 0.092 at 1% level of confidence before subjecting them for manual polishing.
Table 2 depicts statistical comparison of autoglazed/overglazed surfaces and polished surface (Group ARS/ORS, Group ARD/ORD and Group ARE/ORE) with their respective pre-polished surfaces for average surface roughness. Ra value for Group A, O, S, D and Group E were 0.4217 ± 0.0685, 0.3450 ± 0.0729, 0.6250 ± 0.1036, 0.9192 ± 0.0953, 0.9017 ± 0.1305 respectively with 'P' value less than 1% level of confidence. This indicates the existence of statistically significant difference between all groups (control/polished) surfaces and their counterpart roughened surfaces. This illustrates all the polished sample surfaces had the better surface characteristics than rough surfaces.
Table 2.
Statistical comparison (by student 't' test) of means and standard deviations of autoglazed/overglazed and polished surfaces with their respective pre-polished roughened/deglazed surfaces. n = 12 (6 autogalze + 6 overglaze)
The statistical analysis (Table 3) by one way analysis of variance (ANOVA) to compare the difference in average surface roughness values between the Group A, Group O, Group S, Group D, Group E after polishing. It shows the statistically significant difference between all groups with 'F' value of 90.0483, and 'P' value of <.01.
Table 3.
Statistical analysis (by ANOVA) to compare the difference in average surface roughness values between the Control Groups (A-autoglaze, O-overglaze), Group S, Group D, and Group E after polishing
S-significant 1% level of confidence.
SV: source of vaiation, DF: degree of freedom, SS: sum of squares, MSS: mean square.
Scheffe's multiple comparison tests (Table 4) of average values between the groups portrays no statistical difference between Group A and Group O, with P-value of .04473. Statistical analysis showed the presence of statistically significant difference between Control Groups (Group A, Group O) and polished surface Groups (Group S, Group D, and Group E) with 'P' value of <.01 and no statistical difference shown between Group D, and Group E with P value of .9953.
Table 4.
Statistical comparison by Scheffe's multiple comparison tests of average Ra values between all 5 groups
Table 5 shows the Statistical comparison (student 't' test) of mean surface roughness (Ra) between autoglaze surface (control) with autoglazed, roughened and subsequently polished by SHOFU (ARS), DFS (ARD) and EVE (ARE) groups in µm. Results point to the existence of statistically significant difference between autoglazed (control) and Groups ARS, ARD, ARE with; 't' values of -4.3236, -11.5543, -7.0404 respectively and 'P' value at <.01. Table 5 also shows the statistical comparison (student 't' test) of mean surface roughness (Ra values in µm) between overglazed surface (control) with overglazed, roughened and subsequently polished with SHOFU (ORS), DFS (ORD) and EVE (ORE) Groups. Again the statistical analysis indicated the presence of significant differences between overglazed (control) and ORS, ORD, ORE Groups, with 't' values of -6.6969, -9.9159, -16.4879, respectively with 'P' value at <.01.
Table 5.
Statistical comparison (student 't' test) of mean surface roughness (Ra) in µm between Autoglaze surface/overglaze (control) with respective roughened and subsequently polished with SHOFU (ARS), DFS (ARD) and EVE (ARE) n = 6
Table 6 shows the statistical comparison (student 't' test) between mean roughness (Ra) values of Autoglazed, roughened, polished surface and overglazed -roughened - polished surface between the same group i.e. Group S, Group D, Group E in µm. Result shows that statistically no significant difference was found between the groups autoglazed→ roughened→ polished surfaces and overglazed→ roughened→ polished surfaces of porcelain discs.
Table 6.
Statistical comparison (student 't' test) between mean roughness values (Ra) in µm of autoglazed roughened polished and overglazed roughened polished between same group (Group S, Group D, Group E)
Therefore, with the statistical analysis above, it was inferred that surface characteristics of control group (Group A, and Group O) surfaces were slightly superior to the polished surfaces.
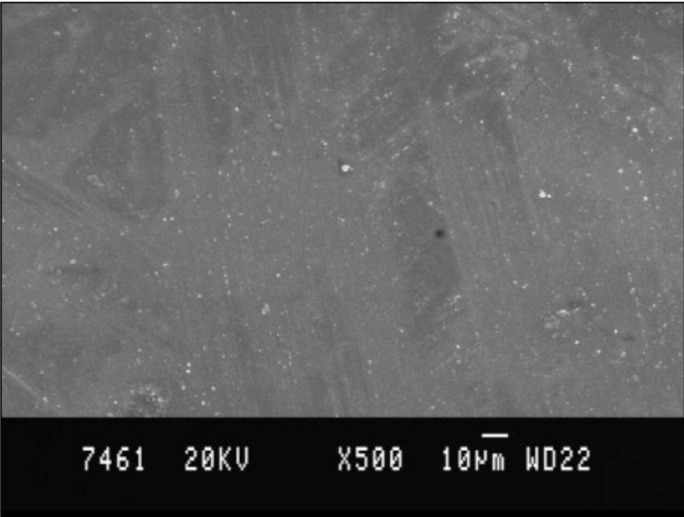
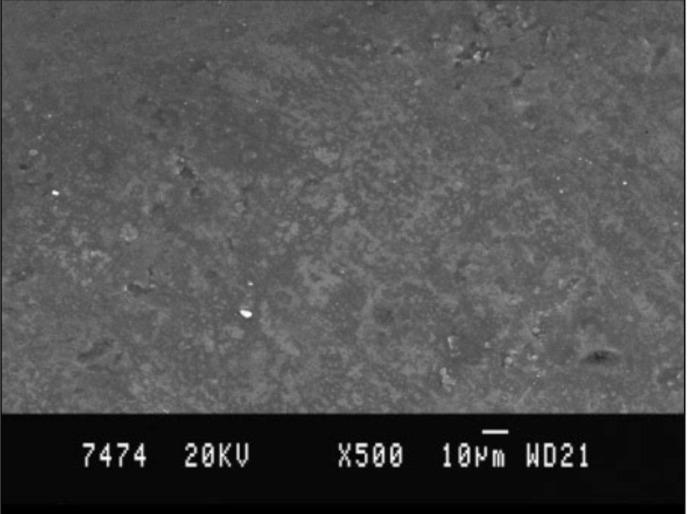
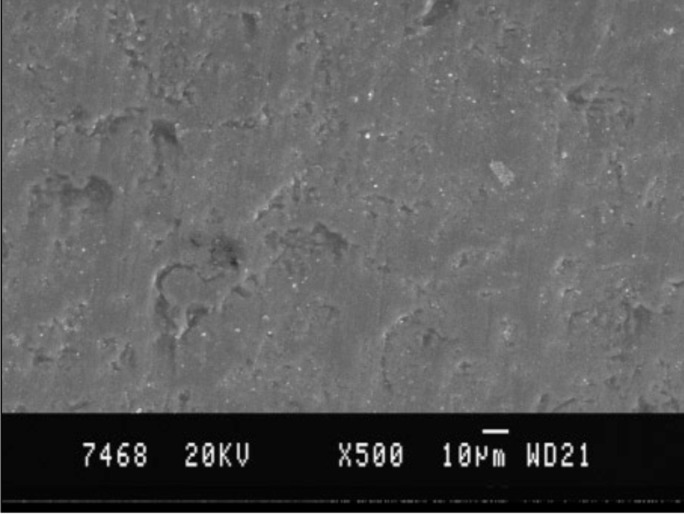
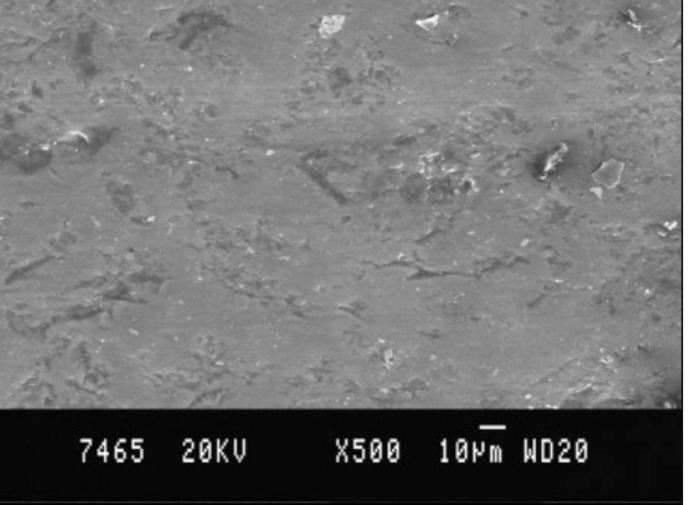
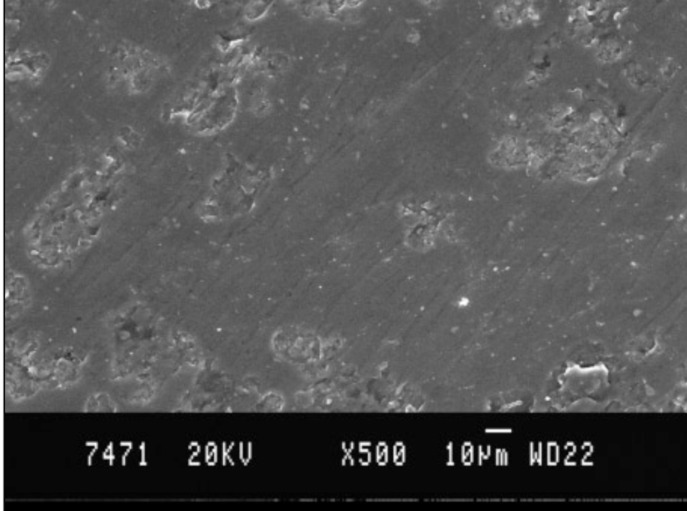
Qualitative surface topography was evaluated with photomicrographs using scanning electron microscope. Photomicrographs of rough surface showed the irregular surface with sharp ridges and grooves, indicating high roughness (Fig. 3). Photomicrograph of overglazed sample depicts the surface with uniform surface texture and very small island of unblended surfaces (Fig. 4), and auto glazed surface had uniform distribution of glassy phase (Fig. 5). Photomicrographs of polished surfaces appeared to be smooth and only fine ridges and grooves were present (Figs. 6-8).
Fig. 3.
Scanning electron microscopic photograph of roughened porcelain sample surface (×250).
Fig. 4.
Scanning electron microscopic photograph of overglazed (Group O) porcelain sample surface (×500).
Fig. 5.
Scanning electron microscopic photograph of autoglazed (Group A) porcelain sample surface (×500).
Fig. 6.
Scanning electron microscopic photograph of porcelain sample surface polished with Kit S, Shofu (×500).
Fig. 8.
Scanning electron microscopic photograph of porcelain sample surface polished with Kit E, EVE (×500).
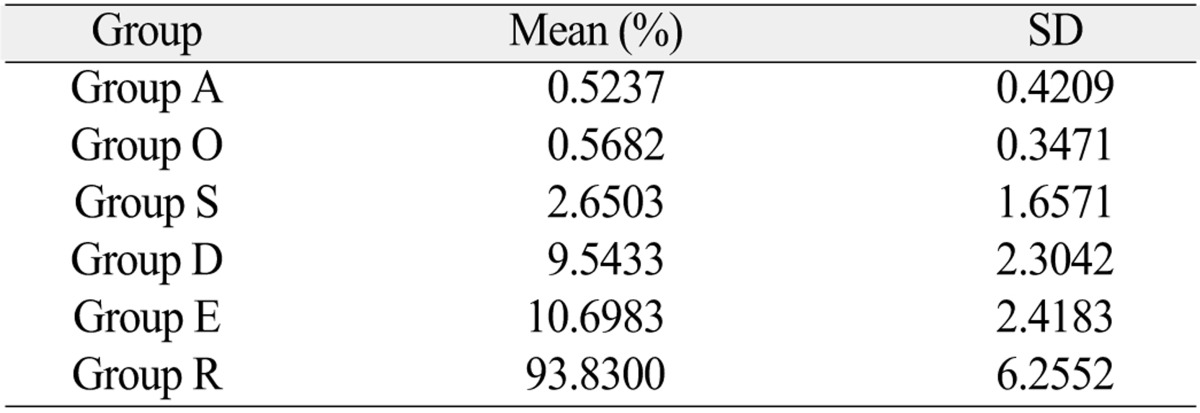
Table 7 shows that the roughened surface (Group R) with the highest percentage of plaque accumulation of 93.83 ± 6.2552%, followed by surface of Group E - 10.6983 ± 2.4183%, Group D - 9.5433 ± 2.3042%, Group S - 2.6503 ± 1.6571%, Group O - 0.5682 ± 0.3471%, Group A - 0.5237 ± 0.4209%, i.e the least being on the autoglazed surface. Statistically significant (Table 8) difference was found in the percentage of plaque accumulation on surfaces of the control Groups (autoglazed and overglazed) and polished surfaces with F value of 905.1126 at P value <.01 .
Table 7.
Mean and standard deviation of the percentage of surface area covered by the plaque on the surfaces of specimens of the Group A, Group O, Group S, Group D, Group E, Group R (Roughened)
Table 8.
Statistical analysis by ANOVA to compare the percentage of surface area covered by plaque on specimens of the Group A, Group O, Group S, Group D, Group E, Group R
SS: sum of squares, df: degree of freedom, MS: mean square.
DISCUSSION
The wide application of porcelain in modern restorative dentistry has created numerous concerns for the clinicians. The glazed porcelain is considered as the ideal restorative material whereas rough/deglazed surfaces are highly contraindicated because of their numerous deleterious effects. However,clinical realities make it almost imperative for the dentist to correct the porcelain before cementation or sometimes even after cementation as in the case of incomplete seating of PFM crowns. These corrections leave the porcelain surface rough, deglazed and make the porcelain surface susceptible for plaque accumulation,8-12 decrease in strength of porcelain14,15,18 and increase the wear of the opposing natural teeth as well as restorative surfaces.16,17 This have been well documented by the researchers such as Wiley19 and Jagger, Harrison et al.20 although it is mandatory and strongly advocated to re-glaze the ground porcelain restorations, in many circumstances, the reglazing of the rough surface is impossible. Other alternatives are the use of commercially available porcelain polishing kits for polishing rough porcelain surface. It is prudent to know the efficacy of these porcelain polishing kits in reducing the surface roughness before selecting them for routine use in the clinical practice.
The simulated chair-side porcelain correction with medium grit diamond bur resulted in average roughness value of 2.88 ± 0.1935 µm, indicating the absolute necessity of re-glazing or polishing of corrected porcelain surface. These roughened surfaces were polished with porcelain polishing kits (Shofu, DFS, EVE) following the manufacturer's instructions and surface roughness (Ra) was quantitatively evaluated with Perthometer. Reports of smoothness results from different polishing techniques are numerous, yet they varied in methodology of polishing as well as in results.
Report of earlier studies is contradicting; some studies indicated the surface produced by the polishing kits was equivalent to glazed porcelain surface.21-24 Other groups of researchers had contradictory reportsthat polished surface was slightly inferior to that of glazed surface.25-27
Present study shows Ra value for Group A, O, S, D and Group E were 0.4217 ± 0.0685, 0.3450 ± 0.0729, 0.6250 ± 0.1036, 0.9192 ± 0.0953, 0.9017 ± 0.1305, respectively with 'P' value less than 1% level of confidence. This indicates the existence of statistically significant difference between all groups (control/polished) surfaces and their counterpart roughened surfaces. This also illustrates glazed surfaces had better surface characteristics than the polished surfaces. The over glazed surfaces found to be the best, and among the commercial kits tested, Shofu porcelain polishing kit was found to impart better polishing compared to other kits. Therefore, with the above results, it was inferred that surface characteristics of control group (Group A, and Group O) surfaces were slightly superior to the polished surfaces.
The difference in the magnitude of Ra values reported in these studies compared to other studies may be due to variation in methodology, type of porcelain used, and firing cycle utilized for glazing.
Qualitative surface topography was evaluated with photomicrographs using Scanning electron microscope.
Photomicrographs of rough surface had the irregular surface with sharp ridges and grooves, indicating high roughness. Glazed surfaces showed uniform surface texture and homogenous surfaces without any defect. Polished surface revealed substantial reduction in the amount of ridges and grooves; Surfaces had only fine ridges and grooves.
All polished surfaces showed the presence of defects on the surface representing the voids from inadequate condensing and/or sintering of the porcelain. Such voids were not seen in the autoglazed and overgalzed surfaces.
The qualitative evaluation as well as the quantitative analysis of the control (initial autoglazed/overglazed) surface average roughness and polished surface average roughness values of Group S, Group D, Group E showed the significant variation between them in respect to the surface characteristics. Important observation of the study was that even though polishing kits varied in their ability in reducing the surface roughness of ground porcelain surface, they all succeeded in reducing the surface roughness substantially. Hence, it was inferred that although polishing of the porcelain with polishing kits cannot substitute for glazing, in the circumstances wherein re-glazing is impossible, polishing with porcelain polishing kits can be done as it produces clinically acceptable results.
Surface roughness of a crown facilitates plaque retention by enhancing the colonization by outgrowth from fissures. Quirynen et al.10 stressed on influence of surface-free energy for plaque adhesion and accumulation and suggested the use of smooth surface on restoration because of its low free energy, fewer plaque adherence and accumulation, thereby reducing the incidence of caries and periodontal diseases.
Henry et al.9, in his evaluation of tissue changes beneath the fixed partial denture, reported the glazed porcelain as the best of the material when compared to rough surfaces because of its excellent biocompatibility. The roughened surface (Group R) had the highest percentage of plaque accumulation of 93.83 ± 6.2552%, followed by surface of Group E - 10.6983± 2.4183%, Group D - 9.5433 ± 2.3042%, Group S - 2.6503 ± 1.6571%, Group O - 0.5682 ± .3471%, Group A - 0.5237 ± 0.4209%; The least being on the auto glazed surface. Statistically significant difference was found in the percentage of plaque accumulation on surfaces of the control groups (autoglazed and over glazed) and polished surfaces with F value of 905.1126 at P value <.01. On a statistical comparison (student 't' test) difference in plaque accumulation between Autoglazed and over glazed surfaces was statistically insignificant, while all other groups showed statistically significant difference in plaque accumulation. Results of this study coincided with observation in other studies conducted by Clayton and Green,3 Wise and Dykema,8 where it was reported that autoglazed surface of porcelain had the least amount of plaque accumulation when compared with other restorative materials.
Therefore, it was inferred that for chair-side corrected porcelain, surface smoothening is mandatory because of its tendency of high plaque accumulation. Even though the statistically significant difference was present between the percentage of plaque accumulation on autoglaze/overglaze surface and polished surface, it was substantially less as compared to a roughened surface. Hence, it is recommended the deglazed surface should be re-polished with porcelain polishing kits to reduce the detrimental effect of the rough surfaces on gingival tissues.
Limitations of the study include study being in vitro in nature as it may not be an actual reproduction of what may happen in the oral cavity. The influence of saliva, food, temperature changes, pH changes were not considered. Plaque accumulation is influenced not only by the roughness but also by the contours, margin's placement, etc. These parameters were not included in the study.
CONCLUSION
Glazed surface irrespective of autoglazing or overglazing showed the least mean surface roughness. All the polishing kits used in the study could provide smooth surface. Surface roughness value decreased by approximately 77%. The corrected/ground porcelain surface led to the maximum plaque accumulation, whereas plaque accumulations of polished surfaces were comparatively much less than roughened surfaces. Autoglazed surface had the least amount of plaque accumulation compared to other surfaces.
Hence, it is imperative on the part of the clinicians to polish the roughened porcelain surface resulting from chair-side correction to minimize the harmful effect of rough porcelain surface on the hard/soft tissues in the mouth.
Fig. 7.
Scanning electron microscopic photograph of porcelain sample surface polished with Kit D, DFS (×500).
References
- 1.Rosenstiel SF, Land MF, Fujimoto J. Contemporary Fixed prosthodontics. 4th ed. St. Louis: CV Mosby; 2006. p. 631. [Google Scholar]
- 2.Gildenhuys RR, Stallard RE. Comparison of plaque accumulation on metal restorative surfaces. Dent Surv. 1975;51:56–59. [PubMed] [Google Scholar]
- 3.Clayton JA, Green E. Roughness of pontic materials and dental plaque. J Prosthet Dent. 1970;23:407–411. doi: 10.1016/0022-3913(70)90007-7. [DOI] [PubMed] [Google Scholar]
- 4.Sorensen JA. A rationale for comparison of plaque-retaining properties of crown systems. J Prosthet Dent. 1989;62:264–269. doi: 10.1016/0022-3913(89)90329-6. [DOI] [PubMed] [Google Scholar]
- 5.Kaqueler J, Weiss M. Plaque accumulation on dental restorative materials. J Dent Res. 1970;49:202. [Google Scholar]
- 6.Keenan MP, Shillingburg HT, Jr, Duncanson MG, Jr, Wade CK. Effects of cast gold surface finishing on plaque retention. J Prosthet Dent. 1980;43:168–173. doi: 10.1016/0022-3913(80)90182-1. [DOI] [PubMed] [Google Scholar]
- 7.Swartz ML, Phillips RW. Comparison of bacterial accumulation on rough and smooth enamel surfaces. J Periodontol. 1957;28:304–307. [Google Scholar]
- 8.Wise MD, Dykema RW. The plaque-retaining capacity of four dental materials. J Prosthet Dent. 1975;33:178–190. doi: 10.1016/s0022-3913(75)80108-9. [DOI] [PubMed] [Google Scholar]
- 9.Henry PJ, Johnston JF, Mitchell DF. Tissue changes beneath fixed partial dentures. J Prosthet Dent. 1966;16:937–947. doi: 10.1016/0022-3913(66)90016-3. [DOI] [PubMed] [Google Scholar]
- 10.Quirynen M, Marechal M, Busscher HJ, Weerkamp AH, Darius PL, van Steenberghe D. The influence of surface free energy and surface roughness on early plaque formation. An in vivo study in man. J Clin Periodontol. 1990;17:138–144. doi: 10.1111/j.1600-051x.1990.tb01077.x. [DOI] [PubMed] [Google Scholar]
- 11.Quirynen M, Van der Mei HC, Bollen CM, Van den Bossche LH, Doornbusch GI, van Steenberghe D, Busscher HJ. The influence of surface-free energy on supra- and subgingival plaque microbiology. An in vivo study on implants. J Periodontol. 1994;65:162–167. doi: 10.1902/jop.1994.65.2.162. [DOI] [PubMed] [Google Scholar]
- 12.Quirynen M, Bollen CM. The influence of surface roughness and surface-free energy on supra- and subgingival plaque formation in man. A review of the literature. J Clin Periodontol. 1995;22:1–14. doi: 10.1111/j.1600-051x.1995.tb01765.x. [DOI] [PubMed] [Google Scholar]
- 13.Podshadley AG, harrison JD. Rat connective tissue response to pontic materials. J Prosthet Dent. 1966;16:110–118. [Google Scholar]
- 14.Giordano RA, 2nd, Campbell S, Pober R. Flexural strength of feldspathic porcelain treated with ion exchange, overglaze, and polishing. J Prosthet Dent. 1994;71:468–472. doi: 10.1016/0022-3913(94)90184-8. [DOI] [PubMed] [Google Scholar]
- 15.Williamson RT, Kovarik RE, Mitchell RJ. Effects of grinding, polishing, and overglazing on the flexure strength of a high-leucite feldspathic porcelain. Int J Prosthodont. 1996;9:30–37. [PubMed] [Google Scholar]
- 16.al-Hiyasat AS, Saunders WP, Sharkey SW, Smith GM, Gilmour WH. The abrasive effect of glazed, unglazed, and polished porcelain on the wear of human enamel, and the influence of carbonated soft drinks on the rate of wear. Int J Prosthodont. 1997;10:269–282. [PubMed] [Google Scholar]
- 17.Monasky GE, Taylor DF. Studies on the wear of porcelain, enamel, and gold. J Prosthet Dent. 1971;25:299–306. doi: 10.1016/0022-3913(71)90191-0. [DOI] [PubMed] [Google Scholar]
- 18.Fairhurst CW, Lockwood PE, Ringle RD, Thompson WO. The effect of glaze on porcelain strength. Dent Mater. 1992;8:203–207. doi: 10.1016/0109-5641(92)90084-p. [DOI] [PubMed] [Google Scholar]
- 19.Wiley MG. Effects of porcelain on occluding surfaces of restored teeth. J Prosthet Dent. 1989;61:133–137. doi: 10.1016/0022-3913(89)90360-0. [DOI] [PubMed] [Google Scholar]
- 20.Jagger DC, Harrison A. An in vitro investigation into the wear effects of unglazed, glazed, and polished porcelain on human enamel. J Prosthet Dent. 1994;72:320–323. doi: 10.1016/0022-3913(94)90347-6. [DOI] [PubMed] [Google Scholar]
- 21.Sulik WD, Plekavich EJ. Surface finishing of dental porcelain. J Prosthet Dent. 1981;46:217–221. doi: 10.1016/0022-3913(81)90312-7. [DOI] [PubMed] [Google Scholar]
- 22.Klausner LH, Cartwright CB, Charbeneau GT. Polished versus autoglazed porcelain surfaces. J Prosthet Dent. 1982;47:157–162. doi: 10.1016/0022-3913(82)90180-9. [DOI] [PubMed] [Google Scholar]
- 23.Scurria MS, Powers JM. Surface roughness of two polished ceramic materials. J Prosthet Dent. 1994;71:174–177. doi: 10.1016/0022-3913(94)90027-2. [DOI] [PubMed] [Google Scholar]
- 24.Ward MT, Tate WH, Powers JM. Surface roughness of opalescent porcelains after polishing. Oper Dent. 1995;20:106–110. [PubMed] [Google Scholar]
- 25.Patterson CJ, McLundie AC, Stirrups DR, Taylor WG. Efficacy of a porcelain refinishing system in restoring surface finish after grinding with fine and extra-fine diamond burs. J Prosthet Dent. 1992;68:402–406. doi: 10.1016/0022-3913(92)90400-5. [DOI] [PubMed] [Google Scholar]
- 26.el-Karaksi AO, Shehab GI, Eskander ME. Effect of reglazing and of polishing on the surface roughness of new ceramic restorations (Hi-ceram) Egypt Dent J. 1993;39:485–490. [PubMed] [Google Scholar]
- 27.Chu FC, Frankel N, Smales RJ. Surface roughness and flexural strength of self-glazed, polished, and reglazed In-Ceram/Vitadur Alpha porcelain laminates. Int J Prosthodont. 2000;13:66–71. [PubMed] [Google Scholar]


