

Summary
The paraneoplastic neurologic disorders target several families of neuron-specific RNA binding proteins (RNABPs), revealing that there are unique aspects of gene expression regulation in the mammalian brain. Here we used HITS-CLIP to determine robust binding sites targeted by the neuronal Elav-like (nElavl) RNABPs. Surprisingly, nElav protein bind preferentially to GU-rich sequences in vivo and in vitro, with secondary binding to AU-rich sequences. nElavl-null mice were used to validate the consequence of these binding events in the brain, demonstrating that they bind intronic sequences in a position dependent manner to regulate alternative splicing and to 3’UTR sequences to regulate mRNA levels. These controls converge on the glutamate synthesis pathway in neurons; nElavl proteins are required to maintain neurotransmitter glutamate levels, and the lack of nElavl leads to spontaneous epileptic seizure activity. The genome-wide analysis of nElavl targets reveals that one function of neuron-specific RNABPs is to control excitation-inhibition balance in the brain.
Introduction
The regulation of post-transcriptional gene expression increases organismal complexity and proteome diversity in higher organisms. Not surprisingly such regulation, including alternative splicing (AS), 3’ UTR regulation and RNA editing is especially prevalent in the nervous system, likely underlying the complex set of reactions carried out in this tissue required for the development and physiology of the many different cell types in the brain (Castle et al., 2008; Li et al., 2009; Li et al., 2007; Licatalosi and Darnell, 2010; Pan et al., 2008; Wang et al., 2008). Tissue-specific AS and 3’ UTR regulation are regulated by the interactions of cis-acting elements on RNA with RNA binding proteins (RNABPs) that bind to and either block or enhance the recruitment of the regulatory machinery. New technologies to assess tissue-specific AS have rapidly expanded (Barash et al., 2010; Calarco et al., 2011; Castle et al., 2008; Das et al., 2007), revealing new rules of regulation, such as the finding that the position of RNABP binding within a pre-mRNA is a major determinant of AS control (Licatalosi and Darnell, 2010).
Although a very large fraction of RNABPs encoded in the mammalian genomes are expressed in the nervous system, their RNA targets and the roles of these targets in neuronal physiology are largely unknown (McKee et al., 2005). One such highly abundant family of RNABPs are the Elavl (Elav-like) genes and share significant homology with the Drosophila elav (embryonic lethal and abnormal vision) gene. Elavl1 (HuA/R) is expressed in a wide range of non-neuronal tissues and has been reported to regulate various gene expression processes in tissue culture cells, including regulation of steady state levels by binding to ARE (AU-rich elements) in 3’UTRs of target mRNAs (Brennan and Steitz, 2001; Hinman and Lou, 2008). Three other family members, Elavl2 (HuB/Hel-N1), Elavl3 (HuC) and Elavl4 (HuD) were discovered as autoantigens in a multi-system neurologic disorder termed paraneoplastic encephalomyelopathy (Szabo et al., 1991), and are exclusively expressed in neurons (referred to here as neuronal Elavl (nElavl)) (Okano and Darnell, 1997). The nElavl proteins exhibit a high degree of sequence homology and structural similarity with two well-established Drosophila AS factors, ELAV and SXL (Sex-lethal) (Koushika et al., 1996; Koushika et al., 2000; Lisbin et al., 2001; Soller and White, 2003, 2005; Wang and Bell, 1994). More recently, several studies carried out in mammalian cell lines have presented evidence that the nElavl proteins are able to regulate alternative splicing of several pre-mRNAs (Hinman and Lou, 2008; Lebedeva et al., 2011; Mukherjee et al., 2011; Wang et al., 2010a; Zhu et al., 2008). However, it is not known whether and to what extent nElavl proteins are regulators of AS in vivo in the mammalian nervous system. Moreover, the range of endogenous target RNAs of nElavl proteins and the kinds of neuronal processes regulated by these targets are unknown, other than a compilation of RNAs co-precipitating with Elavl4(HuD) in transgenic Elavl4 overexpressing mice (Bolognani et al., 2010).
Generating RNA profiles that compare WT and mutant animals has provided a powerful means of correlating RNA variants with the action of RNABPs, but such strategies are unable to discriminate direct from indirect actions. Combining such data with global maps of direct RNABP-RNA interaction sites can generate unbiased genome-wide insight into the regulation of alternative splicing (Licatalosi and Darnell, 2010). This has been accomplished by applying cross-linking and immunoprecipitation methods (Jensen and Darnell, 2008; Ule et al., 2005a; Ule et al., 2003), particularly in combination with high-throughput sequencing (HITS-CLIP) (Licatalosi et al., 2008), to analyze in vivo RNABP-RNA interactions (Darnell, 2010). HITS-CLIP was first used to identify hundreds of transcripts that are directly regulated by the neuronal RNABP Nova in the brain (Licatalosi et al., 2008), and has subsequently been used to analyze RNA regulation mediated by a number of RNABPs (Darnell et al., 2011; Konig et al., 2010; Lebedeva et al., 2011; Mukherjee et al., 2011; Tollervey et al., 2011; Xue et al., 2009; Yeo et al., 2009). Such analyses have yielded significant insight into the role of RNA regulatory proteins in neuronal physiology, development and disease (Huang et al., 2005; Ruggiu et al., 2009; Yano et al., 2010).
In this study we have generated Elavl3 null mice, used splicing-sensitive microarrays and deep RNA sequencing to identify nElavl-dependent regulatory events, and overlaid this analysis with nElavl HITS-CLIP maps. Our results indicate that in the brain, nElavl preferentially binds to conserved U-rich sequences interspersed with G residues at exon-intron junctions to either repress or enhance the inclusion of alternative exons. This data were used to generate a position-dependent map of nElavl functional binding sites in AS regulation, and to discover that while nElavl regulates largely independent gene networks through overall transcript level and AS, these intersect in the control of the synthesis of the major excitatory neurotransmitter glutamate. In the absence of nElavl proteins the level of glutamate is severely compromised, and this imbalance is associated with seizures in Elavl3-null mice. Taken together our genome-wide approaches identify in vivo targets and functions of nElavl proteins in regulating brain RNA and excitability.
Results
Generation of Elavl3 Knockout Mice
To assess the functional action of Elavl3 on target transcripts, we first generated an Elavl3 null mouse by homologous recombination in ES cells (Fig.1A). Mice harboring the homologous recombinant cassette made no detectable Elavl3 by either RNA or protein analysis, including Western blot and immunofluorescence microscopy (Fig.1B and data not shown). Elavl3-/- mice were viable and fertile. However, when they were inbred into a C57Bl/6 background, we noted that Elavl3-/- mice were present in new litters at well-below Mendelian ratios (~10% offspring from the mating of two heterozygous parents). Interestingly, when Elavl3-/- mice were outbred into the CD1 strain, Elavl3-/- pups were born at Mendelian ratios, suggesting gene modifiers present in the outbred CD1 strain.
Fig. 1. Generation of Elavl3-/- knockout mice.

(A) The targeting construct used in generating elavl3 KO locus by homologous recombination. (B) The expression of Elavl3 protein is abolished in Elavl3-/- brain tissue (P21 WT, heterozygote and KO mice (littermates), as indicated). The lower heavy band corresponds to Elavl3, upper bands represent Elavl2 and Elavl4. Results from P21 WT, Elavl3+/- and Elavl3-/- mice were repeated in 3 independent litters. (C) Rotarod or hotplate testing of cerebellar or sensory physiology in Elavl3+/- or -/- littermates, as indicated; second until falling off the rod or tail twitch are shown. Rotarod testing was done with 6~8 week-old males (n=3; p < 0.0001), and hotplate testing was done with 7~9 week-old males (n=3, p = 0.11). (D-E) IF microscopy of Elavl3-/- mice compared to WT (+/+) littermate controls. A pan anti-nElavl antibody (α-nElavl) was used for IF, and contrasted with staining for the Purkinje neuronal marker Calbindin (D) or nuclei (DAPI, (E)). (E) Arrows point to nElavl immunostaining in WT and lack of it in Elavl3-/- DG.
We contrasted nElavl immunofluorescence remaining in Elavl3-/- mouse brain with previously characterized Elavl3 expression characterized by in situ hybridization (Okano and Darnell, 1997). In particular, we had previously noticed that several neuronal types showed nearly exclusive expression of Elavl3 among all nElavl isoforms, including cerebellar Purkinje neurons and hippocampal dentate gyrus (DG) neurons. Immunofluorescence microscopy using a pan-nElavl antibody revealed the absence of detectable remaining nElavl protein in both Purkinje and DG neurons in the Elavl3-/- brain (Fig.1D and E), consistent with Elavl3 being the sole nElavl protein in these neurons.
Given that all nElavl expression was eliminated in Elavl3-/- Purkinje neurons, we decided to analyze cerebellar function in these mice by rotarod assay. This behavioral assay is widely used to evaluate cerebellar dysfunction, however other explanations to reduced time on rotating rod are potentially possible. Young adult Elavl3-/- mice showed significant defects in this assay (p=0.001) relative to heterozygous littermates (Fig.1C). In order to exclude a generalized synaptic dysfunction in these mice, we measured time to tail-twitch on hotplate testing as a measure of sensory function and observed no difference in either genotype, consistent with the observation that Elavl2, 3 and 4 are all robustly expressed in dorsal root ganglia (Okano and Darnell, 1997). Taken together, these observations suggest that there are subsets of neurons that are particularly vulnerable to the loss of Elavl3, while others are relatively resistant, consistent with the expression patterns of the individual family members and functional redundancy among nElavl proteins. We also did not detect any gross anatomical defects in the Elavl3-/- brain that could have potentially caused non-specific phenotypic effects (data not shown).
Whole genome high-throughput sequencing of nElavl-bound RNA
In order to purify target RNA molecules to which nElavl proteins are directly bound in vivo we carried out HITS-CLIP with three different anti-nElavl antisera (each of which was specific for the nElavl proteins; Fig. S1A). Six independent CLIP experiments using WT and four independent experiments using Elavl3-/- cortical tissue were completed (Fig.2A-D). As a negative control, immunoprecipitation was carried out using two different unrelated control antibodies that recognized cdr2/3 proteins (anti-Yo antisera). We also examined dependence on UV crosslinking by immunoprecipitating nElavl from non-crosslinked tissue. In both of these controls, no signal was detected after radio-labeling the immunoprecipitated RNA and analyzing the results by denaturing PAGE (Fig.2E).
Fig. 2. Isolation of nElavl-RNA complexes by CLIP.

(A) nElavl-RNA complexes from WT and Elavl3-/- forebrain tissue from mice at age P0 were UV-crosslinked and immunoprecipitated (by nElavl antibody1) using the CLIP method. Representative autoradiograms of [γ-32P]ATP 5’end labeled RNA molecules, run on a polyacrylamide gel and blotted onto nitrocellulose filter are shown. Overdigestion of the lysate with RNase A (1:100 dilution) resulted in approximately a 40 kDa band, corresponding to nElavl and associated RNA fragments that are protected. The size of nElavl-associated RNA was titrated by increasing dilutions of RNase A treatment. Stronger signal was detected in the WT lanes as opposed to Elavl3-/- lanes. The signal detected in the Elavl3-/- lanes are due to Elavl2/4 that are also immunoprecipitated by the same antibody. Hatched box marks the piece of membrane from which nElavl-associated RNA was isolated. (B, C and D) Line traces of nElavl-RNA membrane shown in (A) are plotted. Individual lanes are color-coded. (E) No signal was detected when two different control antibodies (anti-Yo autoantibodies) were used (lanes 1-4) or when UV-crosslinking was omitted (lanes 7-8). nElavl-RNA complexes have been immunoprecipitated using antibody2. See also Fig.S1 and Tables S1-3.
Out of 26,190,453 total reads, we obtained 11,966,926 reads that can be unambiguously mapped to unique loci of the reference genome (mm9) (Table S1). Further collapsing of potential PCR duplicates by identical genomic coordinates gave 822,933 unique reads (nElavl tags) belonging to 81,320 clusters (a group of two or more tags overlapping by at least one nt (nucleotide)). In order to determine a set of statistically significant reproducible clusters, for each cluster we calculated a biological complexity coefficient (BC), representing the number of independent experiments that contributed tags to the corresponding cluster, a chi-square score and a false discovery rate (Table S2). To assess differences in the specificity of three different nElavl antibodies, we determined correlation coefficients (R2) between individual experiments. A high correlation was evident in all pair-wise comparisons of antibodies and in comparison of clusters in WT and Elavl3-/- tissue when we calculated R2 coefficients based on number of tags per 3’UTRs of individual genes (Ab1-Ab1:0.83 (2 independent experiments), Ab1-Ab2:0.8, Ab1-Ab3:0.79, WT-Elavl3-/-:0.81). In contrast, comparison of nElavl clusters with those of another neuronally expressed RNA binding protein, Nova (Licatalosi et al., 2008), resulted in a R2 value of only 0.28, demonstrating the specificity and consistency of CLIP results using individual nElavl antibodies. We also calculated R2 values based on number of tags in individual clusters. Since this is a more stringent method of calculation in general we observed lower R2 values (Table S3). Nonetheless, a higher correlation between the three nElavl antibodies in comparison to nElavl and Nova tags was evident.
To gain insight into the potential functional roles nElavl proteins have in RNA regulation, we determined the location of nElavl clusters on target RNA molecules. Analysis of reproducible binding sites with no winnowing of data (all 81,468 clusters) demonstrated that the majority (68.3%) mapped to mRNA-encoding genes, while many (31.7%) mapped to intergenic regions, which may correspond to bona fide binding in unannotated RNAs or may represent biologic or experimental noise. To focus on highly reproducible mRNA clusters, we identified clusters that harbored CLIP tags from at least five out of six independent experiments (BC=5/6 or 6/6). Interestingly the vast majority of these reproducible clusters were in the 3’ UTR, with very few reproducible 5’ UTR clusters and relatively few intronic clusters. For example, among 747 clusters with BC≥5/6, 74% mapped to the 3’ UTR (including sequences within 10kB downstream of stop codons, which most likely correspond to unannotated 3’UTRs) (Licatalosi et al., 2008), while only 12% mapped to introns and only one mapped to the 5’ UTR (Fig.3A). A very similar distribution profile of clusters was evident in the results obtained from Elavl3-/- tissue. Taken together, our results suggest a possible role for nElavl proteins in the regulation of pre-mRNA, and also indicate that the greatest steady-state binding to defined sites is in neuronal 3’ UTRs.
Fig. 3. nElavl binds to U-rich sequences.

(A) Distribution of nElavl tag clusters generated from 6 independent WT tissue samples is plotted as a function of biologic complexity. (B-C) Cluster sequences with either FDR<0.01 (B) or BC>=1. (C) were used to predict nElavl binding motif by MEME-CHIP tool. (D) Top ten most frequent hexamers found in nElavl clusters (FDR<0.01). See also Tables S4-6.
In order to gain insight into Elavl3 only clusters and hence Elavl3-dependent biological functions we subtracted clusters obtained using Elavl3-/- tissue from WT clusters. The subtracted dataset (presumably representing Elavl3 only clusters) as well as the WT dataset were most significantly enriched in genes regulating synaptic function, postsynaptic membrane, neuronal transmission and glutamate receptor activity. The Elavl3-/- dataset (presumably representing Elavl2/4 only clusters) was most significantly enriched in genes regulating neuronal projections, dendrites and axons. This set was also enriched in genes that regulate RNA binding, a feature that we did not observe in the subtracted dataset. These data suggest that synaptic function might be preferentially regulated by Elavl3 as opposed to Elavl2 or 4 (Table S4).
We determined the consensus nucleotide sequence preference of nElavl binding to target RNA from our CLIP data. The nucleotide sequences of 238 most robust cluster sites (FDR<0.01) were analyzed by MEME-CHIP tool designed for generating consensus motifs using large datasets (Bailey and Elkan, 1994). The most frequent (159/238) and significant (E-value:14e-106) motif was a 15-nt long sequence enriched in U nucleotides (Fig.3B). We also analyzed the sequence preference of all clusters (BC≥1) representing a larger dataset with lower confidence and similarly observed a U-rich motif with a secondary preference for G nucleotides (Fig.3C).
Next we analyzed the frequency of all possible hexameric sequences within the robust clusters (FDR<0.01 or BC≥5). We carried our analysis in different subsets of clusters depending on where the clusters were located on individual transcripts (i.e. 3’UTRs, 5’UTRs, coding regions or introns) to determine whether there were different sequence preferences for nElavl-binding to different locations on a pre-mRNA. In all subsets, we observed a general trend where the majority of hexamers among the most frequently identified, consisted of a stretch of pure U residues (28% of top ten most frequent hexameric sequences identified in clusters with FDR<0.01) or a U stretch embedded mostly with a single G (41%) and to a lesser extent a single A nucleotide (31%), (Fig. 3D). Often we observed a stretch of A residues in the top ten most frequent hexameric sequences, which we consider represents an artifact of sequencing and were removed from further analysis (Table S5).
These results were somewhat unexpected, as the nElavl proteins were originally suggested to bind more specifically to AU-rich elements in vitro or in tissue culture cells (Table S6), while GU-rich elements were ~1.3 fold more abundant that AU-rich elements in nElavl binding clusters. We therefore compared the CLIP results with in vitro RNA selection undertaken with the nElavl proteins. Recombinant histidine-tagged Elavl2, 3 and 4 proteins were purified and used for in vitro RNA selection using column chromatography to select from a random library of 52nt RNAs (complexity 1015, as previously described in (Buckanovich and Darnell, 1997)). After seven rounds of in vitro selection, bound RNAs were sequenced, revealing a consensus in which nElavl bound U-rich stretches interspersed with purine residues, primarily G residues (Fig.4A). We confirmed that Elavl4 directly bound these RNAs with high affinity (Kd ~ 1.5-4.5 nM) by gel shift and filter binding assays (Fig.4B-C). Such concordance of in vitro RNA selection and in vivo CLIP data has also been seen in comparison of Nova CLIP and RNA selection data (Zhang et al., 2010), and suggests that nElavl proteins function in vivo by binding to clustered U-rich sequences, with interspersed purine residues (G>A).
Figure 4. In vitro selection of nElavl binding RNA molecules.

(A) Representative results from in vitro RNA selection with the nElavl proteins. RNA selection was carried out using the Elavl2, Elavl3 or Elavl4 proteins for 6-8 rounds of selection (R6-R8, as indicated). Consensus GU rich elements are shown in blue and below the diagram. (B) RNA gel-shift assay, in which DR8-9 clone RNA selected by Elavl4 was incubated with recombinant Elavl4 as indicated. Multiple forms of Elavl4/RNA complexes (arrows) have slower migration profiles with increasing amounts of protein (RNA=50 fmol/lane, Protein=0, 25, 50 or 75 ng), and this effect is specific, as no effect on RNA mobility was seen with either hnRNP A1 (25 ng), or when Elavl4 was incubated with an irrelevant control RNA (SB2, a 52 base NOVA1 consensus sequence). (C) Results of filter binding assays in which the indicated amounts of Elavl4 fusion protein were incubated with radiolabeled selected RNA (where the number of GUUGU repeats (n) is shown, see (A)). Red: DR8-2 RNA; Blue: DR8-15 RNA; Green: DR7-5 RNA; Black: control SB2 RNA (50 fmol/reaction). Estimated kD’s are shown.
Analysis of nElavl-dependent alternative splicing in the brain
The finding that nElavl binds to specific intronic sequences suggested that the proteins might have roles in neuronal alternative splicing. To investigate this possibility a whole genome analysis of alternative splicing was undertaken. Given evidence of nElavl functional redundancy among nElavl paralogs, and previous findings of quantitatively larger (albeit qualitatively similar) splicing defects in Nova1/2 DKO pups (Ule et al., 2006) relative to single Nova-null mice (Ule et al., 2005b), we generated Elavl3-/-;Elavl4-/- DKO mice for splicing analyses (Akamatsu et al., 2005). These mice were born alive and were initially indistinguishable from WT littermates, but died several hours after birth. Elavl3 is the major nElavl homolog expressed in the cortex at age P0 and deletion of Elavl3 and Elavl4 together results in loss of approximately 65% of total nElavl proteins in the cortex (Fig.S1B). Since Elavl3/4 DKO pups die at P0, this time point was chosen for analysis of splice isoforms of RNA transcripts. Further, at time P0 nElavl protein levels are very close to the peak expression observed at P7 in the cortex (Fig.S1C).
Total RNA samples isolated from Elavl3-/-;Elavl4-/- DKO and WT cortex at age P0 was profiled by exon junction microarrays. Results were analyzed using an updated version of the ASPIRE algorithm that identifies reciprocal changes in exon-excluded versus exon-included mRNA isoforms (Licatalosi et al., 2008; Ule et al., 2005b). These analyses identified 227 alternative exons with significant splicing changes (according to a modified t-test, |ΔIrank|>10.0; see Methods). RT-PCR was used to test and validate 15 out of 17 of these alternative splicing events with |ΔI| values (the absolute value of the change in fraction of alternative exon usage) higher than 0.15. We additionally screened 36 more targets with lower |ΔI| values and validated an additional 22 targets. In total 37 targets were verified with experimentally validated |ΔI| values between 0.05 and 0.44 (Table1 and S7), (Ule et al., 2005b). Among these, 24 validated AS events displayed increased exon exclusion and 13 displayed increased exon inclusion in Elavl3-/-;Elavl4-/- mouse cortex. Within the validated AS events we observed predominantly cassette-type alternative exon usage, as well as alternative 5’ and 3’ splice site choice, mutually exclusive exon usage and other complex patterns of alternative splicing (Table1 and S7). Although quantitatively smaller, a large fraction of these alternatively spliced exons also exhibited changes in relative isoform abundance in single Elavl3 KOs but not in single Elavl4 KOs (Table S7).
Table 1. List of all verified Elavl3/4-dependent alternative exons.
37 Elavl3/4-dependent alternative exons were experimentally verified by RT-PCR. ΔI values obtained from splicing microarray analysis and RT-PCR experiments are presented. A positive ΔI value is associated with a higher fraction of exon-included isoform in WT compared to DKO samples.
| Gene Symbol | Transcript level change | Alt exon coordinates (mm9) | Alt Splicing Event | ΔI (Microrray) | ΔI (RT-PCR) |
|---|---|---|---|---|---|
| Clip1 | 1.01 | chr5:124077303-124077419 | cassette/complex | -0.3 | -0.44 |
| Camta1 | 1.14 | chr4:151166528-151166611 | intron retention | -0.38 | -0.39 |
| Grip1 | 0.98 | chr10:119422530-119422685 | cassette | -0.27 | -0.35 |
| Gls | 1.21 | chr1:52244638-52244697 | alt 3’exon | -0.03 | -0.3 |
| Ogt | 0.92 | chrX:98838315-98838345 | alt 3’ss | -0.23 | -0.3 |
| Mapk9 | 1.08 | chr11:49687766-49687837 | mut ex | -0.14 | -0.27 |
| Robo2 | 0.95 | chr16:74009020-74009031 | cassette | -0.22 | -0.23 |
| 2410002 O22Rik | 0.91 | chr13:104942245-104942262 | cassette | -0.28 | -0.22 |
| Uevld | 1.35 | chr7:54190253-54190410 | cassette | -0.16 | -0.2 |
| Rapgef6 | 1.03 | chr11:54507772-54508074 | cassette | -0.12 | -0.19 |
| Sult4a1 | 1.12 | chr15:83909199-83909327 | cassette | -0.2 | -0.18 |
| Lrch3 | 0.99 | chr16:32995892-32995999 | cassette | -0.22 | -0.18 |
| Q8BLQ9-2 | 0.96 | chr16:66731630-66731749 | cassette | -0.29 | -0.18 |
| Dst | 1.11 | chr1:34306649-34306975 | cassette | -0.15 | -0.18 |
| Vps29 | 1.04 | chr5:122806803-122806814 | cassette | -0.19 | -0.17 |
| Epb4.1 | 0.92 | chr4:131518839-131518901 | cassette/complex | -0.13 | -0.17 |
| Dhdds | 0.95 | chr4:133556254-133556308 | alt 3’ ss | -0.17 | -0.15 |
| Abi1 | 1.06 | chr2:22809128-22809131 | alt 3’ss | -0.09 | -0.13 |
| Macf1 | 1.05 | chr4:123074337-123074663 | cassette | -0.13 | -0.11 |
| Ank3 | 0.97 | chr10:69416188-69416220 | cassette | -0.07 | -0.11 |
| Rod1 | 1.02 | chr4:59559021-59559054 | cassette | -0.09 | -0.08 |
| Cadm3 | 1.13 | chr1:175279153-175279254 | cassette | -0.07 | -0.06 |
| Mdm2 | 0.96 | chr10:117146774-117146840 | cassette | -0.1 | -0.06 |
| 2210010B 09Rik | 1.05 | chr9:20393901-20394002 | cassette | 0.1 | 0.05 |
| Cugbp2 | 0.97 | chr2:6528928-6529007 | cassette | 0.08 | 0.06 |
| Thyn1 | 0.93 | chr9:26814386-26814536 | cassette | 0.14 | 0.06 |
| Cldnd1 | 1.1 | chr16:58729293-58729336 | cassette | 0.09 | 0.07 |
| Nrxn1 | 1.06 | chr17:91101328-91101351 | cassette | 0.06 | 0.09 |
| Cltb | 1.02 | chr13:54698387-54698440 | cassette | 0.08 | 0.09 |
| Ank2 | 1.04 | chr3:126666301-126666399 | cassette | 0.09 | 0.11 |
| Elavl2 | 0.86 | chr4:90920832-90920870 | cassette | 0.06 | 0.12 |
| Ap1gbp1 | 0.97 | chr11:83853158-83853193 | cassette | 0.07 | 0.13 |
| Kif2a | 1.06 | chr13:107759784-107759897 | cassette | 0.16 | 0.2 |
| Snap25 | 1.07 | chr2:136595479-136595596 | mut ex | 0.14 | 0.21 |
| Mapk9 | 1.08 | chr11:49687338-49687409 | mut ex | 0.13 | 0.27 |
| Plekha5 | 0.84 | chr6:140528868-140529056 | cassette | 0.25 | 0.28 |
| Rufy2 | 1.29 | chr10:62465694-62467405 | alt 3’exon | 0.32 | 0.37 |
Abbreviations: mut ex: mutually exclusive; alt 3’ exon: alternative 3’ exon; alt 3’ss: alternative 3’ splice site. See also Table S7.
Generation of nElavl-RNA regulatory map
The finding that some exons are mis-regulated in Elavl3-/-;Elavl4-/- brain suggests that the nElavl proteins might be regulating splicing directly. To examine whether this was the case, and whether the position of nElavl binding also might determine the outcome of splicing, we overlaid a nElavl binding map on the set of Elavl3/4 regulated cassette exons. We analyzed 59 cassette-type alternative exons that were either validated by RT-PCR or predicted based on a t-test ranking of Aspire2 analysis (|ΔIrank|>10, Table S8). Nine of these transcripts had zero tags in the alternative exons and the flanking regions and were excluded from further analysis as they might represent indirect effects or limited coverage of our CLIP data, since we do not believe that we have fully saturated nElavl binding sites in our HITS-CLIP dataset. A total of 436 tags from the remaining 50 alternative exons were overlaid onto a composite pre-mRNA to generate a functional nElavl binding/splicing map (Fig.5A and Table S8). This map revealed that in a majority of cases nElavl binding sites were present in introns flanking the alternative exons and were most concentrated at exon/intron splice junctions.
Fig. 5. Normalized complexity map for nElavl-dependent alternative splicing.

(A) nElavl tags mapping to nElavl-regulated cassette exons or flanking introns are plotted onto a composite transcript as a function of distance to the 5’ or 3’ junctions of the alternative exon. Tags from independent CLIP experiments are color-coded. Red and grey boxes represent a generic alternative cassette exon and flanking constitutive exons, respectively. (B) Normalized complexity map of nElavl-dependent alternative splicing of cassette exons. Red and blue peaks represent binding associated with nElavl-dependent exon inclusion and exclusion, respectively. Motif preferences of 250 nt sequences flanking nElavl-regulated alternative exons are shown. (C) Motif preferences of 250 nt sequences flanking randomly selected alternative exons that display no change in isoform abundance in DKO mice are shown. See also Fig.S2 and Table S8.
In order to identify those binding sites that are most relevant to the alternative splicing events, a normalized complexity map representative of common nElavl binding regions in different pre-mRNAs was generated (Fig.5B), using strategies previously established for the neuronal splicing factor Nova (Licatalosi et al., 2008). The number of total nElavl-binding sites in 50 nt windows spanning a 12 kb region was normalized to the number of different transcripts displaying nElavl-binding in each window, to the number of total nElavl tags in individual pre-mRNAs and also to the number of independent experiments (biologic complexity) in which the tags in each cluster were identified. The results of this map revealed preferential nElavl binding to the 5’ splice site of the downstream intron in cassette exons where nElavl promotes inclusion and to the immediate 3’ and 5’ splice sites in those exons where nElavl promotes exclusion (Fig.5B). Furthermore, we observed a strong preference for U-rich sequences in flanking regions of nElavl-dependent exons and GC-rich sequences that were poor in U residues in flanking regions of nElavl-independent exons (Fig.5B and 5C). This data suggests that nElavl proteins preferentially regulate the alternative splicing of a specific subset of exons flanked by U-rich sequence motifs. Using the same dataset we also mapped tag locations in individual nElavl pre-mRNA targets and consistently observed intronic binding within 250 nts of the exon/intron junctions in the flanking introns in nElavl suppressed and promoted alternative exons, respectively (Fig.S2A). Taken together, our nElavl RNA map suggests a position-dependent splicing code for nElavl-regulated alternative cassette exon usage that is consistent with previously reported splicing factors.
Gene Ontology analysis of nElavl splicing targets
To address the biological processes encoded by transcripts whose alternative splicing was regulated by nElavl, we carried out enrichment analysis for gene ontology (GO) categories on those transcripts that are nElavl-regulated at the alternative splicing level. For GO analysis the top 212 most significant target transcripts from our Aspire2 analysis results were used and compared to all genes expressed in WT brain (Table S10). These target alternative exon included not just cassette exons but also other modes of alternative splicing events regulated by nElavl. The nElavl-regulated transcripts that were the most significantly enriched overall encoded proteins involved in the regulation of protein complex and cytoskeleton dynamics, in particular microtubule polymerization and depolymerization activity at the synapse and axon (Table S11). For example, the top 10 enriched terms in biologic process (enriched 10-25 fold) all related to microtubule assembly/disassembly, in cellular component (enriched 1.9-22 fold, median 3.8) related to the synaptic cytoskeleton, and in molecular function primarily related to regulation of microtubules and small GTPase mediated signaling (enriched 2.1-37 fold, median 2.9).
A direct role for nElavl proteins in 3’ UTR regulation
The majority (63.5%) of robust nElavl binding sites (BC=6) from HITS-CLIP data mapped onto 3’UTRs, suggesting that nElavl might have roles in the brain besides regulation of alternative splicing, such as maintenance of steady state mRNA levels. We investigated this possibility by first comparing total transcript levels in cortical tissue from WT and Elavl3-/-;Elavl4-/- brains using Affymetrix exon microarrays. 119 transcripts displayed significant changes in steady-state levels in DKO brain (two-tailed t-test, p-value<0.01), with 89 transcripts decreased and 30 increased (Table S9).
To assess which of these transcripts might be directly regulated by nElavl binding in the 3’ UTR, we assessed which had nElavl HITS-CLIP 3’ UTR binding sites. Those transcripts whose abundance changed in DKO tissue had significantly more nElavl HITS-CLIP tags when compared to all expressed transcripts whose steady state levels were unaffected (p=0.0037 by Wilcoxon rank sum test), (Fig.S3). More specifically, we identified nElavl binding sites in 24 of the 89 transcripts whose abundance was decreased in DKO (Table S9).
A new role for nElavl in regulating glutamate in the brain
GO analysis of the 119 transcripts whose steady-state was regulated by nElavl revealed a very different set of biologic processes than those encoded by transcripts whose splicing was regulated by nElavl. Transcripts whose steady-state levels were nElavl-regulated were enriched for genes regulating amino acid and sugar biosynthetic pathways (Table S11). Interestingly, the glutamine amino acid biosynthetic pathway was an outlier among GO biologic process enriched in nElavl-regulated steady-state transcripts (39-fold enrichment, p<0.002). The genes in this pathway encode proteins catalyzing reactions that result in the formation of amino acids of the glutamine family, comprising glutamate, arginine, glutamine and proline. Glutamate is the major excitatory neurotransmitter and also the biochemical precursor for the major inhibitory neurotransmitter GABA in the mammalian forebrain (Martin and Rimvall, 1993).
The marked enrichment for nElavl regulation of steady state mRNAs encoding the glutamine amino acid biosynthetic pathway prompted us to examine whether nElavl played a role in regulated glutamine synthesis in neurons. Measurement of total glutamate levels in extracts of cortical tissue from Elavl3-/-;Elavl4-/- mice revealed approximately 50% reduction compared to WT littermates (Fig.6F).
Fig. 6. nElavl-dependent regulation of the brain enzyme glutaminase.

(A) The two mRNA isoforms of the glutaminase gene (Gls) and nElavl binding sites are shown. Individual colors depict different experiments. Alternative use of a 3’ splice site generates two Gls isoforms with different 3’ terminal coding sequences and 3’ UTRs. Gls-s and Gls-l refer to short and long isoforms, respectively. (B) RT-PCR amplification of the two Gls isoforms in WT and Elavl3-/-;Elavl4-/- cortex of age P0 mice. (C) Western blot analysis of the two Gls isoforms in littermate WT and Elavl3-/-;Elavl4-/- cortex of age P0 mice. Each lane represents an independent mouse. (D) Q-PCR quantification of the abundance of two Gls mRNA isoforms in littermate WT and Elavl3-/-;Elavl4-/- cortex of age P0 mice. (E) Quantification of data shown in panel (C). (F) Quantification of total glutamate levels in cortex of 3 WT and 3 Elavl3-/-;Elavl4-/- littermate age P0 mice are presented. Glutamate levels in WT samples are normalized to 100% in the Y-axis. * denotes p<0.01 (t-test). Error bars denote standard deviation. See also Fig.S3-4 and Table S9.
The majority (70%) of neuronal glutamate is believed to be synthesized within neurons by glutaminase enzyme (encoded by Gls1/Gls gene) (Hertz and Zielke, 2004). Alternative usage of a 3’ exon during Gls1 pre-mRNA splicing results in the generation of two separate transcripts with different 3’ coding and UTR sequences, encoding for proteins harboring a short and a long C-terminal domain that we term Gls1-s and Gls1-l, respectively (Fig.6A). Interestingly, analysis of nElavl HITS-CLIP tags revealed nElavl binding sites on intronic sequences flanking the regulated alternative splice site, suggesting that nElavl might promote the alternative use of the isoform Gls1-l by binding to intronic regulatory sequences. We also observed that nElavl binds to the 3’UTR sequences of both isoforms (Fig.6A and S4). Thus, nElavl has the potential to regulate Gls1 isoform levels both at the AS and at the transcript abundance level.
The AS event generating the Gls-l and Gls-s isoforms was listed as a top target in our Aspire2 AS analysis, with a validated ΔI of -0.3. (Fig.6B). Quantitative RT-PCR using primers specific for each Gls isoform demonstrated that in Elavl3-/-;Elavl4-/- DKO brain, abundance of the Gls1-s isoform did not change while abundance of the Gls1-l isoform was reduced to approximately 50% of the WT levels (Fig.6D). Western blot analysis using an antibody recognizing a common epitope to both isoforms also demonstrated that the abundance of Gls1-s and Gls1-l proteins were reduced to 60% and 25% of the WT levels, respectively (Fig.6C and 6E). Since Elavl3/4 DKO die at age P0 it is difficult to further carry out any physiological analyses. We assessed whether Elavl3-/- single KO mice also exhibited a defect in glutamate regulation and observed a smaller but significant decrease in total glutamate levels and in Gls-l, but not Gls-s, protein levels (Figure S5). These results point to a role for nElavl proteins in directly controlling Gls1-s and Gls1-l levels in the nervous system through reinforcing mechanisms of involving both the regulation of AS and mRNA half-life, consistent with nElavl HITS-CLIP results demonstrating direct binding to both intronic and 3’ UTR elements.
Seizures in Elavl3-/- Mice
To assess whether there might be a physiologic correlate of excitation/inhibition imbalance manifested by misregulation of glutamate signaling in Elavl3-/- mice, we undertook an EEG analysis of cortical function. Video EEG monitoring of awake and behaving mutants revealed a striking pattern of abnormal cortical hypersynchronization in both Elavl3+/- and Elavl3-/- mice never seen in WT mice (Fig. 7A, Movie S1). In Elavl3+/- mice, there was a nearly continuous presence (1-9/min) of bilaterally synchronous sharp cortical spike discharges, sometimes accompanied by brief afterdischarges (Fig.7B). Elavl3-/- mice displayed similar discharges as well as more severe, non-convulsive electrographic seizures lasting from 10-30 secs (Fig.7C). Both patterns demonstrate aberrant hypersynchronization in cortical networks.
Fig. 7. EEG Analysis of cortical function in Elavl3-/- mice.
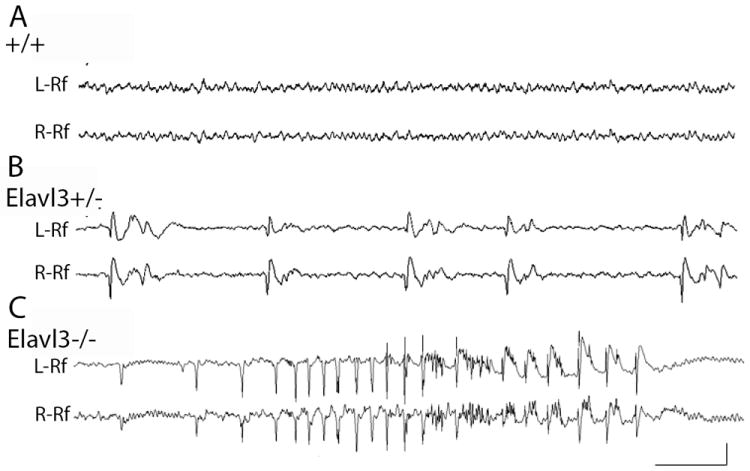
Spontaneous bilateral EEG activity recorded from awake and behaving 3-6 month old adult (A) WT, (B) Elavl3+/-, and (C) Elavl3-/- mice. Cortical recordings are displayed from left (L-reference) and right (R-reference) hemisphere temporoparietal electrodes. WT mice lack abnormal discharges seen occurring intermittently in Elavl3+/- and Elavl3-/- mice. Brief seizures shown in Elavl3-/- mice are accompanied by mild convulsive clonic movements. Seizures were detected in both Elavl3-/- and -/+ mice. Calibration, 1 sec (A and C, 0.5 sec in B), 200 microvolts (A-C). See also Fig.S5-6, Tables S10-11 and Movie S1.
Discussion
Until recently studies aimed at identifying regulatory RNA sequences have been limited to correlative information lacking direct functional links to biological processes. HITS-CLIP technique provides a methodology to identify such functional RNA-protein interaction sites and has been successfully applied to identifying binding sites and uncovering new biological functions for several RNABPs, including Nova (Licatalosi et al., 2008), PTB (Xue et al., 2009), hnRNP C (Konig et al., 2010), TIA-1 (Wang et al., 2010b), TDP-43 and Fox2 (Yeo et al., 2009).
In the present study we carried out unbiased genome-wide nElavl HITS-CLIP experiments in combination with microarray analysis using nElavl KO tissue and in vitro binding assays to identify functional interaction sites between neuronal nElavl RNABPs and target RNA sequences. Our results demonstrate that nElavl RNABPs preferentially bind to U-rich sequences interspersed with G-residues located on 3’UTRs and introns of target pre-mRNAs in the brain, which, taken together with previous studies, indicates two apparently independent functions of nElavl-RNA interactions. Specifically, we demonstrate that nElavl proteins bind to intronic sequences at flanking junctions of alternative exons on target pre-mRNAs, revealing an nElavl-RNA map associated with nElavl-dependent alternative splicing. We also find that by binding to 3’UTRs nElavl proteins regulate the steady state levels of distinct group of mRNAs. Interestingly, the observation of coordinate and mutually reinforcing actions of nElavl proteins on Gls-1 RNA suggest that these actions can be functionally inter-related.
Nonetheless, analysis of the set of directly regulated transcripts suggests that nElavl proteins generally mediate different functional roles in different regulatory contexts. Transcripts regulated at the level of AS encode proteins involved in regulating cytoskeleton dynamics, particularly in synapses, while those regulated by 3’ UTR binding encode a markedly different set of proteins involved in regulating basic biosynthetic pathways. This may make some evolutionary sense, as regulating alternative exon content alters the quality of proteins, while 3’ UTR regulation alters their quantity, two very different outcomes under different sets of selective pressures. It will be of interest to determine whether such variable patterns of coordinate regulation are evident in the analysis of the direct targets of additional RNABPs.
To date, targets of nElavl proteins have been studied mainly using three approaches: in vitro RNA selection, relatively low-stringency immunoprecipitation of nElavl-RNA complexes (“RIP”) from cell lines followed by cDNA array hybridization of precipitated RNA and the study of candidate genes based on the presence of in vitro binding elements in their 3’UTRs in cultured cell lines. We compiled a list of 134 published targets of nElavl, which are largely identified bioinformatically and validated in vitro (Table S6). While these studies have led to determination of nElavl target sequence specificity and of numerous target mRNAs, whether they reflect nElavl-RNA interactions present in vivo in brain tissue has been uncertain. For example, a large number of RNA selection and in vitro binding studies report that nElavl proteins bind to AU-rich elements (Table S6). In vivo, we find that nElavl prefers to bind to related but distinct sites in the brain, consisting of U-rich stretches approximately 15-20 nts long interspersed with G residues. The nElavl binding motif we determine is in agreement with our independent in vitro RNA selection analysis, and with two immunoprecipitation and cDNA array studies where the binding preference for Elavl4 and the non-neuronally expressed Elavl1 paralog is reported as a GU rich stretch and a 20-nt long RNA motif rich in uracils, respectively (Bolognani et al., 2010; Lopez de Silanes et al., 2004). These results reveal the utility of in vivo HITS-CLIP as a means of clarifying in vitro studies of RNA-protein interactions, which here initially led to the skewed perception that nElavl proteins bind only to ARE elements (Table S6). We find that nElavl proteins in fact bind GU-rich elements relative to ARE elements by ~1.3-fold, and that it does so in clusters, analogous to the way in which Nova proteins recognize specific targets by binding clusters of low complexity YCAY elements (Licatalosi et al., 2008; Zhang et al., 2010).
nElav regulation of alternative splicing
Previous studies in Drosophila have indicated that nElavl proteins are able to regulate alternative splicing (Koushika et al., 2000; Lisbin et al., 2001; Soller and White, 2003, 2005). Prior studies of mammalian nElavl splicing regulation has been less clear, as neither comparisons in genetically modified animals nor direct RNA binding assays have been previously employed. Here we combined nElavl-RNA direct binding data with bioinformatics and exon junction array data comparing splicing in WT and KO animals to identify a definitive set of brain transcripts directly regulated by nElavl proteins in vivo. The results demonstrate that nElavl proteins directly bind neuronal pre-mRNA to regulate alternative splicing, and that the proteins have redundant actions in this regard, as splicing changes were uniformly more pronounced in DKO than Elavl3 or Elavl4 single KO brain.
Our nElavl-RNA map is reminiscent of the position-dependence of splicing regulation observed for Nova, Fox2, hnRNP C, hnRNPL, TIA1/2, TDP-43, MBNL, PTBP1 and PTBP2 and generally conforms to the finding that preferential binding to downstream introns leads to exon inclusion, and to upstream introns exon exclusion (Licatalosi et al., 2008; Licatalosi et al., 2012; Llorian et al., 2010; Tollervey et al., 2011; Ule and Darnell, 2006; Yeo et al., 2009; Zhang et al., 2008). nElavl-mediated exon exclusion may be more frequently associated with binding to both upstream and downstream introns, a characteristic also noted for TDP-43 associated alternative splicing. As was also seen in the TDP-43 associated alternative splicing RNA-map, nElavl binding was observed in deeper intronic sequences of a small number of cassette exons. Our nElavl-RNA map is also in agreement with several candidate target gene studies examining the role of nElavl proteins in AS. For example, it was recently demonstrated that Elavl3 promotes inclusion of the alternatively spliced exon 6 of the Elavl4 gene by binding to U-rich sequences located in the intron downstream to the alternative exon (Wang et al., 2010a). Also, nElavl proteins suppress alternative exon 23a inclusion in the Neurofilament1 (NF1) pre-mRNA by binding to U-rich intronic sequences on either intronic flanks of the cassette exon (Zhu et al., 2008). Our HITS-CLIP data indeed confirmed binding to two of the three nElavl target sequences reported in these studies (Fig. S2B).
nElav regulation of neuronal excitability
Our analysis of nElavl RNA targets revealed a reduction in levels of glutamate neurotransmitter in the brains of Elavl3-/-;Elavl4-/- mice which corresponded to a decrease in Gls1 mRNA and protein levels. Currently we do not exactly understand the mechanistic details of how nElavl proteins regulate the AS and mRNA stability of Gls1 mRNA isoforms. While mechanisms of post-transcriptional regulation of Gls-s and Gls-l mRNA are largely unknown in neurons, an mRNA stabilizing role for Elavl1 (HuA/R) binding to an AU-rich pH-responsive element located in the 3’UTR of Gls-l during metabolic acidosis in kidney cells is demonstrated (Ibrahim et al., 2008). It is also likely that nElavl proteins enhance the translation of at least the Gls-s isoform, since its mRNA levels are unaffected but proteins levels are significantly reduced in the Elavl3-/-;Elavl4-/- brain tissue. The Gls1 is the major glutamate synthesizing enzyme in neurons. Elavl3-/-;Elavl4-/- mice display some similarity to Gls1-/- mice, as both appear and behave normally at birth but die suddenly thereafter; in Gls1-/- mice early postnatal death has been attributed to a deficiency in brain circuits controlling respiration (Masson et al., 2006). Glutamate is the major excitatory neurotransmitter and impacts inhibitory signaling in two ways: it is both the biochemical precursor for the major inhibitory neurotransmitter GABA in the mammalian forebrain (Martin and Rimvall, 1993), and synoptically activates inhibitory neuronal feedback loops (McBain and Fisahn, 2001). While the molecular lesion due to aberrant AS in this model is complex, imbalance of these key mediators of fast synaptic signaling in the Elavl3-/- brain is a well established mechanism for neuronal hypersynchrony and epilepsy (Noebels, 2003). The finding of abnormal hypersynchronization in both Elavl3 +/- and -/- mice suggests that fine tuning of the stoichiometry of individual RNA isoforms can regulate cortical excitability and synchronization.
On the behavioral level, we observe attenuation of cerebellum-dependent motor function based on reduced rotarod assay performance in Elavl3-/- mice. Whether or not this behavioral defect results from reduced glutamatergic signaling and an imbalance in excitation/inhibition in the cerebellum are of great interest as future research questions.
Gls1 mRNA is alternatively spliced to generate two mRNA and protein isoforms, and the longer Gls1-l isoform is dramatically reduced in both mRNA and protein levels in Elavl3-/-;Elavl4-/- brain. Gls1-s and Gls1-l genes differ in their 3’UTR sequences and also C-terminal domains of their protein products. Both protein isoforms encode a glutaminase superfamily domain involved in deamination of glutamine to glutamate. Interestingly, four ankyrin repeat domains are present C-terminal to the glutaminase superfamily domain in Gls1-l but not in the Gls1-s isoforms. We suggest that nElavl regulates the protein interacting partners of this critical enzyme by maintaining a balance between the isoforms of the Gls1 gene.
Taken together, we establish nElavl proteins as regulators of neuron-specific AS, determine an nElavl-RNA map associated with alternative splicing and uncover a new nElavl-regulated biological pathway, namely the glutamate synthesis pathway. By investigating other nElavl targets our dataset also offers the possibility of identifying other interesting functions of these neuronal proteins.
Methods
Generation of Elav3 targeting construct for homologous recombination
A 17.7kb targeting vector (see Suppl methods) was selected in SV-129 ES cells, transferred into the germline of SV129/FVB mice, and the ACNF targeting cassette auto-excised in the male germ cells.
Western blot, Immunofluorescence microscopy and antibodies
Western blots were performed using 50ug of cortex extract per lane. A pan anti-nElavl antibody (α-nElavl; paraneoplastic Hu antibody; RU IRB approved protocol 0148; patient code NA-0018, a 63 year old with small cell lung cancer and Hu encephalomyelopathy who had a pan-sensory neuropathy expired from prolonged status epilepticus) was used for IF.
nElavl HITS CLIP
nElavl-RNA complexes in brain tissue were UV crosslinked and immunoprecipitated using specific human antisera. Isolated RNA molecules were reverse-transcribed, PCR amplified and sequenced on an Illumina GAIIx at the Rockefeller University Genomics Resource Center (see Suppl. Material).
Microarrays
3.5 μg of total RNA from Elavl3-/-;Elavl4-/- and littermate WT P0 mice cortical tissue was reverse transcribed and sense target DNA was prepared as described in “GeneChip Whole-Transcript (WT) Sense Target Labeling Assay” protocol from Affymetrix. Labelled Target DNA was hybridized to GeneChip Mouse Exon 1.0 ST Array and to custom made Exon Junction Array (Affymetrix) at the Rockefeller University Genomics Resource Center.
RNA isolation and validation of nElavl targets by RT-PCR
RT-PCR was used to validate alternative splicing changes as described (Licatalosi et al., 2008; Ule et al., 2005b). P0 cortex was dissected and immediately frozen in -80°C. RNA was isolated using Trizol plus RNA purification kit (Invitrogen). RNA was reverse transcribed using superscript III reverse transcriptase (Invitrogen). Abundance of RNA isoforms were determined by semi-quantitative RT-PCR, or where indicated by quantitative PCR, respectively. The number of PCR cycles used was in the linear range of product amplification.
Measurement of brain glutaminase and glutamate levels
Rabbit anti-glutaminase antibody was courtesy of Norman Curthoys, Colorado State University. Cortex was dissected out at P0 and immediately frozen at -80°C. Tissue was then lysed in assay buffer for 10 min, spun down and supernatant was collected for measurements (Glutamate Assay Kit, Biovision). Glutamate levels were normalized to total protein levels as measured by Bradford assay.
Bioinformatics (see Suppl. Material)
Microarray Analysis: Mouse 1.0 ST exon array signals were analyzed using, Xray (Biotique), Expression Console (Affymetrix) software, Excel, and Filemaker Pro programs. Exon junction microarray signals were analyzed using Aspire2 (Ule et al., 2005b). nElavl HITS-CLIP Tag Sequence Analysis: Sequence reads (tags) were aligned to the mm9 build of the mouse genome. PCR duplicates were filtered out and unique tags were identified using the RefSeq reference database. Tag clusters were defined as at least two tags that have at least one overlapping base. Biologic complexity (BC) for a cluster was the number of independent CLIP experiments that have a tag in that cluster. nElavl Consensus Sequence Analysis: The MEME-CHIP Suite was used for all motif analyses (Bailey and Elkan, 1994). nElavl-RNA Alternative Splicing Map: The map was generated by calculating the distance of nElavl HITS-CLIP tags from exon/intron junctions of nElavl-regulated cassette exons and flanking constitutive exons. Normalized tag distances were mapped onto a composite nElavl AS map. Gene Ontology Analysis: Top 119 transcripts (p<0.01) obtained from analysis of Gene Chip Mouse Exon 1.0 ST Array and top 212 transcripts (dI-rank>|10|) obtained from analysis of Exon Junction Microarray Aspire2 results were used. Those transcripts whose abundance was above an expression level cutoff as determined by signal intensity from Mouse Exon 1.0ST Array results of WT samples were used as the background gene list. All GO analysis was done using DAVID Bioinformatics Resources 6.7 (Huang da et al., 2009a, b).
Video Electroencephalographic (vEEG) Recordings
Adult Elavl3-/-, Elavl3+/-, and unaffected WT littermate mice (aged 3-6 months) were surgically implanted for chronic cortical electroencephalography. Mice were anesthetized with Avertin (1.25% tribromoethanol/amyl alcohol solution, i.p.) using a dose of 0.02 ml/g. Teflon-coated silver wire electrodes (0.005 inch diameter) soldered to a microminiature connector were implanted bilaterally into the subdural space over temporal, parietal, and occipital cortices. Digital EEG activity was monitored daily for up to two weeks during prolonged overnight and random 3 hr sample recordings (Stellate Systems, Harmonie software version 6.1c). A video camera was used to monitor behavior during the EEG recording periods. All recordings were carried out at least 24 hours after surgery on mice freely moving in the test cage.
Supplementary Material
Acknowledgments
We thank members of the Darnell laboratory for advice and suggestions throughout the course of this work, Melis Kayikci for ASPIRE2 Analysis and Norman Curthoys for the glutaminase antibody. We are grateful to sources of support to GI-D (Rockefeller University, Women and Science Postdoctoral Fellowship), JLN (NINDS NS 29709 and IDDRC HD24064), CZ (K99GM95713), RBD (NS34389) and the Rockefeller University Hospital CTSA (UL1 RR024143). RBD is an HHMI Investigator.
Footnotes
Publisher's Disclaimer: This is a PDF file of an unedited manuscript that has been accepted for publication. As a service to our customers we are providing this early version of the manuscript. The manuscript will undergo copyediting, typesetting, and review of the resulting proof before it is published in its final citable form. Please note that during the production process errors may be discovered which could affect the content, and all legal disclaimers that apply to the journal pertain.
References
- Akamatsu W, Fujihara H, Mitsuhashi T, Yano M, Shibata S, Hayakawa Y, Okano HJ, Sakakibara S, Takano H, Takano T, et al. The RNA-binding protein HuD regulates neuronal cell identity and maturation. Proc Natl Acad Sci U S A. 2005;102:4625–4630. doi: 10.1073/pnas.0407523102. [DOI] [PMC free article] [PubMed] [Google Scholar]
- Bailey TL, Elkan C. Fitting a mixture model by expectation maximization to discover motifs in biopolymers. Proc Int Conf Intell Syst Mol Biol. 1994;2:28–36. [PubMed] [Google Scholar]
- Barash Y, Calarco JA, Gao W, Pan Q, Wang X, Shai O, Blencowe BJ, Frey BJ. Deciphering the splicing code. Nature. 2010;465:53–59. doi: 10.1038/nature09000. [DOI] [PubMed] [Google Scholar]
- Bolognani F, Contente-Cuomo T, Perrone-Bizzozero NI. Novel recognition motifs and biological functions of the RNA-binding protein HuD revealed by genome-wide identification of its targets. Nucleic Acids Res. 2010;38:117–130. doi: 10.1093/nar/gkp863. [DOI] [PMC free article] [PubMed] [Google Scholar]
- Brennan CM, Steitz JA. HuR and mRNA stability. Cell Mol Life Sci. 2001;58:266–277. doi: 10.1007/PL00000854. [DOI] [PMC free article] [PubMed] [Google Scholar]
- Buckanovich RJ, Darnell RB. The neuronal RNA binding protein Nova-1 recognizes specific RNA targets in vitro and in vivo. Mol Cell Biol. 1997;17:3194–3201. doi: 10.1128/mcb.17.6.3194. [DOI] [PMC free article] [PubMed] [Google Scholar]
- Calarco JA, Zhen M, Blencowe BJ. Networking in a global world: establishing functional connections between neural splicing regulators and their target transcripts. RNA. 2011;17:775–791. doi: 10.1261/rna.2603911. [DOI] [PMC free article] [PubMed] [Google Scholar]
- Castle JC, Zhang C, Shah JK, Kulkarni AV, Kalsotra A, Cooper TA, Johnson JM. Expression of 24,426 human alternative splicing events and predicted cis regulation in 48 tissues and cell lines. Nat Genet. 2008;40:1416–1425. doi: 10.1038/ng.264. [DOI] [PMC free article] [PubMed] [Google Scholar]
- Darnell JC, Van Driesche SJ, Zhang C, Hung KY, Mele A, Fraser CE, Stone EF, Chen C, Fak JJ, Chi SW, et al. FMRP stalls ribosomal translocation on mRNAs linked to synaptic function and autism. Cell. 2011;146:247–261. doi: 10.1016/j.cell.2011.06.013. [DOI] [PMC free article] [PubMed] [Google Scholar]
- Darnell RB. HITS-CLIP: panoramic views of protein-RNA regulation in living cells. Wiley Interdiscip Rev RNA. 2010;1:266–286. doi: 10.1002/wrna.31. [DOI] [PMC free article] [PubMed] [Google Scholar]
- Das D, Clark TA, Schweitzer A, Yamamoto M, Marr H, Arribere J, Minovitsky S, Poliakov A, Dubchak I, Blume JE, et al. A correlation with exon expression approach to identify cis-regulatory elements for tissue-specific alternative splicing. Nucleic Acids Res. 2007;35:4845–4857. doi: 10.1093/nar/gkm485. [DOI] [PMC free article] [PubMed] [Google Scholar]
- Hertz L, Zielke HR. Astrocytic control of glutamatergic activity: astrocytes as stars of the show. Trends Neurosci. 2004;27:735–743. doi: 10.1016/j.tins.2004.10.008. [DOI] [PubMed] [Google Scholar]
- Hinman MN, Lou H. Diverse molecular functions of Hu proteins. Cell Mol Life Sci. 2008;65:3168–3181. doi: 10.1007/s00018-008-8252-6. [DOI] [PMC free article] [PubMed] [Google Scholar]
- Huang CS, Shi SH, Ule J, Ruggiu M, Barker LA, Darnell RB, Jan YN, Jan LY. Common molecular pathways mediate long-term potentiation of synaptic excitation and slow synaptic inhibition. Cell. 2005;123:105–118. doi: 10.1016/j.cell.2005.07.033. [DOI] [PubMed] [Google Scholar]
- Huang da W, Sherman BT, Lempicki RA. Bioinformatics enrichment tools: paths toward the comprehensive functional analysis of large gene lists. Nucleic Acids Res. 2009a;37:1–13. doi: 10.1093/nar/gkn923. [DOI] [PMC free article] [PubMed] [Google Scholar]
- Huang da W, Sherman BT, Lempicki RA. Systematic and integrative analysis of large gene lists using DAVID bioinformatics resources. Nat Protoc. 2009b;4:44–57. doi: 10.1038/nprot.2008.211. [DOI] [PubMed] [Google Scholar]
- Ibrahim H, Lee YJ, Curthoys NP. Renal response to metabolic acidosis: role of mRNA stabilization. Kidney Int. 2008;73:11–18. doi: 10.1038/sj.ki.5002581. [DOI] [PMC free article] [PubMed] [Google Scholar]
- Jensen KB, Darnell RB. CLIP: crosslinking and immunoprecipitation of in vivo RNA targets of RNA-binding proteins. Methods Mol Biol. 2008;488:85–98. doi: 10.1007/978-1-60327-475-3_6. [DOI] [PMC free article] [PubMed] [Google Scholar]
- Konig J, Zarnack K, Rot G, Curk T, Kayikci M, Zupan B, Turner DJ, Luscombe NM, Ule J. iCLIP reveals the function of hnRNP particles in splicing at individual nucleotide resolution. Nat Struct Mol Biol. 2010;17:909–915. doi: 10.1038/nsmb.1838. [DOI] [PMC free article] [PubMed] [Google Scholar]
- Koushika SP, Lisbin MJ, White K. ELAV, a Drosophila neuron-specific protein, mediates the generation of an alternatively spliced neural protein isoform. Curr Biol. 1996;6:1634–1641. doi: 10.1016/s0960-9822(02)70787-2. [DOI] [PubMed] [Google Scholar]
- Koushika SP, Soller M, White K. The neuron-enriched splicing pattern of Drosophila erect wing is dependent on the presence of ELAV protein. Mol Cell Biol. 2000;20:1836–1845. doi: 10.1128/mcb.20.5.1836-1845.2000. [DOI] [PMC free article] [PubMed] [Google Scholar]
- Lebedeva S, Jens M, Theil K, Schwanhausser B, Selbach M, Landthaler M, Rajewsky N. Transcriptome-wide Analysis of Regulatory Interactions of the RNA-Binding Protein HuR. Mol Cell. 2011 doi: 10.1016/j.molcel.2011.06.008. [DOI] [PubMed] [Google Scholar]
- Li JB, Levanon EY, Yoon JK, Aach J, Xie B, Leproust E, Zhang K, Gao Y, Church GM. Genome-wide identification of human RNA editing sites by parallel DNA capturing and sequencing. Science. 2009;324:1210–1213. doi: 10.1126/science.1170995. [DOI] [PubMed] [Google Scholar]
- Li Q, Lee JA, Black DL. Neuronal regulation of alternative pre-mRNA splicing. Nat Rev Neurosci. 2007;8:819–831. doi: 10.1038/nrn2237. [DOI] [PubMed] [Google Scholar]
- Licatalosi DD, Darnell RB. RNA processing and its regulation: global insights into biological networks. Nat Rev Genet. 2010;11:75–87. doi: 10.1038/nrg2673. [DOI] [PMC free article] [PubMed] [Google Scholar]
- Licatalosi DD, Mele A, Fak JJ, Ule J, Kayikci M, Chi SW, Clark TA, Schweitzer AC, Blume JE, Wang X, et al. HITS-CLIP yields genome-wide insights into brain alternative RNA processing. Nature. 2008;456:464–469. doi: 10.1038/nature07488. [DOI] [PMC free article] [PubMed] [Google Scholar]
- Licatalosi DD, Yano M, Fak JJ, Mele A, Grabinski SE, Zhang C, Darnell RB. Ptbp2 represses adult-specific splicing to regulate the generation of neuronal precursors in the embryonic brain. Genes Dev. 2012 doi: 10.1101/gad.191338.112. in press. [DOI] [PMC free article] [PubMed] [Google Scholar]
- Lisbin MJ, Qiu J, White K. The neuron-specific RNA-binding protein ELAV regulates neuroglian alternative splicing in neurons and binds directly to its pre-mRNA. Genes Dev. 2001;15:2546–2561. doi: 10.1101/gad.903101. [DOI] [PMC free article] [PubMed] [Google Scholar]
- Llorian M, Schwartz S, Clark TA, Hollander D, Tan LY, Spellman R, Gordon A, Schweitzer AC, de la Grange P, Ast G, et al. Position-dependent alternative splicing activity revealed by global profiling of alternative splicing events regulated by PTB. Nat Struct Mol Biol. 2010;17:1114–1123. doi: 10.1038/nsmb.1881. [DOI] [PMC free article] [PubMed] [Google Scholar]
- Lopez de Silanes I, Zhan M, Lal A, Yang X, Gorospe M. Identification of a target RNA motif for RNA-binding protein HuR. Proc Natl Acad Sci U S A. 2004;101:2987–2992. doi: 10.1073/pnas.0306453101. [DOI] [PMC free article] [PubMed] [Google Scholar]
- Martin DL, Rimvall K. Regulation of gamma-aminobutyric acid synthesis in the brain. J Neurochem. 1993;60:395–407. doi: 10.1111/j.1471-4159.1993.tb03165.x. [DOI] [PubMed] [Google Scholar]
- Masson J, Darmon M, Conjard A, Chuhma N, Ropert N, Thoby-Brisson M, Foutz AS, Parrot S, Miller GM, Jorisch R, et al. Mice lacking brain/kidney phosphate-activated glutaminase have impaired glutamatergic synaptic transmission, altered breathing, disorganized goal-directed behavior and die shortly after birth. J Neurosci. 2006;26:4660–4671. doi: 10.1523/JNEUROSCI.4241-05.2006. [DOI] [PMC free article] [PubMed] [Google Scholar]
- McBain CJ, Fisahn A. Interneurons unbound. Nat Rev Neurosci. 2001;2:11–23. doi: 10.1038/35049047. [DOI] [PubMed] [Google Scholar]
- McKee AE, Minet E, Stern C, Riahi S, Stiles CD, Silver PA. A genome-wide in situ hybridization map of RNA-binding proteins reveals anatomically restricted expression in the developing mouse brain. BMC Dev Biol. 2005;5:14. doi: 10.1186/1471-213X-5-14. [DOI] [PMC free article] [PubMed] [Google Scholar]
- Mukherjee N, Corcoran DL, Nusbaum JD, Reid DW, Georgiev S, Hafner M, Ascano M, Jr, Tuschl T, Ohler U, Keene JD. Integrative Regulatory Mapping Indicates that the RNA-Binding Protein HuR Couples Pre-mRNA Processing and mRNA Stability. Mol Cell. 2011 doi: 10.1016/j.molcel.2011.06.007. [DOI] [PMC free article] [PubMed] [Google Scholar]
- Noebels JL. The biology of epilepsy genes. Annu Rev Neurosci. 2003;26:599–625. doi: 10.1146/annurev.neuro.26.010302.081210. [DOI] [PubMed] [Google Scholar]
- Okano HJ, Darnell RB. A hierarchy of Hu RNA binding proteins in developing and adult neurons. J Neurosci. 1997;17:3024–3037. doi: 10.1523/JNEUROSCI.17-09-03024.1997. [DOI] [PMC free article] [PubMed] [Google Scholar]
- Pan Q, Shai O, Lee LJ, Frey BJ, Blencowe BJ. Deep surveying of alternative splicing complexity in the human transcriptome by high-throughput sequencing. Nat Genet. 2008;40:1413–1415. doi: 10.1038/ng.259. [DOI] [PubMed] [Google Scholar]
- Ruggiu M, Herbst R, Kim N, Jevsek M, Fak JJ, Mann MA, Fischbach G, Burden SJ, Darnell RB. Rescuing Z+ agrin splicing in Nova null mice restores synapse formation and unmasks a physiologic defect in motor neuron firing. Proc Natl Acad Sci U S A. 2009;106:3513–3518. doi: 10.1073/pnas.0813112106. [DOI] [PMC free article] [PubMed] [Google Scholar]
- Soller M, White K. ELAV inhibits 3’-end processing to promote neural splicing of ewg pre-mRNA. Genes Dev. 2003;17:2526–2538. doi: 10.1101/gad.1106703. [DOI] [PMC free article] [PubMed] [Google Scholar]
- Soller M, White K. ELAV multimerizes on conserved AU4-6 motifs important for ewg splicing regulation. Mol Cell Biol. 2005;25:7580–7591. doi: 10.1128/MCB.25.17.7580-7591.2005. [DOI] [PMC free article] [PubMed] [Google Scholar]
- Szabo A, Dalmau J, Manley G, Rosenfeld M, Wong E, Henson J, Posner JB, Furneaux HM. HuD, a paraneoplastic encephalomyelitis antigen, contains RNA-binding domains and is homologous to Elav and Sex-lethal. Cell. 1991;67:325–333. doi: 10.1016/0092-8674(91)90184-z. [DOI] [PubMed] [Google Scholar]
- Tollervey JR, Curk T, Rogelj B, Briese M, Cereda M, Kayikci M, Konig J, Hortobagyi T, Nishimura AL, Zupunski V, et al. Characterizing the RNA targets and position-dependent splicing regulation by TDP-43. Nat Neurosci. 2011;14:452–458. doi: 10.1038/nn.2778. [DOI] [PMC free article] [PubMed] [Google Scholar]
- Ule J, Darnell RB. RNA binding proteins and the regulation of neuronal synaptic plasticity. Curr Opin Neurobiol. 2006;16:102–110. doi: 10.1016/j.conb.2006.01.003. [DOI] [PubMed] [Google Scholar]
- Ule J, Jensen K, Mele A, Darnell RB. CLIP: a method for identifying protein-RNA interaction sites in living cells. Methods. 2005a;37:376–386. doi: 10.1016/j.ymeth.2005.07.018. [DOI] [PubMed] [Google Scholar]
- Ule J, Jensen KB, Ruggiu M, Mele A, Ule A, Darnell RB. CLIP identifies Nova-regulated RNA networks in the brain. Science. 2003;302:1212–1215. doi: 10.1126/science.1090095. [DOI] [PubMed] [Google Scholar]
- Ule J, Stefani G, Mele A, Ruggiu M, Wang X, Taneri B, Gaasterland T, Blencowe BJ, Darnell RB. An RNA map predicting Nova-dependent splicing regulation. Nature. 2006;444:580–586. doi: 10.1038/nature05304. [DOI] [PubMed] [Google Scholar]
- Ule J, Ule A, Spencer J, Williams A, Hu JS, Cline M, Wang H, Clark T, Fraser C, Ruggiu M, et al. Nova regulates brain-specific splicing to shape the synapse. Nat Genet. 2005b;37:844–852. doi: 10.1038/ng1610. [DOI] [PubMed] [Google Scholar]
- Wang ET, Sandberg R, Luo S, Khrebtukova I, Zhang L, Mayr C, Kingsmore SF, Schroth GP, Burge CB. Alternative isoform regulation in human tissue transcriptomes. Nature. 2008;456:470–476. doi: 10.1038/nature07509. [DOI] [PMC free article] [PubMed] [Google Scholar]
- Wang H, Molfenter J, Zhu H, Lou H. Promotion of exon 6 inclusion in HuD pre-mRNA by Hu protein family members. Nucleic Acids Res. 2010a;38:3760–3770. doi: 10.1093/nar/gkq028. [DOI] [PMC free article] [PubMed] [Google Scholar]
- Wang J, Bell LR. The Sex-lethal amino terminus mediates cooperative interactions in RNA binding and is essential for splicing regulation. Genes Dev. 1994;8:2072–2085. doi: 10.1101/gad.8.17.2072. [DOI] [PubMed] [Google Scholar]
- Wang Z, Kayikci M, Briese M, Zarnack K, Luscombe NM, Rot G, Zupan B, Curk T, Ule J. iCLIP predicts the dual splicing effects of TIA-RNA interactions. PLoS Biol. 2010b;8:e1000530. doi: 10.1371/journal.pbio.1000530. [DOI] [PMC free article] [PubMed] [Google Scholar]
- Xue Y, Zhou Y, Wu T, Zhu T, Ji X, Kwon YS, Zhang C, Yeo G, Black DL, Sun H, et al. Genome-wide analysis of PTB-RNA interactions reveals a strategy used by the general splicing repressor to modulate exon inclusion or skipping. Mol Cell. 2009;36:996–1006. doi: 10.1016/j.molcel.2009.12.003. [DOI] [PMC free article] [PubMed] [Google Scholar]
- Yano M, Hayakawa-Yano Y, Mele A, Darnell RB. Nova2 regulates neuronal migration through an RNA switch in disabled-1 signaling. Neuron. 2010;66:848–858. doi: 10.1016/j.neuron.2010.05.007. [DOI] [PMC free article] [PubMed] [Google Scholar]
- Yeo GW, Coufal NG, Liang TY, Peng GE, Fu XD, Gage FH. An RNA code for the FOX2 splicing regulator revealed by mapping RNA-protein interactions in stem cells. Nat Struct Mol Biol. 2009;16:130–137. doi: 10.1038/nsmb.1545. [DOI] [PMC free article] [PubMed] [Google Scholar]
- Zhang C, Frias MA, Mele A, Ruggiu M, Eom T, Marney CB, Wang H, Licatalosi DD, Fak JJ, Darnell RB. Integrative modeling defines the Nova splicing-regulatory network and its combinatorial controls. Science. 2010;329:439–443. doi: 10.1126/science.1191150. [DOI] [PMC free article] [PubMed] [Google Scholar]
- Zhang C, Zhang Z, Castle J, Sun S, Johnson J, Krainer AR, Zhang MQ. Defining the regulatory network of the tissue-specific splicing factors Fox-1 and Fox-2. Genes Dev. 2008;22:2550–2563. doi: 10.1101/gad.1703108. [DOI] [PMC free article] [PubMed] [Google Scholar]
- Zhu H, Hinman MN, Hasman RA, Mehta P, Lou H. Regulation of neuron-specific alternative splicing of neurofibromatosis type 1 pre-mRNA. Mol Cell Biol. 2008;28:1240–1251. doi: 10.1128/MCB.01509-07. [DOI] [PMC free article] [PubMed] [Google Scholar]
Associated Data
This section collects any data citations, data availability statements, or supplementary materials included in this article.