

Abstract
In Swiss 3T3 fibroblasts, long-term stimulation with PDGF, but not insulin-like growth factor 1 (IGF-1) or EGF, results in the establishment of an elongated migratory phenotype, characterized by the formation of retractile dendritic protrusions and absence of actin stress fibers and focal adhesion complexes. To identify receptor tyrosine kinase-specific reorganization of the Swiss 3T3 proteome during phenotypic differentiation, we compared changes in the pattern of protein synthesis and phosphorylation during long-term exposure to PDGF, IGF-1, EGF, and their combinations using 2DE-based proteomics after 35S- and 33P-metabolic labeling. One hundred and five differentially regulated proteins were identified by mass spectrometry and some of these extensively validated. PDGF stimulation produced the highest overall rate of protein synthesis at any given time and induced the most sustained phospho-signaling. Simultaneous activation with two or three of the growth factors revealed both synergistic and antagonistic effects on protein synthesis and expression levels with PDGF showing dominance over both IGF-1 and EGF in generating distinct proteome compositions. Using signaling pathway inhibitors, PI3K was identified as an early site for signal diversification, with sustained activity of the PI3K/AKT pathway critical for regulating late protein synthesis and phosphorylation of target proteins and required for maintaining the PDGF-dependent motile phenotype. Several proteins were identified with novel PI3K/Akt-dependent synthesis and phosphorylations including eEF2, PRS7, RACK-1, acidic calponin, NAP1L1, Hsp73, and fascin. The data also reveal induction/suppression of key F-actin and actomyosin regulators and chaperonins that enable PDGFR to direct the assembly of a motile cytoskeleton, despite simultaneous antagonistic signaling activities. Together, the study demonstrates that long-term exposure to different growth factors results in receptor tyrosine kinase-specific regulation of relatively small subproteomes, and implies that the strength and longevity of receptor tyrosine kinase-specific signals are critical in defining the composition and functional activity of the resulting proteome.
Receptor tyrosine kinases transduce key extracellular signals and trigger multiple cellular events, including proliferation, differentiation, and cytoskeletal rearrangement. A variety of intracellular signaling molecules associate with the phosphorylated tyrosine residues on the cytoplasmic tail of activated receptor tyrosine kinase (RTKs)1 via their Src homology 2 domain (SH2) or phosphotyrosine-binding (PTB) domains. Mutation of these docking sites results in severely disturbed cellular phenotypes in different model systems, demonstrating the physiological importance of RTK signaling (1). As every RTK recruits and activates a different combination of signaling proteins via their own tyrosine autophosphorylation sites and sites on closely associated docking proteins (e.g. Gab1, FRS2) (2, 3) it has been considered for a long time that this combinatorial recruitment determines signal specificity.
However, mutant platelet-derived growth factor receptor (PDGFR) lacking binding sites for activation of the PLCγ, PI3K, SHP2 and RasGAP pathways still retain partial ability to induce 64 out of 66 immediate early genes induced by the ‘wild-type’ receptor (4). The authors also observed induction of almost identical sets of immediate early genes in response to PDGFRβ and fibroblast growth factor receptor 1 activation in murine fibroblasts, suggesting that different RTK-activated pathways exert broadly overlapping effects on immediate early genes induction. More recently, three groups have demonstrated that specific expression of marker genes for RTK-dependent cell fate decision in Drosophila does not appear to arise from RTK-specific intracellular signaling, but does so through a combination of RTK and non-RTK-signaling that feed into pre-existing cell-specific transcription factors which are induced during earlier developmental stages (5–7). Thus, distinct responses to RTKs in different cells can be explained by differences in the cells' developmental histories. These results also suggest that RTKs use general signaling pathways or networks with some redundancy, and that the specificity provided by combinatorial recruitment of particular signaling proteins is not that stringent. However, these studies only deal with transcriptional responses to RTK activation, and gene expression changes alone are unlikely to determine biological outcome. For this reason, global analyses of protein synthesis, expression level, activity status, and degradation rates are necessary to understand how signals from different RTKs are diversified to provide specific biological outcomes.
The early signaling events associated with RTK activation have been intensively studied and a detailed map of the integrated signaling circuits is emerging. However, the fact that commitment to specific cellular responses such as cell cycle progression, seem to require the continuous exposure to growth factor (GF) for several hours, suggests that there must be essential signaling events occurring throughout this time period (8, 9). The importance of this sustained versus transient signaling in defining biological outcome is illustrated by the finding that nerve growth factor triggers sustained mitogen-activated protein kinases (MAPK) activation and differentiation of PC12 cells, whereas epidermal growth factor (EGF) triggers transient MAPK activation and cell proliferation (10). Moreover, EGF receptor overexpression in these cells leads to sustained MAPK activation, resulting in their differentiation, further implicating that biological outcome is dependent on quantitative modulations of the strength and duration of the inducing signals. Cross-talk between pathways may also act synergistically to enhance an internal pathway, as shown for MAPK activation in response to attachment of cells to the extracellular matrix during GF treatment (11). Finally, pathways may also antagonize one another as found for interferon-γ, which inhibits TGF-β signaling by inducing the expression of the inhibitory Smad7 protein (12).
Changes in fibroblast morphology in response to short-term growth factor exposure are well characterized. However, these changes are normally transient responses occurring during short-term stimulation, and cytoskeletal changes triggered by long-term stimulation of RTKs have not been well studied. For example, although short-term PDGF treatment induces membrane ruffling and lamellipodial extensions in fibroblasts through activation of the small GTPases Cdc42 and Rac (13, 14), the establishment of a motile cytoskeleton with retractile dendritic protrusions requires exposure to PDGF for 12 h (15).
Here, a two-dimensional electrophoresis (2DE)-based proteomic analysis was undertaken to identify GF-specific proteome modifications in Swiss 3T3 cells that define distinct phenotypic outcome, and to investigate the effects of receptor coactivation. As our main objective was to describe the changes in the fibroblasts proteome that underlie the establishment of an elongated, migratory phenotype during long-term PDGF-stimulation, PDGF was used at a concentration of 50 ng/ml, which according to earlier reports should ensure optimal rates of proliferation and cytoskeletal reorganization (16–18). The concentration of EGF and insulin-like growth factor 1 (IGF-1) were then adjusted to instigate a similar mitogenic effect in the murine fibroblasts. At the used concentration of 100 ng/ml EGF and IGF-1 both promoted the establishment of a well-anchored, round, immotile phenotype. Long-term treatment with higher concentrations of one or both of these growth factors did not change the phenotypic outcome.
The rate of protein synthesis was monitored by biosynthetic labeling with [35S]-methionine and -cysteine, changes in protein abundance were monitored by densitometry analysis of fluorescent dye-stained gels and immunoblotting, RTK-induced phospho-signaling was examined by a combination of [33P]-orthophosphate labeling, phosphatase treatment and immunoblotting and GF-treatment in the presence of kinase inhibitors was used to investigate the signaling pathways/networks that control RTK-specific proteome regulation.. The study finally investigates the specific, dominant changes in proteome activities that enable PDGF to control the organization of contractile actomyosin structures during the assembly of a migratory cytoskeleton, despite simultaneous antagonistic signals from other RTKs.
MATERIALS AND METHODS
Cell Culture, Metabolic Labeling, and Preparation of Whole Cell Lysates
Swiss 3T3 cells were maintained in Dulbecco's modified Eagle's medium (GIBCO, Carlsbad, CA) supplemented with 10% fetal bovine serum (FBS), 100 U/ml of penicillin, and 100 μg/ml of streptomycin in 5% CO2 at 37 °C. For biosynthetic labeling, subconfluent cells were serum-starved in Dulbecco's modified Eagle's medium supplemented with 0.1% FBS for 24 h, and subsequently stimulated with PDGF (50 ng/ml), IGF-1 (100 ng/ml), EGF (100 ng/ml) (PeproTech), or their combinations for 6, 12, and 18 h before lysis. Cells were labeled with [35S]-Met/Cys (0.2 mCi/ml of Promix; Amersham Biosciences Pharmacia) during the last 3 h of each stimulation condition. In some experiments, cells were cultured in the presence of various inhibitors (10 μm LY294002, 50 μm PD98059, 20 nm PD184352, 50 nm rapamycin, 2 μm SU6656, 1 μm ML-7, 3 μm Y-27632, 1 μm PS-341, 50 μm lactacystin, 10 ng/ml actinomycin D, and 10 μg/ml cycloheximide), during the entire time-course, whereas in others, cells were pretreated with inhibitors for 30 min before metabolic labeling for 3 h. For [33P]-orthophosphate labeling, synchronized cells grown to 70% confluence were washed twice in phosphate-free Dulbecco's modified Eagle's medium containing 0.1% FBS, incubated for one hour in the same media, and labeled with 0.1 mCi/ml [33P]-orthophosphate for 6 h before short-term GF stimulations. In long-term stimulation experiments (6–18 h), the cells were either incubated with [33P]-orthophosphate during the entire stimulation period, or the radioisotope was added to the culture medium after 6 or 12 h.
Cells were routinely lysed in a solution containing 8 m urea, 2 m thiourea, 4% 3-[(3-cholamidopropyl)dimethylammonio]propanesulfonate (CHAPS), 65 mm dithiothreitol (DTT), protease inhibitor mixture with EDTA (Roche Applied Science), and phosphatase inhibitors (1 μm okadaic acid, 5 μm α-cyano-3-phenoxybenzyl α-(4-chlorophenyl) isovalerate, and 5 μm potassium bisperoxo (1,10-phenanthroline) oxovanadate). For carrier ampholyte-based isoelectric focusing (IEF), cells were lysed in 2% Nonidet P-40, 9.6 m urea, 100 mm DTT, 2% ampholines (pH 3–10) plus the above inhibitors. Protein concentrations were determined by Bradford assay (Coomassie Plus Protein Assay Reagent; Pierce, Waltham, MA). For alkaline phosphatase (AP) treatment, cells were lysed in a solution containing 50 mm Tris-HCl (pH 8.5), 1 m urea, 2 m thiourea, 4% CHAPS, 65 mm DTT and 2% ampholines. The lysates were incubated at 37 °C for 30 min with or without AP (7.5 U). Artifactual sample modification by carbamylation was minimal.
Two-dimensional Gel Electrophoresis (2-DE)
Isoelectric focusing with carrier ampholines was performed as previously described (19). Isoelectric focusing with in-gel reswelling of immobilized pH gradient strips (Immobiline DryStrip pH 3–10NL 18 cm, pH 6–9NL 18 cm (GE Healthcare), or ReadyStrip IPG strips pH 3–6, 17 cm (Bio-Rad, Hercules, CA)) was performed as described elsewhere (20). Second dimension electrophoresis was routinely performed in 9–16% gradient SDS-PAGE gels. Proteins were silver stained according to Shevchenko (21), or stained with the fluorescent dye OGT MP17 according to the manufacturer's protocol (22). Radiolabeled proteins were electro-blotted onto nitrocellulose or PVDF membranes, and scanned by phosphoimaging on a Molecular Imager FX scanner (Bio-Rad). The membranes were subsequently stained by Coomassie or used for immunoblotting. Immunoblots were visualized by ECL (Amersham Biosciences Pharmacia). Experiments in which secondary antibodies were used alone gave no signals. All experiments were repeated with samples from separately stimulated cell cultures.
Image Analysis
Gel image analysis was performed using the Melanie 3 software (Genebio, Geneva, Switzerland). Quantitation and comparison of radiolabeled protein spot volumes and intensities were performed using a combination of Melanie 3 and the in-house written program ChiMap. The individual spot density values were calculated as the relative difference between the spot density at the given time point, and the spot density on reference gel images, and the final value given is an average of at least three independent experiments. In some cases, PDGF-stimulated gel images (18 h) were used as reference, as we were unable to detect all the differentially regulated proteins on 35S-gel images from unstimulated cells. The in-house program ChiClust (23) was used to identify patterns of protein spots that were similar or different between gels. Variations between spot density and/or volume on the different images are incorporated into a generic % homology value, which can be used to generate a dendrogram or relational tree of homology, as illustrated in Fig. 2. All computer alignments and target selections based on densitometry values were visually crosschecked by at least two operators. Proteins for MS analysis were excised from stained gels either manually or automatically using a robotic cutter (Oxford GlycoSciences).
Fig. 2.

A, Global analysis of protein synthesis in Swiss 3T3 cells stimulated with PDGF, IGF-1, EGF, and their combinations. Newly synthesized [35S]methionine- and cysteine-labeled proteins were separated on broad range, nonlinear (pH 3–10NL) IPG/PAGE gels. Radiolabeled proteins were detected by phosphoimaging. The elevated de novo synthesis in PDGF-stimulated cells was blocked by cycloheximide. Note the profound reduction in protein synthesis in cells where long-term PDGF treatment (18 h) was performed in the presence of the PI3K inhibitor LY290042 (10 μm). B, Number of 2DE protein spots detected in extracts from cells treated with PDGF, IGF-1, EGF, and their combinations. Left; temporal changes in the number of [35S]-labeled protein spots detected following 6, 12, and 18 h stimulation. Right; numbers of radiolabeled proteins detected following 18 h of stimulation. Numbers are the average taken from three independent experiments. C, Comparison of the number of matched protein spots showing a >twofold increase in 35S-incorporation between different GF treatments at the 18 h time point. Values were calculated as a percentage of total matched protein spots and compared the synthetic responses to growth factors and their combinations to those generated by individual growth factor stimulations. The analysis provides an indication of the comparative potency of each GF in stimulating or suppressing protein synthesis. D, Comparison of the number of matched protein spots showing a >twofold reduction in 35S-incorporation between different GF treatments at 18 h. E, Hierarchical clustering analysis of protein synthesis in GF-stimulated cells. Two-dimensional gel images of biosynthetic labeled proteins were clustered according to similarity between the density patterns of a group of 172 proteins, whose synthesis rates were almost identically regulated by the three growth factors after 6 h. In the resulting relational tree, short branches connect similar images, whereas increasingly long branches join gel images with diminishing similarity. F, ChiClust clustering analysis of protein synthesis during long-term GF-stimulation. The 2DE images were clustered according to similarities between all radiolabeled protein spots.
In-gel Digestion
Tryptic in-gel digests were essentially prepared as described earlier (24). In brief, two-dimensional-gel pieces were destained and rehydrated with 25 mm ammonium bicarbonate (AmBic)/50% acetonitrile (ACN), and vacuum-dried in a SpeedVac centrifuge. Then, gel pieces were rehydrated with 10 mm DTT/25 mm AmBic solution and incubated for 1 h at 50 °C, followed by removal of the DTT solution and the addition of an equivalent volume of 50 mm iodoacetic acid/25 mm AmBic solution. After incubation in the dark for 1 h at room temperature the samples were washed with 25 mm AmBic/50% ACN and vacuum-dried in a SpeedVac centrifuge. The samples were then rehydrated and digested overnight with 30 ng modified porcine trypsin (Promega) at 37 °C. Peptides were extracted three times with 50% ACN/5% trifluoroacetic acid solution, dried in a SpeedVac and resuspended in 5 μl of water.
Protein Identification by Mass Spectrometry
For matrix-assisted laser desorption/ionization (MALDI) MS analysis, the digested peptide mixture was spotted onto the target plate together with a saturated aqueous solution of 2,5-dihydroxybenzoic acid (DHB). All samples were analyzed on a Reflex III reflector time-of-flight (TOF) mass spectrometer (Bruker-Daltonik, Bremen, Germany) equipped with delayed extraction and a Scout 384 ion source similar to a previously reported study (25). Briefly, the instrument was externally calibrated using calibration mixture 2 from the Sequazyme kit (Applied Biosystems). Spectra were obtained by averaging 32–128 single-shot acquisitions and internal calibration was carried out using the trypsin autolysis peaks at m/z 842.51 and m/z 2211.10. Peak masses were assigned by labeling the first monoisotope. The peak mass lists were submitted to ProteinProspector's database search routine MS-Fit for peptide mass mapping (http://prospector.ucsf.edu/prospector/mshome.htm), searching the NCBInr database version 20010107 (601,500 sequences) or 20010303 (640,428 sequences) with trypsin as the enzyme, a ±100 ppm mass tolerance, max. Two missed cleavages and carboxymethylation of cysteine as a constant modification. Acetylation at the protein's N terminus, methionine oxidation, and pyro-glutamic acid for N-terminal glutamine were used as variable modifications. Positive identifications were accepted if there were at least five peptides matched to a protein entry, there was a 20% minimum coverage of the protein sequence, the molecular weight was within ±25% of the gel-curated molecular weight and the pI was within ±10% of the gel-curated pI value.
When peptide mass mapping by MALDI MS was unsuccessful or ambiguous, LC-electrospray ionization (ESI) MS/MS analysis was performed. Briefly, the remainder of the digested peptide mixture was run on a micro- or nano-capillary HPLC. After loading the sample, peptide separation was performed on a fused silica C18 column (LC Packings, Amsterdam, Netherlands). The HPLC column was coupled to a 50 μm I.D. fused silica capillary via a zero dead volume connector, which was coupled to the standard nano-LC interface of a Q-Tof hybrid quadrupole orthogonal time-of-flight mass spectrometer (Micromass, Wythenshawe, UK). Mobile phase A was 0.1% formic acid and mobile phase B was 80% ACN/0.08% formic acid. Gradient elution was carried out from 5% B to 42% B in 90 min. Mass spectra were acquired using the MassLynx 3.3 software package with automatic precursor ion selection. Fragment ion mass lists were submitted to the database search engine Mascot 1.8 (Matrix Science, London, UK) to search the same NCBInr databases described above with trypsin as the enzyme, a ±100 ppm parent ion mass tolerance, ±100 mmu fragment ion mass tolerance, max. 1 or 2 missed cleavages and the modifications described above. Significant hits were defined when two or more peptide sequences matched a protein entry and the MASCOT score was above the significance level (p < 0.05).
Immunofluorescence Imaging
Immunofluorescence staining was performed as described previously (15). Cells were grown on coverslips, stimulated with GFs as described above for 18 h, and stained with anti-vinculin (Sigma), anti-RACK-1 (Transduction Laboratory, Lexington, KY), or rhodamine-phalloidin. Specimens were visualized with an LSM 510 confocal microscope using a 40× NA 1.3 Neofluar objective (Zeiss, UK) or with a Coolview 12 integrating cooled CCD camera (Photonic Science, East Sussex, U.K.) mounted over an Axiophot microscope fitted with a 63× NA 1.4 oil immersion objective (Zeiss UK). No staining was observed when secondary antibodies were applied alone. For time-lapse analysis, cells were grown on 35 mm tissue culture dishes and image data sets collected once every 4 min for a period of 22 h with a KP-M1 monochrome video camera (Hitachi Denshi, London, U.K.) mounted on the side port of an Axiovert 135 microscope (Zeiss UK) and using Tempus image acquisition software (Kinetic Imaging, Merseyside, UK).
RESULTS
Biologic Effects of Growth Factor Stimulation
Treatment with recombinant PDGF (50 ng/ml), IGF-1 (100 ng/ml), and EGF (100 ng/ml) induced significant and roughly equivalent mitogenic activity in the murine fibroblasts as detected by [3H]-thymidine and BrdU-incorporation, whereas the induction of specific receptor phosphorylation and degradation patterns (for EGFR and PDGFR) confirmed ligand-specific receptor activation (supplemental Fig. S1). PDGF stimulation induced a unique morphological phenotype, which was characterized by an elongated cell shape and dendritic protrusions, and absence of actin stress fibers and focal adhesions (Fig. 1A). The disruption of stress fibers and focal adhesions occurred within the first hour of PDGF stimulation, whereas full development of dendritic protrusions appeared after 12 h and was sustained throughout the rest of the stimulation period (Fig. 1B). Furthermore, a significant enhancement in cell motility on tissue culture dishes was observed by time-lapse microscopy following 12 h of PDGF stimulation, and characterized by continuous extension and retraction of dendritic protrusions and changes in cell shape (data not shown). In contrast, stimulation with EGF (or IGF-1) only slightly increased cell motility over the same time period (15). Short-term stimulation with PDGF (<1 h) has previously been reported to induce membrane ruffling and lamellipodial extensions (13), but not dendritic protrusions, which seem to be unique features of the long-term growth factor stimulation employed in this study.
Fig. 1.

A, Immunofluorescence analysis of cytoskeleton changes in Swiss 3T3 fibroblasts induced by long-term stimulation with PDGF, IGF-1, EGF and their combinations. Focal visualized by fluorescence staining with anti-vinculin antibody and rhodamine-phalloidin staining, respectively. Dendritic protrusions are indicated by arrows (middle column). Note the dominance of PDGF in costimulation experiments, resulting in development of an elongated cell shape with retractile dendritic protrusions and disruption of stress fibers (SF) and focal adhesion (FA) complexes. B, Immunofluorescence analysis of temporal changes in the actin cytoskeleton during long-term GF-treatment. Actin filaments were stained with rhodamine phalloidin. In the PDGF-treated cells, SF and FA had disappeared by 6 h, dendritic protrusions began to appear after 12 h and the development of an elongated, motile cytoskeleton was fully accomplished by 18 h treatment. C, Changes in focal adhesion density and cell surface area in response to growth factor stimulation.
Conversely, long-term EGF or IGF-1 stimulation resulted in a moderate increase in stress fiber and focal adhesion formation, compared with unstimulated cells. Actin stress fibers and focal adhesion complexes were abundant in 20% of unstimulated cells, in 26% of IGF-1-stimulated cells and in 28% of EGF-stimulated cells (Fig. 1C, top). The large, flat immotile phenotype induced by EGF and IGF-1 had almost twice the cell surface area compared with the PDGF-induced phenotype (Fig. 1C, bottom). Interestingly, the EGF or IGF-1-induced morphological changes were greatly influenced by cell confluence, whereas the PDGF-induced changes were less affected, suggesting that PDGFR signaling may override signaling induced by cell-cell contact in Swiss 3T3 cells. Costimulation experiments demonstrated that PDGF had a dominant influence on morphology over EGF and IGF-1, resulting in the formation of an elongated cell shape with dendritic protrusions and suppression of stress-fibers and focal adhesions (Figs. 1A and 1C). Taken together, these data show that long-term stimulation with PDGF inhibits formation of stress fibers and focal adhesions in Swiss 3T3 cells, and promotes formation of dendritic protrusions and motility, even during simultaneous stimulation with either or both EGF and IGF-1.
The PDGF-specific morphological transformation was abrogated in fibroblasts where DNA-dependent RNA-synthesis was blocked by treatment with actinomycin D, protein translation was blocked by cycloheximide treatment, the 26S proteasome was inhibited by PS341 treatment, in which the activity of Src kinases was inhibited by SU6656 treatment, and in which methyltransferase and deacetylase activities were blocked by 5aC and TSA treatments, respectively (supplemental Fig. S2). These findings demonstrate that the PDGF-induced reorganization of the actin cytoskeleton in Swiss 3T3 fibroblasts involves the complex regulation of gene transcription, protein synthesis, post-translational modification, and degradation.
Analysis of Growth Factor-regulated Protein Synthesis in Swiss 3T3 Fibroblasts
The rate of protein synthesis was next monitored by biosynthetic labeling with [35S]-methionine and cysteine during the last 3 h of GF stimulation, employing 6, 12, and 18 h stimulation periods. Radiolabeled proteins were separated by 2-DE, electro-transferred to PVDF membranes and scanned by phospho imaging (Fig. 2A). As a control, protein synthesis was abolished by addition of cycloheximide. The digitized images were subjected to computer analysis to define alterations in the de novo synthesis of proteins.
The three growth factors induced [35S]-incorporation into several hundred protein spots within the first 6 h of treatment, in addition to the 631 spots that were radiolabeled in untreated cells (Figs. 2A and 2B). This is assumed to represent de novo protein synthesis. Although the majority of the detected protein spots showed similar regulation over time, 21% of the matched spots were differentially regulated by the three growth factors. PDGF stimulation induced the highest overall rate of protein synthesis at any given time, followed by IGF-1 and then EGF, as judged by the total quantity of radioisotope incorporation detected by autoradiography of gels (Fig. 2A). Computer-aided global densitometry analysis showed that the number of protein spots with up-regulated synthesis reached a maximum at the 6 h time point and that the three GFs induced almost identical numbers of new proteins by this time (Fig. 2B). The more than 1250 different spots resolved, represents a doubling of the number of isotope-labeled protein species detected in extracts from unstimulated cells (Figs. 2A and 2B). Although the number of newly synthesized protein spots stayed rather constant during continuous PDGF and IGF-1 stimulations, it declined over time during EGF stimulation, resulting in the greatest qualitative difference after 18 h (Fig. 2B); by 18 h, PDGF had increased or reduced protein synthesis (by >twofold) in a higher number of matched features compared with EGF or IGF-1 (Figs. 2C and 2D).
Comparison of protein expression levels revealed that 18 h treatment with PDGF and EGF induced the most distinct proteome compositions (supplemental Fig. S3), which were presumably sustained by the most distinct patterns of de novo protein synthesis; 18 h stimulation with PDGF more than doubled the synthesis rate of 15.8% of matched proteins compared with EGF, which more than doubled the synthesis rates of 5.3% of proteins compared with PDGF (Fig. 2C). The suppressive effects of PDGF treatment were likewise dominant; PDGF reduced the synthesis of 11.4% of matched proteins by greater than 2-fold compared with EGF, whereas EGF reduced the synthesis rates of 3.9% of matched proteins compared with PDGF (Fig. 2D).
GF-specific temporal modulations and the effects of costimulation were reflected by hierarchical clustering analysis. For Fig. 2E, the images were clustered using the density patterns of a group of 172 proteins, whose synthesis rates were found to be similarly regulated by the three GFs after 6 h. In accordance with the gradual reduction in both the numbers of induced proteins and their synthesis rates seen in response to EGF treatment, the images from the EGF 12 and 18 h treatments clustered in proximity to those from untreated cells (Fig. 2E). Changes in protein synthesis induced by EGF were thus rapid and short-lived. The images obtained from cells treated with PDGF and IGF-1 for 18 h clustered with images obtained from cells exposed to GF for shorter periods, indicating that the synthesis rates of the majority of the 172 reference proteins did not change significantly during long-term treatment with these two GFs. In the ChiClust analysis shown in Fig. 2F, images were clustered according to similarities between all radiolabeled spots. It demonstrates the divergence over time in the patterns of newly synthesized proteins generated following PDGF treatment versus EGF or IGF-1 treatment (Fig. 2F). Indeed, long-term exposure to PDGF elevated the synthesis of more than 800 proteins. Although the number of newly synthesized proteins also declined over time in IGF-1 treated cells, IGF-1 maintained increased de novo synthesis significantly longer than EGF. Notably, the progressive divergences in synthesis patterns between the different treatments coincided with the development of the two distinct morphological phenotypes (see above). The formation of a migratory cytoskeleton requires continuous exposure to PDGF for 12 h (15), the time point at which PDGF treatment had produced the most unique pattern of de novo protein synthesis in 3T3 fibroblasts (Fig. 1F).
Costimulation with two GFs resulted in both additive and synergistic increases in protein synthesis rates and the positive effects of receptor costimulations were generally more pronounced than the suppressive (Fig. 2C and 2D). Notably, although the number of proteins with a more than twofold increase in 35S-incorporation was significantly elevated by any combination of two GFs, costimulation with all three GFs had a less pronounced effect on protein synthesis and actually resulted in more proteins showing a >twofold reduction in synthesis (Figs. 2C and 2D). As a consequence, images from cells treated with any combination of two GFs for 18 h clustered together, whereas long-term treatment with all three GFs resulted in a synthesis pattern more similar to those obtained following short-term treatment with individual GFs (Figs. 2E and 2F). However, costimulation experiments also revealed that for some proteins, one GF could dominantly suppress an increased synthesis rate induced by another GF (see examples in supplemental Figs. S4 and S5). Notably, PDGF induced the most pronounced regulatory effects in costimulation experiments.
Differentially Regulated Proteins Identified by Mass Spectrometric Analysis
Proteins, which were dominantly induced or suppressed by a specific growth factor or combination of growth factors, and proteins that displayed differential timing of induction or suppression were targeted for identification by MS analysis, because they are likely to be of importance for GF-specific morphological differentiation. We were able to align approximately two-thirds of the differentially regulated proteins on either silver-stained or fluorescent dye-stained gels by computer alignment. MALDI-TOF MS and LC-ESI MS/MS were then used to identify 143 protein species from 107 differentially regulated protein spots with two or more proteins identified in 25 of the spots (supplemental Table S1). These represented 105 unique gene products, the majority of which belonged to the following functional groups; proteins involved in the translational machinery, chaperone function, protein degradation, vesicular transport, DNA/RNA synthesis and transport, metabolic pathways, and cytoskeleton organization; the latter subset represented by more than 20 species. The synthesis rates of 33 of the identified proteins were predominantly controlled by PDGF. Examples of differentially regulated proteins are provided in supplemental Fig. S5. Notably, some proteins demonstrated bi-phasic regulation over the observation period, suggesting that secondary signaling events such as autocrine loops may be initiated during long-term GF-stimulation.
Analysis of Growth Factor Induced Phospho-signaling
To study the underlying GF-induced regulatory phospho-signaling pathways and whether the enhancing and suppressive effects receptor coactivation instigates on protein synthesis reflects changes in the RTK-induced signaling cascades, [33P]-orthophosphate labeling was combined with immunoblotting, immunoprecipitation, and kinase inhibitor and phosphatase treatment experiments.
Immunoblotting with phosphorylation site-specific antibodies showed that sustained stimulation with PDGF and IGF-1, but not EGF, induced phospho-activation of Akt (pS473) that lasted for at least 18 h (Fig. 3A and 3B). Compared with EGF and IGF-1, PDGF induced a longer lasting and dominant phospho-activation of ERK1 (pT203/pY205), ERK2 (pT183/pY185), PKCβII (pS660), PLCγ (Y783), STAT3 (Y705), and Src (pY424) (Fig. 3A). Indeed, EGF only induced transient phosphorylation of ERK1/2 and PKCβII, whereas IGF-1 produced barely any detectable activation of these signaling proteins by comparison with the PDGF-induced signals. Phosphorylation of the inhibitory site of Src (Y535) was also transiently induced by PDGF similar to the Y424 activation site, and this was abrogated by pretreatment with 2 μm of the c-Src inhibitor SU6656 (Fig. 3D). Although both phosphorylation events may not be mutually exclusive, this data hints that distinct pools of activated and inactivated Src may exist in cells stimulated with PDGF. PDGF was also dominant over EGF in inducing transient phosphorylation of p38γ (MAP kinase 12) at its activation sites (T183/Y185) (Fig. 3B). Notably, the PDGF-induced phosphorylation of p38γ and PKCβII was reduced in cells pretreated with LY294002 (Figs. 3B and 3C), indicating that PDGF at least in part activate p38γ and PKCβII via the PI3K/Akt pathway. Short-term PDGF treatment (15 min) also caused a transient reduction in the phosphorylation of FAK at Y428, and a transient increase in cofilin phosphorylation at S3, consistent with cofilin inactivation (Fig. 3A). These changes are likely to facilitate actin remodeling and focal adhesion turnover, and may explain the PDGF-mediated reduction in stress fibers (SF) and focal adhesions (FA) observed in Swiss 3T3 fibroblasts within the first 30 min of treatment (15). Finally, PDGF induced the specific phosphorylation of c-Myc (T58/S62) at the 6 h time point. These sites are known to regulate the stability and thereby the duration of c-Myc activity following mitogenic induction. Thus, the signal detected is likely to reflect a higher level of induced c-Myc protein in the PDGF stimulated cells, which is being directed for ubiquitin-mediated degradation following its phoshorylation (Fig. 3A).
Fig. 3.

Analysis of growth factor induced phospho-signaling. A, Temporal changes in key signal transducer activities demonstrated by immunoblotting with phosphorylation site-specific antibodies. β-actin served as loading control. B, Immunoblot analysis of Akt and p38 phosphorylation in PDGF and EGF treated cells (top). Pretreatment with the PI3K-inhibitor LY294002 (10 μm) abolished the PDGF-induced increase in p38 phosphorylation at the 60 min time point (bottom). C, Immunoblot analysis of PKC and JNK phosphorylation in EGF and PDGF treated cells. Both GFs induced a weak, long-lasting increase in JNK phosphorylation. Although a high level of phospho-activated PKC was sustained for several hours in PDGF treated cells, less than 30% of the increase in PKC phosphorylation found in EGF treated cells at the 15 min time point were detected after 60 min treatment. Pretreatment with LY294002 reduced the level of phosphorylated PKC in cells treated with PDGF for 60 min (bottom). D, The PDGF-induced increase in phosphorylation of c-Src at the inhibitory site (Y535) at the 15 min time point was abolished by pretreatment with the Src-specific inhibitor SU6656 (2 μm), indicating that the modification is induced by autophosphorylation. E, two-dimensional autoradiograms of [33P]-orthophosphate labeled proteins isolated by immunoprecipitation with an anti-c-Src antibody following 2 h and 4 h growth factor treatment. The white oblique downwards arrows indicates phosphoproteins that coprecipitated with Src from cells treated with PDGF for 4 h, but were absent or weakly represented in immunoprecipitates from cells that had been exposed to the growth factor for 2 h. The radiolabeled phosphoprotein isolates were separated by IPHGE/SDS-PAGE, employing broad pH-range (3–10 NL) dry strips in the first dimension.
Both qualitative and quantitative differences were observed between the groups of phosphoproteins that coimmunoprecipitated with Src from [33P]-orthophosphate labeled 3T3 cells stimulated with EGF, IGF-1, and PDGF, and the pattern of coisolated phosphoproteins showed temporal variations (Fig. 3E). GF-stimulation in the presence of the Src-specific inhibitor SU6656 (2 μm) strongly reduced both the number and amount of coprecipitated phosphoproteins (Fig. 3E), suggesting that the majority of the interacting proteins are Src kinase substrates. The results imply that the three growth factors not only generate different Src kinase activities, they also direct the kinase toward slightly different repertoires of substrates. Although the number of coisolated phosphoproteins was reduced in immunoprecipitates from cells treated with EGF and IGF-1 for 4 h compared with the numbers found at the 2 h time point, several new phosphoproteins were coprecipitated from PDGF-stimulated cells after 4 h (white oblique arrows in Fig. 3E). This finding further supports the notion that PDGF-induces a longer-lasting activation of Src kinase than EGF and IGF-1.
Following both short and long-term GF-treatment, the highest levels of 33P-incorporation were found in cells stimulated or costimulated with PDGF and were distinct from those induced by long-term stimulation with EGF or IGF-1 (supplemental Fig. S6). Notably, [33P]-orthophosphate labeling experiments revealed that receptor costimulation influenced the specificity, strength and kinetics of RTK-mediated phospho-signaling (Fig. 4), which might explain the enhancing and suppressive effects receptor coactivation instigates on de novo protein synthesis.
Fig. 4.

A, Analysis of changes in phosphorylation patterns induced by stimulation with EGF, PDGF or both. Synchronized cells were grown to ∼70% confluence and labeled with 0.1 mCi/ml [33P]-orthophosphate for 4 h before GF stimulations. The radiolabeled proteins were separated by IEF/SDS-PAGE, transferred to PVDF-membranes and visualized by phosphoimaging. PDGF induced the strongest increase in 33P-incorporation into the commonly induced phosphoprotein isoforms, indicating that PDGF induces phosphorylation of more copies of the proteins than EGF at both time points. The number of phospho-proteins induced by PDGF stimulation was also higher than the number induced by EGF. Receptor costimulation influenced both the specificity and strength of protein phosphorylation at the 10 and 30 min time points. Examples of PDGF-regulated phosphorylations that were influenced by costimulation with EGF and vice versa are indicated by the arrows. B, two-dimensional immunoblotting with phosphotyrosine-specific antibody demonstrating a reduction in the number and abundance of tyrosine phosphorylated proteins in costimulated cells (black arrows), those unaffected by costimulation (while oblique arrow), and those increased in costimulated cells (white upward arrows). C, EGF and PDGF treatment also triggered dephosphorylation of proteins that were phosphorylated in unstimulated, serum-starved cells.
The Effect of Kinase Inhibitors On RTK-induced Protein Synthesis and Phosphorylation
To further understand how these phosphorylation events are regulated and how they affect protein synthesis, cells were treated with kinase inhibitors targeting PI3K (LY294002), mTOR (Rapamycin), c-Src (SU6656), MEK (PD98059), ROCK (Y-27632), and MLCK (ML-7) before GF-stimulation and metabolic labeling with 33P-ortho-phosphate and/or [35S]methionine/cysteine. LY294002 treatment had the most profound effect on the PDGF-regulated phosphoproteome, as illustrated by comparison of the alterations induced by LY294002, ML-7 or rapamycin with EGF treatment (supplemental Fig. S6). Consistent with this, the rate of protein synthesis in PDGF treated cells was significantly reduced in the presence of LY294002 (Fig. 5A), indicating that the PI3K/Akt signaling pathway is critical for PDGF's ability to control proteome composition in 3T3 fibroblasts. One particularly relevant target of PDGF-induced protein synthesis (that was reversed by LY294002 treatment) was identified as eukaryotic translation elongation factor 2 (eEF2) (Fig. 5A). Cluster analysis showed that the images from cells treated with PDGF for 18 h in the presence of LY294002 were more similar to those from cells treated with EGF alone (Fig. 5B), whereas those treated with PDGF in the presence of the MEK inhibitor PD98059, clustered with the images from cells exposed to two growth factors for a similar length of time (Fig. 5C). Our results thus identify PI3K as an early point of signal diversification in Swiss 3T3 fibroblasts and imply that lipid kinase activity is critical for the regulation of delayed protein synthesis in PDGF-activated cells.
Fig. 5.

A, 35S-autoradiograms demonstrating kinase inhibitor-induced modulation in PDGF-regulated protein synthesis at the 18 h time point. Newly synthesized EF2 isoforms are boxed by white rectangles. The abundance of newly synthesized in general were less affected by inhibition of MEK or TOR than by inhibition of the PI3K/Akt pathway in cells exposed to long-term PDGF treatment. Newly synthesized eEF2 isoforms are indicated by white boxes. B, Hierarchical clustering analysis of protein synthesis in cells treated with EGF or PDGF for 6, 12, and 18 h, or cells treated with PDGF in the presence of LY290042 for 18 h. The resulting 2DE images were clustered according to similarities between all radiolabeled protein spots. C, Clustering analysis demonstrating that cells treated with PDGF for 18 h in the presence of the MEK inhibitor PD98059 clustered in proximity to images from cells exposed to two growth factors.
Phospho radiolabeling with kinase inhibitor and phosphatase treatments, revealed that PDGF-specific phospho-forms of the histone chaperone nucleosome assembly protein-1 like-1 (NAP1L1) and protein chaperone HSP73 were regulated via PI3K/Akt-dependent signaling (supplemental Fig. S7). For example, the abundance of the acidic HSP73 phospho-form in PDGF-stimulated cells was reduced by simultaneous LY294002 treatment, but unaffected by treatment with rapamycin, indicating that the regulatory signals are generated downstream of Akt, but upstream of mTOR kinase (supplemental Fig. S7B).
PI3K/Akt Signaling Suppresses the Synthesis and Expression of AAA-family Member 26S Protease Regulatory Subunit 7
Nine of the 117 proteins identified are involved in the regulation of protein stability, including the 26S proteasome subunits β type-3, 7, 8, 9, and 13. Although all three GFs induced similar fluctuations in 26S proteasome subunit β3 synthesis, long-term EGF-stimulation induced a strong, specific reduction in COP9 signalosome subunit 4 synthesis (supplemental Fig. S8). Conversely, synthesis of 26S protease regulatory subunit 7 (PRS7) was unaltered by EGF treatment (Fig. 6A), but dominantly suppressed by PDGF or IGF-1 cotreatment (Figs. 6B and 6D), resulting in a decrease in protein levels, as assessed by analysis of fluorescent dye-stained gel images (Fig. 6F). Although treatment with the MEK inhibitor PD98059 or the TOR kinase inhibitor rapamycin had no effect on the reduced PRS7 synthesis in PDGF and/or IGF-1 stimulated cells, the suppressive effect was abrogated when GF-stimulation was performed in the presence of the PI3K inhibitor LY294002 (Figs. 6C and 6E). These results demonstrate that RTK-induced PI3K/Akt pathway activation can suppress the synthesis and expression of one of six highly related 26S proteasome ATPases that belong to the AAA family. Although primarily involved in proteasomal degradation, these ATPases have also been implicated in the regulation of transcription (26). Whether PI3K-specific PRS7 regulation exemplifies a general mechanism that enables RTKs to modify gene expression and/or protein stability by changing the abundance of AAA-family members remains to be demonstrated.
Fig. 6.
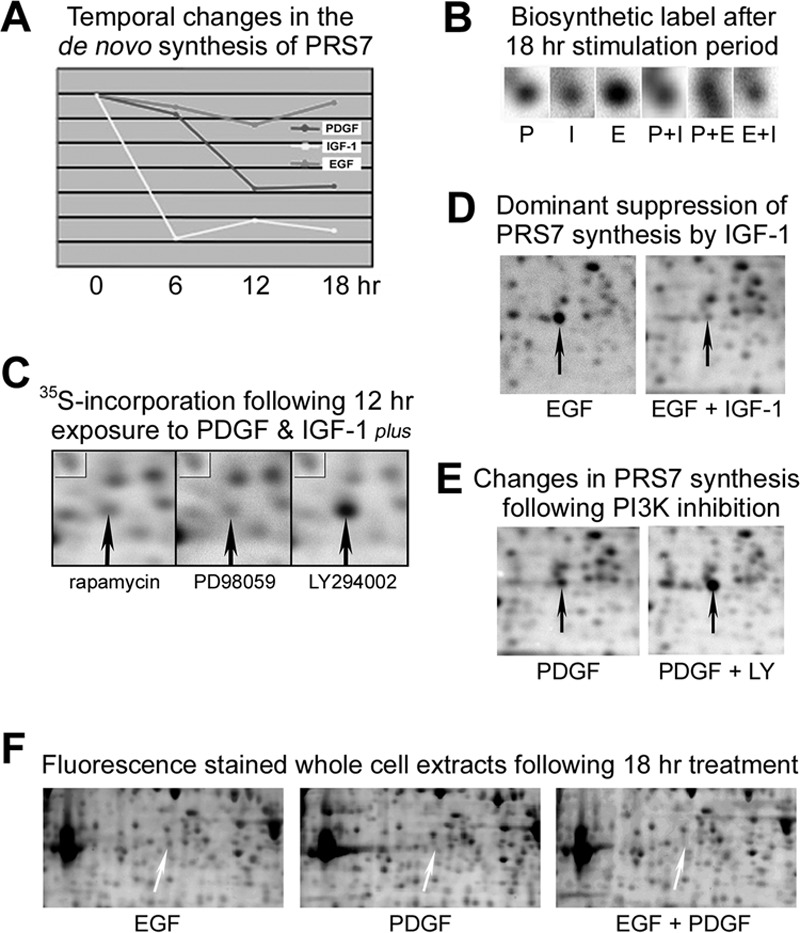
A, Graphical representation of temporal changes in 26S protease regulatory subunit 7 (PRS7) synthesis during long-term GF-stimulation. B, Enlarged area of autoradiographic images demonstrating PRS7 synthesis at the 18 h time point. C, 35S-autoradiograms demonstrating PRS7 synthesis in cells treated with PDGF and IGF-1 for 12 h in the presence of TOR, MEK, or PI3K inhibitors. Although the three inhibitors had similar effect on the synthesis of the protein indicated by a box in the upper left corner of the images, inhibition of PI3K caused a significant increase in the amount of 35S-labeled PRS7 (indicated by upward arrows). D, 35S-autoradiograms demonstrating IGF-1 dominant suppression of PRS7 synthesis in cells costimulated with EGF for 18 h. E, PRS7 synthesis in cells treated with PDGF for 18 h in the presence or absence of LY290042. F, Enlarged areas of two-dimensional gel separated whole cell extracts stained with the fluorescent dye OGT MP17 demonstrating PDGF-induced dominant suppression of PRS7 expression in costimulated cells.
IGF-1 and PDGF Enhance the De Novo Synthesis of the Receptor for Activated C Kinase-1 (RACK-1) Via the PI3K/AKT Pathway and Increase Binding of Phosphoproteins to the RACK-1 Signaling Scaffold
Given the dissimilar regulation of PI3K and PKC phospho-signaling in EGF, IGF-1, and PDGF-treated cells, a differentially regulated protein of particular interest was the receptor for activated C kinase-1 (RACK-1/GNB2L1). De novo synthesis of RACK-1 was induced by PDGF or IGF-1 and any kind of costimulation, but was suppressed by EGF (Fig. 7A and 7B). RACK-1 induction by PDGF was rapid, and the elevated rate of synthesis was maintained during continuous stimulation, whereas IGF-1 increased RACK-1 synthesis only after prolonged stimulation (Fig. 7A and 7B). Densitometry analysis of immunoblots and fluorescence-stained gels revealed that long-term exposure to PDGF and IGF-1 increased RACK-1 expression by more than 30%, whereas EGF reduced its abundance by more than 50% (Fig. 7B and 7C). Notably, RACK-1 synthesis was inhibited by LY294002, but unaffected by PD98059 or rapamycin cotreatment (Fig. 7D). Thus, PI3K/Akt-induced signals regulate RACK-1 synthesis upstream of TOR kinase, and are independent of the MAP kinase pathway.
Fig. 7.

A, Graphical representation of temporal variations in the synthesis of RACK-1 in response to different GFs. B, Enlarged area of autoradiograms demonstrating RACK-1 synthesis at the 18 h time point (upper) and immunoblotting of RACK-1 expression following 18 h GF-stimulation (lower). C, Enlarged area of fluorescence stained gels demonstrating the expression levels of RACK-1 and a glutathione-S-transferase homolog in cells treated with EGF, PDGF, or both for 18 h. The elevated expression of both proteins in response to PDGF was maintained in cells simultaneous exposed to EGF. D, Biosynthetic 35S-label analysis of RACK-1 synthesis in cells cosimulated with PDGF and IGF-1, and in cells simultaneous treated with different kinase inhibitors. E, Immunoblot analysis of immunoprecipitates and whole cell extracts. The observed copurification of PKCβII and RACK-1 with the anti-RACK-1 antibody, verified that this antibody, in contrast to the anti-PKC antibody, could be reliably employed in immunoprecipitation experiments. F, 2DE autoradiograms of [33P]-orthophosphate labeled phospho-proteins that copurified with RACK-1 in immunoprecipitates from GF-stimulated 3T3 cells. The area indicated by a white box in the IGF-1 (2 h) image shows the migration of FAK isoforms of which four were detected by immunoblotting with an antibody against pY428 of FAK (inserted image). The positions of copurified PKCβII and c-Src proteins are indicated by white boxes in the PDGF (2 h) image and were detected by immunoblotting (inserts). G, Immunofluorescence localization of RACK-1 in Swiss 3T3 cells stimulated with PDGF, IGF-1 or EGF for 18 h. RACK-1 was detected using a FITC-tagged antibody, whereas the actin cytoskeleton was visualized by rhodamine-phalloidin staining. Arrows indicate RACK-1 localized in dendritic protrusions with dense staining at cell-cell contact sites (right images).
RACK-1 was next immunoprecipitated from [33P]-orthophosphate labeled cells to investigate whether protein interactions at the RACK-1 scaffold remain susceptible to RTK-specific phospho-signals hours after initiation of GF-stimulation. Distinct patterns of RACK-1 interacting phospho-proteins were isolated from cells treated with the three growth factors for 2 or 4 h (Fig. 7F). The most abundant and diverse array of phosphoproteins was copurified with RACK-1 from cells stimulated with IGF-1 for 2 h and we were able confirm the presence of phosphorylated FAK, Src, and PKCβII in the RACK-1 immunoprecipitates (Fig. 7E and 7F). After 4 h stimulation the repertoire of strongly phosphorylated proteins bound to RACK-1 in IGF-1 treated cells had declined, whereas this was sustained, and in some cases increased, in the PDGF treated cells (Fig. 7F). This finding is consistent with the observation that PDGF produces the most robust and long-lasting phospho-activation of key signal transducers (Fig. 3). Immuno-fluorescence staining demonstrated that RACK-1 was localized to the cytosol of Swiss 3T3 fibroblasts, but was also found in the dendritic protrusions specific to long-term PDGF stimulation (Fig. 7G). Several areas of dense RACK-1 staining were seen in the retractile protrusions, mainly at sites of cell-cell contact.
PDGF-specific Control of Cytoskeleton Regulators During the Establishment of a Migratory Phenotype
Several F-actin and actomyosin regulators, including acidic calponin, gelsolin, tropomyosin, Lasp-1, septin 2, Sid23p, zyxin, fascin, and four subunits of the cytosolic chaperonin CCT were specifically regulated by PDGF. During the initial 6 h of treatment, PDGF reduced the synthesis rates of acidic calponin, gelsolin, septin 2, septin 11, Lasp-1, and Sid23p, compared with EGF and IGF-1 (Fig. 8). Moreover, the suppression of gelsolin, acidic calponin, septin, and Sid23 synthesis was dominant in costimulation experiments with PDGF and EGF or IGF-1 (supplemental Table S1). PDGF induced the most distinctive changes in the synthesis of the actomyosin regulators and septins after 12–18 h of treatment (Fig. 8), correlating with development of full morphological differentiation and induction of motility in the Swiss 3T3 fibroblasts (Fig. 1B).
Fig. 8.

A, 2DE autoradiogram of 35S-labeled proteins in IGF-1 treated cells, indicating the position of differentially regulated cytoskeletal proteins and regulators. The representative autoradiogram images at the right indicate the different synthesis rates of ten cytoskeleton proteins in GF-stimulated or costimulated cells. B, Graphic illustrations of the regulation of cytoskeletal protein synthesis in EGF, IGF-1, and PDGF treated cells.
Lasp-1, an adaptor protein involved in the regulation of specific dynamic actin-plasma membrane-associated activities (27), displayed an initial reduction in synthesis with PDGF and IGF-1 treatment, but was then dominantly increased at later timepoints with PDGF (Fig. 8). Similarly, long-term PDGF treatment was dominant in increasing the synthesis rates of four TCP-1/CCT subunits; component of the cytoskeletal protein biogenesis machinery crucial for the native folding of actin and tubulins (Fig. 8). These changes are again consistent with the induction of the retractile dendritic protrusions and development of a migratory cytoskeleton. Acidic calponin was identified from two differentially regulated protein spots migrating at apparent pIs of 5.3 and 5.1, respectively. PDGF treatment led to a reduction in the synthesis of both calponin forms compared with EGF or IGF-1 treatment, whereas the intensity of the most acidic form was increased by PDGF, but not by EGF or IGF-1 treatments (Figs. 9A–9C). This suggests that acidic calponin becomes phosphorylated following synthesis in PDGF-stimulated cells. Treatment with LY294002 reduced the abundance of both calponin forms in 35S-labeled gel images, suggesting that calponin synthesis is in part regulated by PI3K-dependent signaling, whereas the acidic isoform was reduced by treatment with rapamycin, implicating mTOR-dependent phosphorylation (Fig. 9D).
Fig. 9.
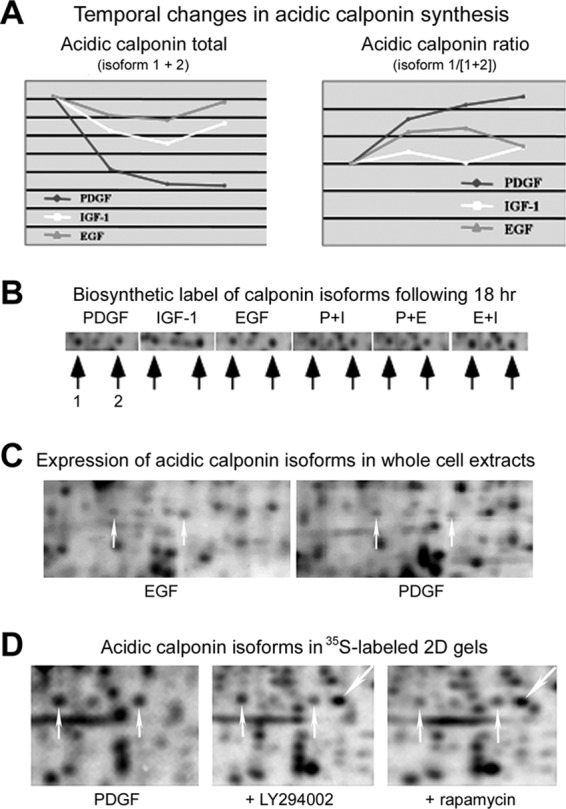
A, Graphic representations of GF-induced temporal changes in the synthesis of two acidic calponin isoforms. B, Representative autoradiogram images demonstrating the abundance of newly synthesized calponin forms in GF-stimulated cells. C, Fluorescence stained gel images demonstrating reduced expression and inverse ratio between calponin isoforms in PDGF-treated, compared with EGF-treated, 3T3 cells. D, Autoradiograms showing the effects of treatment with PI3K or mTOR inhibitors on PDGF-induced calponin synthesis.
The actin-cross linking protein fascin was detected in digests from four 35S-labeled gel spots that were differentially regulated; however reliable densitometry data could only be derived from two, including the spot containing the most basic fascin form (Fig. 10A and supplemental Table S1). Although the synthesis of the two fascin isoforms remained unaltered in IGF-1 stimulated cells, their synthesis was slightly increased by EGF, but reduced by PDGF treatment (Fig. 10A, left). Lowered levels of fascin expression in PDGF stimulated cells was confirmed by immunoblotting and densitometry analysis of fluorescent dye-stained gels (Fig. 10B). In contrast, the ratio between the acidic and the basic isoform was increased dominantly by PDGF treatment and displayed a biphasic profile with elevations following 6 and 18 h of exposure to PDGF (Fig. 10A, right). Two-dimensional immunoblotting suggested up to five isoforms of fascin were generated in response to GF treatment, with the response much lower in EGF-treated cells (Fig. 10C). The PDGF and IGF-1 induced modifications and expression were attenuated by treatment with either LY294002 or PD184352 (a specific inhibitor of MEK), with LY294002 producing the greatest effect on the ratio between the putative phosphorylated isoforms. These findings suggest that fascin is phosphorylated at multiple sites via a PI3K-dependent pathway. Immunofluorescence experiments localized fascin to the cytosol, with high abundance in the perinuclear area of Swiss 3T3 fibroblasts and in the dendritic protrusions of PDGF-stimulated cells, where distinct areas of dense staining were observed (Fig. 10D). This supports a role for fascin in the extension and retraction of these unique protrusions, whose full development coincide with the observed late increase in the ratio between the acidic and basic isoforms of fascin (Fig. 10A, bottom right).
Fig. 10.
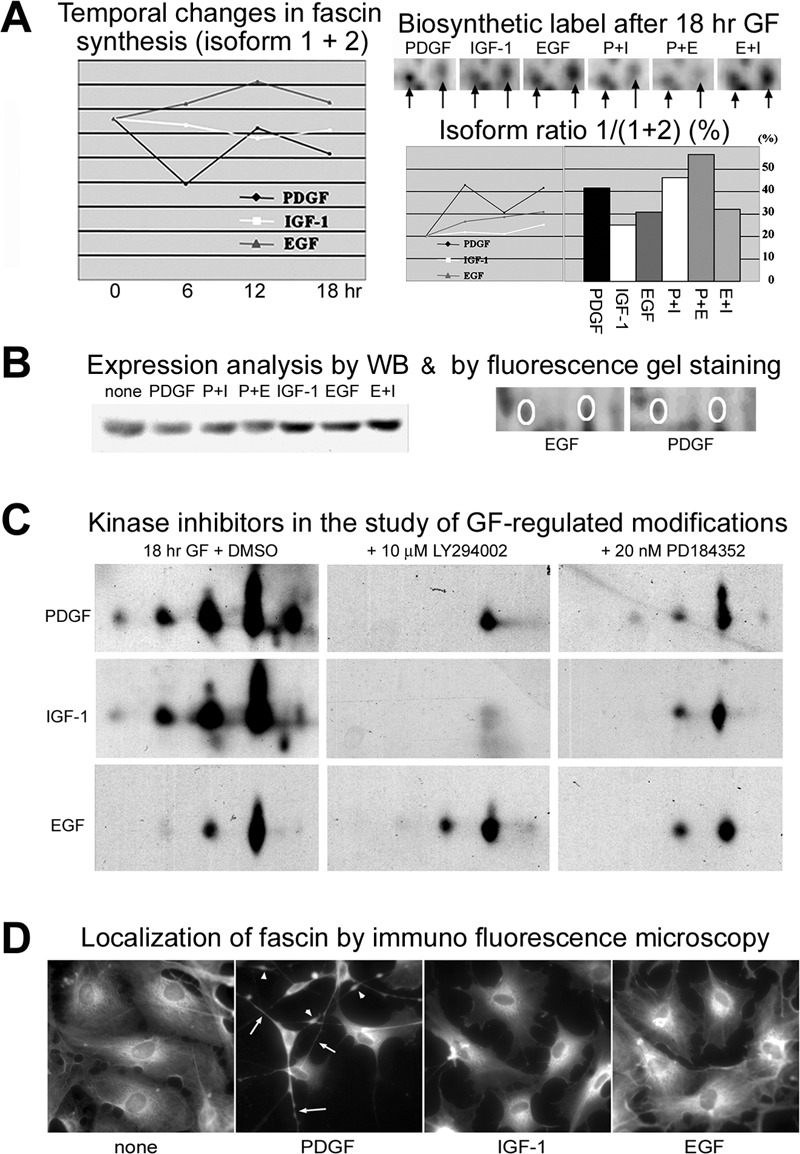
A, Graphic representation of temporal variations in de novo synthesis of two fascin isoforms. The combined density of the two spots is given at the left, whereas changes in the ratio between the isoforms are illustrated to the right. B, Western blot analysis of fascin expression following GF-treatment (left) and postelectrophoretic protein staining with the fluorescent dye OGT MP17 used to examine the expression of the two fascin isoforms in EGF and PDGF stimulated cells (right). C, Immunoblotting of fascin isoforms in cells stimulated with PDGF, IGF-1 or EGF in the presence or absence of kinase inhibitors. D, Localization of fascin in PDGF, IGF-1, and EGF-stimulated cells. Cells were stained with anti-fascin antibody following 18 h GF stimulation. Arrows show the localization of fascin in dendritic protrusions, and arrowheads indicate dense areas of staining within protrusions.
Because several of the differentially regulated proteins identified are known calcium-dependent regulators of actin polymerization and actomyosin ATPase activity (namely acidic calponin, gelsolin, and tropomyosin), Ca2+ binding capacity was next examined using a two-dimensional 45Ca-overlay strategy. Although preliminary, this analysis revealed specific differences in the response to different GF treatments (supplemental Fig. S9). Similarly, a Fura-2 binding experiment revealed different levels of free intracellular calcium in cells stimulated with the three growth factors (data not shown). It is thus tempting to speculate that the GF-specific changes in the expression of these actomyosin regulators are also coordinated through alterations in calcium-dependent signaling.
DISCUSSION
This multiplexed proteomic study has revealed that although activation of distinct RTKs induce broadly overlapping patterns of protein synthesis, with some synergy displayed in response to costimulation, small subsets of the proteome show specific and differential regulation in response to individual growth factors, and that this is likely to determine specific biological outcomes of signaling from different RTKs. We observed a range of distinct regulatory patterns, the majority of which can be explained by differences in timing, strength and duration of their inducing signals, with PI3K activation representing an important point of signal diversification for PDGF versus EGF or IGF-1 signaling. The findings imply that the phenotypic outcome from GF-stimulation depends on the corresponding receptor's ability to sustain distinct signaling activities during long-term exposure to the ligand.
Simultaneous activation of two or more RTKs was also shown to modify protein synthesis and phospho-signaling events. Costimulation experiments showed that for some proteins, one GF could have a dominant regulatory effect over the others and was particularly apparent in the case of PDGF-mediated modulation of the cytoskeleton regulators. Moreover, these dominant regulatory effects correlated with the timing of PDGF-specific changes to the Swiss 3T3 fibroblast actin cytoskeleton and conversion to a migratory cell type. Costimulation with EGF and IGF-1 also resulted in both additive and synergistic increases in protein syntheses, and correlated with similar phenotypic effects, such as cytoskeletal rearrangement.
This study has also identified several novel regulatory pathways, particularly those involving PDGF-induced PI3K-dependent signaling. For example, the apparent regulated phosphorylation and synthesis of the histone chaperone nucleosome assembly protein-1 like-1 (NAP1L1) is novel, and suggests that chromatin modulation may be required in determining specific responses to PDGF in Swiss 3T3 fibroblasts. Likewise, PDGF and IGF-1 both repressed the synthesis of PRS7, a component of the 26S proteasome. This was reflected in a reduced level of PRS7 protein expression and could be blocked by inhibition of the PI3K/Akt pathway, but was independent of MAPK activity. The synthesis of several other proteasome subunits was also differentially modulated. Although this may in turn feed forward to regulate protein turn-over and hence the expression and activity of other identified proteins, there is some evidence implicating these proteasomal proteins in the regulation of transcription initiation and activator destruction (26), and this may be an alternative mechanism by which specific growth factors can differentially regulate protein expression in a PI3K-dependent manner. Another protein whose expression was regulated by PI3K/Akt signaling was RACK-1, a scaffold protein involved in the recruitment and regulation of a variety of signaling molecules (28), some of which have been demonstrated here. RACK-1 may promote cell spreading and migration through the recruitment and regulation of PKCβII, PI3K, RhoA, Src, and FAK. Notably, RACK-1 also interacts with IGF-1R to modulate IGF-1-dependent integrin signaling, with RACK-1 overexpression in fibroblasts resulting in increased cell spreading, stress fibers, and focal adhesions and reduced IGF-1-dependent cell proliferation (29). We speculate that the observed changes in RACK-1 synthesis may at least in part explain the prolonged activation of PKCβII, Akt, and Src observed in PDGF stimulated cells (Fig. 3), which in turn may promote the PDGF-dependent migratory phenotype. This is supported by previous work showing that RACK-1 regulates integrin-mediated adhesion, protrusion, and cell migration via its Src-binding site (30), with PKC activation inducing the RACK-1-Src interaction (31) and leading to inhibition of Src activity (32). RACK-1 is also a ribosomal component, and has been shown to promote translation through recruitment of PKCβII and the subsequent phosphorylation of the translation initiation factor EIF6 (33, 34). Thus, the observed increase in RACK-1 expression in response to PDGF may also promote PKCβII recruitment and activation which in turn increases protein translation. This may at least in part explain the higher rate of de novo protein synthesis in PDGF-stimulated cells. Other studies have suggested that ribosomal RACK-1 can support miRNA-mediated gene repression (35) and nascent polypeptide-dependent translation arrest (36). Thus, it could be that PDGF-induced RACK-1 expression may specifically block translation of the cytoskeletal regulators identified here (Fig. 8), to promote a motile phenotype.
With respect to activity suppression, the PDGF-specific, dominant increase in S-adenosylhomocysteine hydrolase (copper binding protein) synthesis (supplemental Fig. S5I), is also noteworthy. S-adenosylhomocysteine hydrolase is the only enzyme known to cleave S-adenosylhomocysteine, a product and a potent inhibitor of all S-adenosylmethionine-dependent transmethylation reactions. Increased S-adenosylhomocysteine hydrolase activity thus favors DNA/RNA methyltransferase activation through the removal of S-adenosylhomo-cysteine, which PDGF might exploit to silence specific genes.
As mentioned, the regulatory dominance of PDGF receptor triggering was particularly apparent with respect to the temporal induction and suppression of several regulatory cytoskeletal components that correlated with the timing of the PDGF-specific reorganization of the actomyosin cytoskeleton, the development of dendritic protrusions and the conversion into a migratory cell type. Our demonstration of PDGF-specific regulation of acidic calponin, gelsolin, Lasp-1, tropomyosin alpha-1 chain, and fascin is noteworthy, as they are known to interact functionally in regulating actin polymerization, cellular protrusions, and actomyosin ATPase activity. Tropomyosin modulates the actin severing activity of gelsolin and can, in conjunction with caldesmon, inhibit the actin-bundling activity of fascin (37–40). Likewise, interaction of acidic calponin and the Rac-activated protein caldesmon has been demonstrated and is implicated in regulation of smooth muscle cell contraction (41). The activities of fascin and gelsolin have been shown to be regulated downstream of Rac and/or Cdc42 (42–44). Because PDGF is a known activator of Rac and Cdc42, the PDGF-specific regulation of these actin modulators in determining the migratory phenotype is likely to be coordinated downstream of these small GTPases.
We also provide evidence for the differential phosphorylation of acidic calponin and gelsolin in response to PDGF versus EGF or IGF-1. For example, phosphorylation of calponin at Ser175 by PKC inhibits its actin binding capacity and attenuates its ability to inhibit actomyosin ATPase (45, 46). The prolonged PKC activation and increased calponin phosphorylation observed in PDGF-stimulated cells may thus alleviate inhibition of actomyosin ATPase activity, allowing the high actin-myosin cross-bridge cycling rate necessary for cell contraction and motility. Calcium binding is also likely to play a role in regulating these actin modulators, and we provide preliminary evidence of GF-specific differences in calcium-binding capacity. Indeed, calcium is known to increase the association between calponins and caldesmon for regulation of smooth muscle cell contraction (41), with calponin also stimulating actin polymerization and bundling to stabilize actin microfilaments (47, 48).
Taken together the results imply that the morphological transformation induced by PDGF is achieved via concerted changes in the expression pattern and activity of key actomyosin regulators that become increasingly apparent during long-term GF-treatment. This suggests that once GF-specific reorganization of the actin cytoskeleton is achieved, its maintenance involves controlled expression of key cytoskeletal components through the prolonged activation of multiple signaling cascades. The observations that Src inhibition blocked the PDGF-induced motile phenotype and PDGF treatment induced a relatively sustained phospho-activation (Y424) and transient phospho-inhibition (Y535) of Src, is consistent with a recent report showing that PDGF regulates two spatially distinct pools of Src kinases which control different biological outcomes (i.e. cell growth and morphological change) in NIH 3T3 fibroblasts (49). Src kinases also facilitate the formation of focal adhesion complexes, and it is tempting to speculate that PDGF-induced signaling leads to temporary silencing of localized Src kinase pools in the proximity to FA complexes (perhaps through RACK-1 interaction), whereas simultaneously activating Src kinases in other compartments to promote the motile phenotype. We thus propose an initial, rapid demolition of existing higher order structures such as actin SF and FA complexes in response to PDGF, facilitated by short-term inhibition of FAK and cofilin activities, and a Src-induced, MIR-mediated ubiquitination and subsequent degradation of MRLC (15). The second more prolonged reorganization phase is characterized by specific temporal changes in the synthesis and expression of key cytoskeletal components to direct the assembly of a motile cytoskeleton, independent of EGF and IGF-1-induced antagonistic signaling activities.
Finally, the study also emphasizes that quantitative differences in the density of 35S-labeled protein spots on two-dimensional gels do not simply reflect temporal changes in protein synthesis, but also reflect changes in post-translational modifications that alter the migration of newly synthesized proteins or change their stability. For this reason, biosynthetic labeling experiments must be combined with the analysis of expression levels (e.g. by fluorescence gel staining and immunoblotting), degradation rates (e.g. by CHX-chase experiments) and post-translational modifications (e.g. by post-translational modification-specific radiolabeling procedures, immunoblotting, and selective modification of signal transduction pathway activities), before ligand-specific regulation of proteins can be correctly interpreted by two-dimensional gel-based proteomic approaches.
Supplementary Material
Footnotes
* This work was funded by the Ludwig Institute for Cancer Research, and by a grant from the Karen Elise Jensen Foundation to Soren Naaby-Hansen. Rob Stein and John Timms are supported by the UCLH/UCL Comprehensive Biomedical Research Centre.
 This article contains supplemental Table S1 and Figs. S1 to S9.
1 The abbreviations used are:
- RTK
- receptor tyrosine kinase
- GF
- growth factor
- GFR
- growth factor receptor
- EGF
- epidermal growth factor
- IGF-1
- insulin-like growth factor 1
- PDGF
- platelet-derived growth factor
- TGF
- transforming growth factor
- PI3K
- phosphoinositide 3-kinase
- AKT
- serine/threonine kinase PKB
- mTOR
- mammalian target of rapamycin
- eEF2
- eukaryotic translation elongation factor 2
- NAP1L1
- nucleosome assembly protein-1 like-1
- PRS7
- 26S protease regulatory subunit 7
- RACK-1
- receptor for activated C kinase-1
- Hsp
- heat shock protein
- PLC
- phospholipase C
- SHP2
- tyrosine-specific protein phosphatase
- GAP
- GTPase-activating protein
- MAPKs
- mitogen-activated protein kinases
- Erk1/2
- p38 and MEK, different members of the MAPK-family of serine/threonine protein kinases
- PKC
- protein kinase C
- STATs
- signal transducers and activators of transcription
- FAK
- focal adhesion kinase
- MLCK
- myosin light chain kinase
- ROCK
- Rho-associated protein kinase 1
- TCP-1/CCT
- T-complex protein 1
- Lasp-1
- LIM and SH3 domain protein 1
- Sid23
- actin-depolymerizing factor Destrin
- CHX
- cycloheximide
- TSA
- trichostatin A
- 5aC
- 5-azacitidine
- SH2
- Src homology 2 domain
- PTB
- phosphotyrosine-binding domain.
REFERENCES
- 1. Pawson T., Saxton T. M. (1999) Signaling networks–do all roads lead to the same genes? Cell 97, 675–678 [DOI] [PubMed] [Google Scholar]
- 2. Whitmarsh A. J., Davis R. J. (1998) Structural organization of MAP-kinase signaling modules by scaffold proteins in yeast and mammals. Trends Biochem. Sci. 23, 481–485 [DOI] [PubMed] [Google Scholar]
- 3. Schlessinger J. (2000) Cell signaling by receptor tyrosine kinases. Cell 103, 211–225 [DOI] [PubMed] [Google Scholar]
- 4. Fambrough D., McClure K., Kazlauskas A., Lander E. S. (1999) Diverse signaling pathways activated by growth factor receptors induce broadly overlapping, rather than independent, sets of genes. Cell 97, 727–741 [DOI] [PubMed] [Google Scholar]
- 5. Flores G. V., Duan H., Yan H., Nagaraj R., Fu W., Zou Y., Noll M., Banerjee U. (2000) Combinatorial signaling in the specification of unique cell fates. Cell 103, 75–85 [DOI] [PubMed] [Google Scholar]
- 6. Halfon M. S., Carmena A., Gisselbrecht S., Sackerson C. M., Jiménez F., Baylies M. K., Michelson A. M. (2000) Ras pathway specificity is determined by the integration of multiple signal-activated and tissue-restricted transcription factors. Cell 103, 63–74 [DOI] [PubMed] [Google Scholar]
- 7. Simon M. A. (2000) Receptor tyrosine kinases: specific outcomes from general signals. Cell 103, 13–15 [DOI] [PubMed] [Google Scholar]
- 8. Bennett A. M., Hausdorff S. F., O'Reilly A. M., Freeman R. M., Neel B. G. (1996) Multiple requirements for SHPTP2 in epidermal growth factor-mediated cell cycle progression. Mol. Cell. Biol. 16, 1189–1202 [DOI] [PMC free article] [PubMed] [Google Scholar]
- 9. Jones S. M., Klinghoffer R., Prestwich G. D., Toker A., Kazlauskas A. (1999) PDGF induces an early and a late wave of PI 3-kinase activity, and only the late wave is required for progression through G1. Curr. Biol. 9, 512–521 [DOI] [PubMed] [Google Scholar]
- 10. Marshall C. J. (1995) Specificity of receptor tyrosine kinase signaling: transient versus sustained extracellular signal-regulated kinase activation. Cell 80, 179–185 [DOI] [PubMed] [Google Scholar]
- 11. Renshaw M. W., Ren X. D., Schwartz M. A. (1997) Growth factor activation of MAP kinase requires cell adhesion. EMBO J. 16, 5592–5599 [DOI] [PMC free article] [PubMed] [Google Scholar]
- 12. Ulloa L., Doody J., Massagué J. (1999) Inhibition of transforming growth factor-beta/SMAD signalling by the interferon-gamma/STAT pathway. Nature 397, 710–713 [DOI] [PubMed] [Google Scholar]
- 13. Ridley A. J., Hall A. (1992) The small GTP-binding protein rho regulates the assembly of focal adhesions and actin stress fibers in response to growth factors. Cell 70, 389–399 [DOI] [PubMed] [Google Scholar]
- 14. Hall A. (1998) Rho GTPases and the actin cytoskeleton. Science 279, 509–514 [DOI] [PubMed] [Google Scholar]
- 15. Nagano K., Bornhauser B. C., Warnasuriya G., Entwistle A., Cramer R., Lindholm D., Naaby-Hansen S. (2006) PDGF regulates the actin cytoskeleton through hnRNP-K-mediated activation of the ubiquitin E3-ligase MIR. EMBO J. 25, 1871–1882 [DOI] [PMC free article] [PubMed] [Google Scholar]
- 16. Herman B., Pledger W. J. (1985) Platelet-derived growth factor-induced alterations in vinculin and actin distribution in BALB/c-3T3 cells. J. Cell Biol. 100, 1031–1040 [DOI] [PMC free article] [PubMed] [Google Scholar]
- 17. Chow S. C., Powis G. (1993) Mechanisms of platelet-derived growth factor-induced arachidonic acid release in Swiss 3T3 fibroblasts: the role of a localized increase in free Ca2+ concentration beneath the plasma membrane and the activation of protein kinase C. Biochim. Biophys. Acta 1179, 81–88 [DOI] [PubMed] [Google Scholar]
- 18. Rankin S., Rozengurt E. (1994) Platelet-derived growth factor modulation of focal adhesion kinase (p125FAK) and paxillin tyrosine phosphorylation in Swiss 3T3 cells. Bell-shaped dose response and cross-talk with bombesin. J. Biol. Chem. 269, 704–710 [PubMed] [Google Scholar]
- 19. Naaby-Hansen S., Flickinger C. J., Herr J. C. (1997) Two-dimensional gel electrophoretic analysis of vectorially labeled surface proteins of human spermatozoa. Biol. Reprod. 56, 771–787 [DOI] [PubMed] [Google Scholar]
- 20. Scadden A. D., Naaby-Hansen S. (2001) Analysis of ribonucleases following gel electrophoresis. Methods Enzymol. 341, 126–141 [DOI] [PubMed] [Google Scholar]
- 21. Shevchenko A., Wilm M., Vorm O., Mann M. (1996) Mass spectrometric sequencing of proteins silver-stained polyacrylamide gels. Anal. Chem. 68, 850–858 [DOI] [PubMed] [Google Scholar]
- 22. Page M. J., Amess B., Townsend R. R., Parekh R., Herath A., Brusten L., Zvelebil M. J., Stein R. C., Waterfield M. D., Davies S. C., O'Hare M. J. (1999) Proteomic definition of normal human luminal and myoepithelial breast cells purified from reduction mammoplasties. Proc. Natl. Acad. Sci. U.S.A. 96, 12589–12594 [DOI] [PMC free article] [PubMed] [Google Scholar]
- 23. Harris R. A., Yang A., Stein R. C., Lucy K., Brusten L., Herath A., Parekh R., Waterfield M. D., O'Hare M. J., Neville M. A., Page M. J., Zvelebil M. J. (2002) Cluster analysis of an extensive human breast cancer cell line protein expression map database. Proteomics 2, 212–223 [DOI] [PubMed] [Google Scholar]
- 24. Nagano K., Masters J. R., Akpan A., Yang A., Corless S., Wood C., Hastie C., Zvelebil M., Cramer R., Naaby-Hansen S. (2004) Differential protein synthesis and expression levels in normal and neoplastic human prostate cells and their regulation by type I and II interferons. Oncogene 23, 1693–1703 [DOI] [PubMed] [Google Scholar]
- 25. Benvenuti S., Cramer R., Quinn C. C., Bruce J., Zvelebil M., Corless S., Bond J., Yang A., Hockfield S., Burlingame A. L., Waterfield M. D., Jat P. S. (2002) Differential proteome analysis of replicative senescence in rat embryo fibroblasts. Mol. Cell. Proteomics 1, 280–292 [DOI] [PubMed] [Google Scholar]
- 26. Gonzalez F., Delahodde A., Kodadek T., Johnston S. A. (2002) Recruitment of a 19S proteasome subcomplex to an activated promoter. Science 296, 548–550 [DOI] [PubMed] [Google Scholar]
- 27. Chew C. S., Parente J. A., Jr., Chen X., Chaponnier C., Cameron R. S. (2000) The LIM and SH3 domain-containing protein, lasp-1, may link the cAMP signaling pathway with dynamic membrane restructuring activities in ion transporting epithelia. J. Cell Sci. 113 (Pt 11), 2035–2045 [DOI] [PubMed] [Google Scholar]
- 28. Adams D. R., Ron D., Kiely P. A. (2011) RACK1, A multifaceted scaffolding protein: Structure and function. Cell Commun. Signal. 9, 22. [DOI] [PMC free article] [PubMed] [Google Scholar]
- 29. Hermanto U., Zong C. S., Li W., Wang L. H. (2002) RACK1, an insulin-like growth factor I (IGF-I) receptor-interacting protein, modulates IGF-I-dependent integrin signaling and promotes cell spreading and contact with extracellular matrix. Mol. Cell. Biol. 22, 2345–2365 [DOI] [PMC free article] [PubMed] [Google Scholar]
- 30. Cox E. A., Bennin D., Doan A. T., O'Toole T., Huttenlocher A. (2003) RACK1 regulates integrin-mediated adhesion, protrusion, and chemotactic cell migration via its Src-binding site. Mol. Biol. Cell 14, 658–669 [DOI] [PMC free article] [PubMed] [Google Scholar]
- 31. Chang B. Y., Harte R. A., Cartwright C. A. (2002) RACK1: a novel substrate for the Src protein-tyrosine kinase. Oncogene 21, 7619–7629 [DOI] [PubMed] [Google Scholar]
- 32. Chang B. Y., Conroy K. B., Machleder E. M., Cartwright C. A. (1998) RACK1, a receptor for activated C kinase and a homolog of the beta subunit of G proteins, inhibits activity of src tyrosine kinases and growth of NIH 3T3 cells. Mol. Cell. Biol. 18, 3245–3256 [DOI] [PMC free article] [PubMed] [Google Scholar]
- 33. Grosso S., Volta V., Sala L. A., Vietri M., Marchisio P. C., Ron D., Biffo S. (2008) PKCbetaII modulates translation independently from mTOR and through RACK1. Biochem. J. 415, 77–85 [DOI] [PubMed] [Google Scholar]
- 34. Nilsson J., Sengupta J., Frank J., Nissen P. (2004) Regulation of eukaryotic translation by the RACK1 protein: a platform for signalling molecules on the ribosome. EMBO Rep. 5, 1137–1141 [DOI] [PMC free article] [PubMed] [Google Scholar]
- 35. Jannot G., Bajan S., Giguère N. J., Bouasker S., Banville I. H., Piquet S., Hutvagner G., Simard M. J. (2011) The ribosomal protein RACK1 is required for microRNA function in both C. elegans and humans. EMBO Rep 12, 581–586 [DOI] [PMC free article] [PubMed] [Google Scholar]
- 36. Kuroha K., Akamatsu M., Dimitrova L., Ito T., Kato Y., Shirahige K., Inada T. (2010) Receptor for activated C kinase 1 stimulates nascent polypeptide-dependent translation arrest. EMBO Rep 11, 956–961 [DOI] [PMC free article] [PubMed] [Google Scholar]
- 37. Ishikawa R., Yamashiro S., Matsumura F. (1989) Differential modulation of actin-severing activity of gelsolin by multiple isoforms of cultured rat cell tropomyosin. Potentiation of protective ability of tropomyosins by 83-kDa nonmuscle caldesmon. J. Biol. Chem. 264, 7490–7497 [PubMed] [Google Scholar]
- 38. Dabrowska R., Hinssen H., Galazkiewicz B., Nowak E. (1996) Modulation of gelsolin-induced actin-filament severing by caldesmon and tropomyosin and the effect of these proteins on the actin activation of myosin Mg(2+)-ATPase activity. Biochem. J. 315, 753–759 [DOI] [PMC free article] [PubMed] [Google Scholar]
- 39. Nyakern-Meazza M., Narayan K., Schutt C. E., Lindberg U. (2002) Tropomyosin and gelsolin cooperate in controlling the microfilament system. J. Biol. Chem. 277, 28774–28779 [DOI] [PubMed] [Google Scholar]
- 40. Ishikawa R., Yamashiro S., Kohama K., Matsumura F. (1998) Regulation of actin binding and actin bundling activities of fascin by caldesmon coupled with tropomyosin. J. Biol. Chem. 273, 26991–26997 [DOI] [PubMed] [Google Scholar]
- 41. Graceffa P., Adam L. P., Morgan K. G. (1996) Strong interaction between caldesmon and calponin. J. Biol. Chem. 271, 30336–30339 [DOI] [PubMed] [Google Scholar]
- 42. Azuma T., Witke W., Stossel T. P., Hartwig J. H., Kwiatkowski D. J. (1998) Gelsolin is a downstream effector of rac for fibroblast motility. EMBO J. 17, 1362–1370 [DOI] [PMC free article] [PubMed] [Google Scholar]
- 43. Adams J. C., Schwartz M. A. (2000) Stimulation of fascin spikes by thrombospondin-1 is mediated by the GTPases Rac and Cdc42. J. Cell Biol. 150, 807–822 [DOI] [PMC free article] [PubMed] [Google Scholar]
- 44. De Corte V., Bruyneel E., Boucherie C., Mareel M., Vandekerckhove J., Gettemans J. (2002) Gelsolin-induced epithelial cell invasion is dependent on Ras-Rac signaling. EMBO J. 21, 6781–6790 [DOI] [PMC free article] [PubMed] [Google Scholar]
- 45. Tang D. C., Kang H. M., Jin J. P., Fraser E. D., Walsh M. P. (1996) Structure-function relations of smooth muscle calponin. The critical role of serine 175. J. Biol. Chem. 271, 8605–8611 [DOI] [PubMed] [Google Scholar]
- 46. Danninger C., Gimona M. (2000) Live dynamics of GFP-calponin: isoform-specific modulation of the actin cytoskeleton and autoregulation by C-terminal sequences. J. Cell Sci. 113, 3725–3736 [DOI] [PubMed] [Google Scholar]
- 47. Kake T., Kimura S., Takahashi K., Maruyama K. (1995) Calponin induces actin polymerization at low ionic strength and inhibits depolymerization of actin filaments. Biochem. J. 312, 587–592 [DOI] [PMC free article] [PubMed] [Google Scholar]
- 48. Kolakowski J., Makuch R., Stepkowski D., Dabrowska R. (1995) Interaction of calponin with actin and its functional implications. Biochem. J. 306, 199–204 [DOI] [PMC free article] [PubMed] [Google Scholar]
- 49. Veracini L., Franco M., Boureux A., Simon V., Roche S., Benistant C. (2006) Two distinct pools of Src family tyrosine kinases regulate PDGF-induced DNA synthesis and actin dorsal ruffles. J. Cell Sci. 119, 2921–2934 [DOI] [PubMed] [Google Scholar]
Associated Data
This section collects any data citations, data availability statements, or supplementary materials included in this article.