

Abstract
Adipose triglyceride lipase (ATGL) and hormone-sensitive lipase (HSL) are key enzymes involved in intracellular degradation of triacylglycerols. It was the aim of this study to elucidate how the deficiency in one of these proteins affects the residual lipolytic proteome in adipose tissue. For this purpose, we compared the lipase patters of brown and white adipose tissue from ATGL (−/−) and HSL (−/−) mice using differential activity-based gel electrophoresis. This method is based on activity-recognition probes possessing the same substrate analogous structure but carrying different fluorophores for specific detection of the enzyme patterns of two different tissues in one electrophoresis gel. We found that ATGL-deficiency in brown adipose tissue had a profound effect on the expression levels of other lipolytic and esterolytic enzymes in this tissue, whereas HSL-deficiency hardly showed any effect in brown adipose tissue. Neither ATGL- nor HSL-deficiency greatly influenced the lipase patterns in white adipose tissue. Enzyme activities of mouse tissues on acylglycerol substrates were analyzed as well, showing that ATGL-and HSL-deficiencies can be compensated for at least in part by other enzymes. The proteins that responded to ATGL-deficiency in brown adipose tissue were overexpressed and their activities on acylglycerols were analyzed. Among these enzymes, Es1, Es10, and Es31-like represent lipase candidates as they catalyze the hydrolysis of long-chain acylglycerols.
Excess lipids are stored as intracellular triacylglycerol and steryl ester deposits in animals, plant seeds, and fungi. In mammals adipose tissue is the body's largest storage organ for triacylglycerols (TAG)1 as the primary source of energy during periods of starvation and increased energy demand. Two types of adipose tissue, namely brown (BAT) and white (WAT) adipose tissue exist in mammals, localizing to anatomically distinct areas. BAT and WAT differ in almost all their structural and functional features. Whereas BAT develops prenatally, WAT is subject to maturation postnatally. The different appearance of brown and white adipose tissue is caused by differences in lipid content and the abundance of mitochondria in the constituent adipocytes. Brown fat cells contain several small multilocular lipid droplets and a high number of large mitochondria with numerous cristae. In addition, BAT is highly vascularized and highly innervated by the sympathetic nervous system. In contrast, white adipocytes, usually contain one major unilocular lipid droplet that fills most of the cytoplasm leaving space for only few mitochondria (1–3). WAT accumulates excess energy as triacylglycerols, whereas BAT dissipates energy through adaptive thermogenesis. The thermogenic activity of BAT is caused by the expression of one protein unique in brown adipocytes, the uncoupling protein 1 (UCP1). This polypeptide is a facultative proton transporter and localizes to the inner mitochondrial membrane. It generates heat instead of ATP by uncoupling oxidation in the respiratory chain (3).
Lipolysis in WAT is the catabolic process responsible for the release of free fatty acids from triacylglycerol (4, 5). The balance of lipid storage and mobilization is tightly regulated to ensure whole body energy homeostasis. The mobilization of triacylglycerol stores by activation of lipolytic enzymes is specifically stimulated by hormones and chemical agents. In addition, a number of specific physiological conditions owing to exercise, aging, and nutritional status (feeding, fasting) also regulate degradation of TAGs (6). Impairment of lipolysis in adipocytes may be associated with clinical symptoms including obesity, insulin resistance, diabetes mellitus, and dyslipidaemia. All these conditions seem to have a common substrate called lipotoxicity (7–10).
The sequential hydrolysis of triacylglycerols in adipocytes producing FFAs is catalyzed by a cascade of lipolytic enzymes, with different substrate preferences (11). The committed enzyme catalyzing the first step of TAG hydrolysis is ATGL, which was identified in three different laboratories in 2004 (12–14). Its activity appears to be largely dependent on association with CGI-58 (14, 15). HSL exhibits a much broader substrate spectrum, with preference for diacylglycerols as well as cholesteryl and retinyl esters (16, 17). In the final step of lipolysis, monoacylglycerol lipase (MGL) degrades MAG thereby generating free fatty acid and glycerol (18). ATGL is the major TAG lipase in adipose tissue. Expression in other tissues is rather low. Currently it cannot be excluded, that other lipases also exist that are important for lipid catabolism (19). Recent functional proteomic screens in various mouse tissues led to the identification of enzyme candidates that are currently subject to functional characterization (unpublished data).
The intracellular degradation of triacylglycerols is catalyzed by a cascade of lipolytic enzymes. There appears to be an overlap of substrate preferences as well as a redundancy of lipases to ensure a proper function of this important catabolic process if individual lipase activities are reduced or entirely absent. This study aimed at identifying the effects of ATGL and HSL-deficiency on the expression of other lipolytic enzymes in adipose tissue. For this purpose, we compared the lipolytic proteomes of BAT and WAT from ATGL (−/−) and HSL (−/−) mice with the enzyme patterns of wt tissues using differential activity-based gel electrophoresis (DABGE) (20). This method is based on activity-recognition probes containing same substrate analogous structures but carrying different fluorophores for specific detection of the individual enzyme patterns of two different tissues. These inhibitors react with the nucleophilic serine in the active center of lipolytic enzymes thereby generating covalent bound lipid-protein complexes, which can be separated by gel electrophoresis. We found, that ATGL-deficiency in BAT had a profound effect on the expression levels of other lipolytic and esterolytic enzymes in this tissue, whereas HSL-deficiency hardly showed any effect in BAT. Neither ATGL- nor HSL-deficiency greatly influenced the lipase patterns in WAT. ATGL-deficiency led to a significant but not total reduction in the TAG hydrolyzing activity of adipose tissues. Obviously, there must be (an)other enzyme(s) compensating for the hydrolytic capacity of ATGL. Three proteins that responded to ATGL-deficiency in BAT were overexpressed and their activities on acylglycerols were analyzed. Among these proteins, Es1, Es10, and Es31-like emerged as novel lipase candidates in these studies.
EXPERIMENTAL PROCEDURES
Animals
ATGL-deficient (ATGL-ko) and HSL-deficient (HSL-ko) mice were generated by targeted homologous recombination (21, 22). Nontransgenic littermates expressing two intact alleles of mouse HSL were used as wild-type (wt) control. All animals were maintained on a regular light-dark cycle (14 h light, 10 h dark) and kept on a standard laboratory chow diet containing 4.5% fat and 21% protein (SSNIFF, Germany) with free access to water. Fat pads were collected from fed (free access to food over night) or fasted (food was removed for 20 h) animals aged between 3–6 months between 9:00 and 10:00 a.m. All procedures in this study were in conformity with the Public Health Service Policy on the use of Laboratory Animals and were approved by local ethical committees.
Cell Fractionation of Mouse Adipose Tissue
Gonadal fat pads (white adipose tissue) and brown adipose tissue of fed and fasted mice were surgically removed and washed in phosphate buffered saline (PBS). Homogenization was performed on ice in lysis buffer (0.25 m sucrose, 1 mm EDTA, 1 mm dithioerythritol, 20 μg/ml leupeptin, 2 μg/ml antipain, 1 μg/ml pepstatin) using a motor-driven Teflon-glass homogenizer (8 strokes, at 1500 rpm, Schuett Labortechnik, Germany). Cell debris was removed by centrifugation at 1000 × g for 15 min to obtain cytoplasmic extracts. Protein concentration was determined using the BIORAD Protein Assay based on the method of Bradford (23).
Activity Tagging
Unless otherwise indicated, incubations of proteomes with activity tags were conducted as follows: For a sample containing 50 μg of protein, the following reagent was prepared. 5 μl of a 10 mm solution of Triton X-100 in CHCl3 (final sample concentration 1 mm) and 5 μl of activity recognition probe dissolved in CHCl3 (1 nmol/10 μl, final sample concentration 10 μm) were mixed and the organic solvent was removed under a stream of argon. Fifty microliters of homogenate (1.0 mg/ml protein) were added and the resulting mixture was incubated at 37 °C under light protection for 2 h. Wild-type and knock-out were labeled with Cy3- and Cy5- tagged ARPs, respectively, and vice versa in a dye-swap experiment. 1:1 (protein amount) mixtures of wild-type and knock-out tissue homogenates were labeled with Cy2b-tagged inhibitor as an internal standard. The samples were mixed, proteins were precipitated in 10% ice-cold trichloroacetic acid on ice for 1 h and collected by centrifugation at 4 °C at 14000 g for 15 min. The pellet was washed once with ice-cold acetone and resuspended in sample buffer for 1D SDS-PAGE (20 mm KH2PO4, 6 mm EDTA, 60 mg/ml SDS, 100 mg/ml glycerol, 0.5 mg/ml bromophenol blue, 20 μl/ml mercaptoethanol, pH 6.8) or sample buffer for 2D PAGE (7 m urea, 2 m thiourea, 4% 3-[(3-cholamidopropyl)dimethylammonio]propanesulfonate, 2% Pharmalyte 3–10). Before loading onto the gel, the samples for 1D SDS-PAGE were heated to 95 °C for 5 min.
SDS-PAGE and 2D-gelelectrophoresis
SDS-PAGE was performed essentially according to the method of Fling and Gregerson (24) using a Tris/glycine buffer system. Proteins (15 μg protein/lane) were applied onto a 5% stacking gel and separated in a 10% resolving gel at 20 mA constant current (BIORAD Mini PROTEAN 3), respectively. 2D-gelelectrophoresis was performed as described by Görg et al. (25–27). In the first dimension, 45 μg or 510 μg protein were separated by isoelectric focusing in 7 cm or 18 cm immobilized nonlinear pH 3–10 gradients (IPG-strips, GE Healthcare, Germany) using Amersham Biosciences Multiphor II (GE Healthcare). Isoelectric focusing was performed using a discontinuos voltage gradient starting at 0 V reaching 200 V within the first minute. The voltage was then increased to 3500 V during the following 1.5 h, and held at this level for another 1.5 h.
In the second dimension, proteins were separated by 10% SDS-PAGE on 7 cm gels at 20 mA constant current for 1.5 h.
Visualization
Gels were fixed in 7.5% acetic acid and 10% ethanol and scanned at a resolution of 100 μm (BIORAD Molecular ImagerTM FX Pro Plus). Cy2b fluorescence was detected at 530 nm and an excitation wavelength of 488 nm. Cy3 fluorescence was determined at 605 nm and an excitation wavelength of 532 nm. Cy5 fluorescence was measured at 695 nm and an excitation wavelength of 633 nm. For visualization of the whole protein pattern, gels were stained with RuBPS following the manufacturer's instructions (Molecular Probes, Eugene OR) and scanned at an emission wavelength of 605 nm and an excitation wavelength of 488 nm. The signals obtained with RuBPS depended on prestaining with the Cy-tagged inhibitors. Proteins giving fluorescent lanes/spots with the ARPs showed less intense lanes/spots with RuBPS.
The PMT voltage of the Molecular Imager was individually set for each Cy-tagged inhibitor using the same sample to reach comparable fluorescence signal intensities.
Quantification of the fluorescence signals was performed using Quantity One 1D analysis software (BIORAD, Vienna, Austria) and Progenesis PG 220 versus 2006 2D analysis software (Nonlinear Dynamics, Newcastle upon Tyne, UK).
LC-MS/MS-analysis
Fluorescent protein spots were excised and tryptically digested according to the method by Shevchenko et al. (28). Peptide extracts were dissolved in 0.1% formic acid and separated on a nano-HPLC-system (FAMOS™ -autosampler, SWITCHOS™ -loading system, ULTIMATE™ - dual gradient system, LC-Packings, Amsterdam, Netherlands). Twenty-microliter samples were injected and concentrated on the loading column (LC Packings PepMap™ C-18 5 μm 100 Å, 300 μm ID × 1 mm) for 5 min using 0.1% formic acid as isocratic solvent at a flow rate of 20 μl/min. The column was then switched into the nano-flow-circuit and the sample was loaded on the nano-column (LC-Packings C-18 PepMap™ 75 μm ID × 150 mm) at a flow rate of 300 nl/min and separated using a gradient from 0.3% formic acid and 5% acetonitrile to 0.3% formic acid and 50% acetonitrile over 60 min. The sample was ionized in a Finnigan nano-ESI source equipped with NanoSpray tips (PicoTip™ Emitter, New Objective) and analyzed in a Thermo-Finnigan LCQ Deca XPplus iontrap mass-spectrometer. The MS/MS data were analyzed by searching the NCBI public database with SpectrumMill 03.03.084 SR4 (Agilent). Details and acceptance parameters can be found in the supplementary data (see supplemental file S1). Identified protein sequences were subjected to BLAST and motif search for identification of potential serine hydrolases.
cDNA Cloning and Transient Expression in COS-7 Cells
The coding sequences of HSL (NCBI Accession # 677884), Es1 (NCBI Accession # 247269928), Es10 (esterase D/formylglutathione hydrolase (NCBI Accession # 146134463)) and Es31-like (NCBI Accession # 226874913) were amplified by PCR from cDNA prepared from mouse BAT using Reverse transcription system (Promega Corporation, Madison, WI) and cloned into the eukaryotic expression vector pcDNA3.1 (Invitrogen Inc.) as described previously for HSL and ATGL (14). Transfection of COS-7 cells was performed with Metafectene™ (Biontex) according to the manufacturer's instruction. Apparent molecular weights of the proteins were about 88 kDa for HSL, 61 kDa for Es1, 35 kDa for Es10, and 63 kDa for Es31-like. Apolipoprotein A-IV was isolated from human plasma by lipoprotein depletion according to literature (29).
Lipase and Esterase Activity Assays with p-Nitrophenylester Substrates
p-Nitrophenyl acetate, butyrate, and laurate were used as substrates. Fifty millimolar substrate solutions in ethanol were prepared and stored at −25 °C. 30 μl of the substrates were added to 10 ml assay buffer (20 mm Tris/HCl, pH 8.0, 150 mm NaCl, 0.01% Triton X-100). In a 96-well microtiterplate, 1 μg protein was mixed with 200 μl of substrate solution. Absorbance at 405 nm was measured every 3 min for 30 min using a spectrophotometer (Anthos 2010, Labtec Instruments, Wals, Austria).
Lipase Activity Assays with Pyrene-labeled Tri-, Di-, and Monoacylglycerols
Solutions containing 1 μmol of pyrene-labeled acylglycerol and 1 μmol of PC/PI (3:1 mol:mol) were mixed. The solvent of the resultant solution was removed under a stream of nitrogen and the substrate was solubilized in 10 ml of 50 mm Tris/HCl buffer (pH 7.4) followed by vigorous vortexing for 5 min and pulsed sonication for 5 min. For the assay, 50 μl of the substrate solution, was diluted with 150 μl of 50 mm Tris/HCl buffer. The reaction was started by adding 50 μg of protein. The assay mixture was incubated for 1 h at 37 °C and 1000 rpm. The reaction was stopped by adding CHCl3/MeOH (2:1) and 20 μl HCl followed by vigorous vortexing for 5 min. For better phase separation, the mixture was centrifuged for 2 min at 9000 × g followed by removal of the aqueous layer. The organic solvent was removed under a stream of nitrogen and the residue was dissolved in 20 μl CHCl3. The entire organic lipid solution was applied onto a TLC plate and separated using CHCl3/EtAc (90:10, V:V) as mobile phase. The fluorescent spots were quantified with a CCD camera using an excitation wavelength of 365 nm. The amounts of the fluorescent components were determined from their respective fluorescence intensities.
RESULTS
It was the aim of this study to determine the effects of ATGL- and HSL-deficiency on the expression of other lipolytic activities in BAT and WAT. For this purpose, we analyzed the lipolytic proteomes of both tissues of ATGL- and HSL-deficient mice. The substrate preferences of the enzymes responding to lipase deficiencies were determined using synthetic mono-, di-, and triacylglycerols.
Comparative Analysis of Lipolytic Enzymes in BAT and WAT. Effects on ATGL- and HSL-Deficiency
The lipolytic proteomes of adipose tissue homogenates isolated from ATGL−/− and HSL−/− mice were analyzed and compared with the enzyme patterns of the wt tissues using the DABGE method (20). This technique was developed for the comparison of the enzyme components of two different samples in one electrophoresis gel. It is based on protein labeling with activity recognition probes (ARPs, Fig. 1) possessing the same substrate analogous structure but carrying different cyanine-dyes (Cy2b, Cy3, and Cy5) as reporter tags.
Fig. 1.

Activity recognition probes for DABGE analysis. These compounds are fluorescent suicide inhibitors. They posses the same substrate analogous structure but carry different cyanine-dyes. A, Fluorophore: Cy 2b-dye (λex: 491 nm; λem: 509 nm); B, Fluorophore: Cy 3-dye (λex: 553 nm; λem: 569 nm); C, Fluorophore: Cy5-dye (λex: 645 nm; λem: 664 nm).
In a typical experiment, the wild-type (wt) tissue was labeled with Cy3-Ethyl-P (green emission) whereas the knock-out (ko) tissue was labeled with Cy5-Ethyl-P (red emission). Both samples were labeled with Cy2b-Ethyl-P as internal standard. To avoid artifacts because of fluorescence labeling, we performed a dye-swap experiment. In this case, the wild-type and knock-out samples were labeled with the Cy5- and Cy3-Ethyl-P, respectively. After labeling, the samples were mixed as described in the method section, followed by protein precipitation and 1D or 2D gel electrophoresis. In the 2D gel some of the labeled enzymes appeared as horizontal polypeptide ladders, which are typical for post-translational modifications. For identification enzyme spots and lanes were excised from the gel, tryptically digested and analyzed by nanoHPLC-MS/MS. The fluorescence patterns of the tagged proteins on the gels were detected by laser scanning. Fig. 2 shows the fluorescence images of 1D and 2D electrophoresis gels containing the labeled BAT and WAT proteins from ATGL- and HSL-ko mice as compared with the wild-type. Active enzymes more abundant in the wt tissue appear green (red/dye-swap), those more abundant in the ko sample appear red (green/dye-swap), and enzymes which are equally abundant in both samples are yellow. The green and red fluorescence intensities of the spots were determined and the enzymes ratios of the ko versus wt mice were calculated as described before (20). Results for 2D and 1D gels are shown in Tables I and II, respectively. Detailed results are shown in supplemental files S2-S4. The raw data can be found under the following links: ftp://ftp.tugraz.at/pub/genau and http://ftp.tugraz.at/pub/genau.
Fig. 2.

Differential activity profiles of lipases of brown and white adipose tissue from ATGL and HSL-ko mice as compared to tissues from wild-type mice. The wild-type (wt) tissue was labeled with Cy3-Ethyl-P (Cy5-Ethyl-P for the dye-swap) whereas the knock-out (ko) tissue was labeled with Cy5-Ethyl-P (Cy3-Ethyl-P for the dye-swap). Equal amounts of ko and wt protein were labeled with Cy2b-Ethyl-P and mixed to prepare an internal standard. Active enzymes more abundant in the wt tissue appear green (red - dye-swap), those more abundant in the ko sample appear red (green - dye-swap). Enzymes equally abundant in both samples are yellow. The enzyme patterns are shown pairwise in 1D and 2D electrophoresis gels (A, B: ATGL−/−BAT original staining; C, D: ATGL−/− BAT dye-swap; E, F: ATGL−/− WAT original staining; G, H: ATGL−/− WAT dye-swap; I, J: HSL−/− BAT original staining; K, L: HSL−/− BAT dye-swap; M, N: HSL−/− WAT original staining; O, P: HSL−/− WAT dye-swap).
Table I. Differential lipolytic proteomes of adipose tissue from ATGL- and HSL-deficient mice (2D PAGE).
Shown are the relative ratios of enzyme activities in ATGL−/− and HSL−/− mouse adipose tissue. Reference samples were adipose tissues from wt mice. Numbers correspond to the fluorescent protein spots (2D PAGE) in Fig. 2. The relative ratios were calculated using the formula described by Morak et al. (20). Active enzymes are considered less abundant if relative ratios are lower that –1.9 and more abundant if ratios are higher than 1.9.
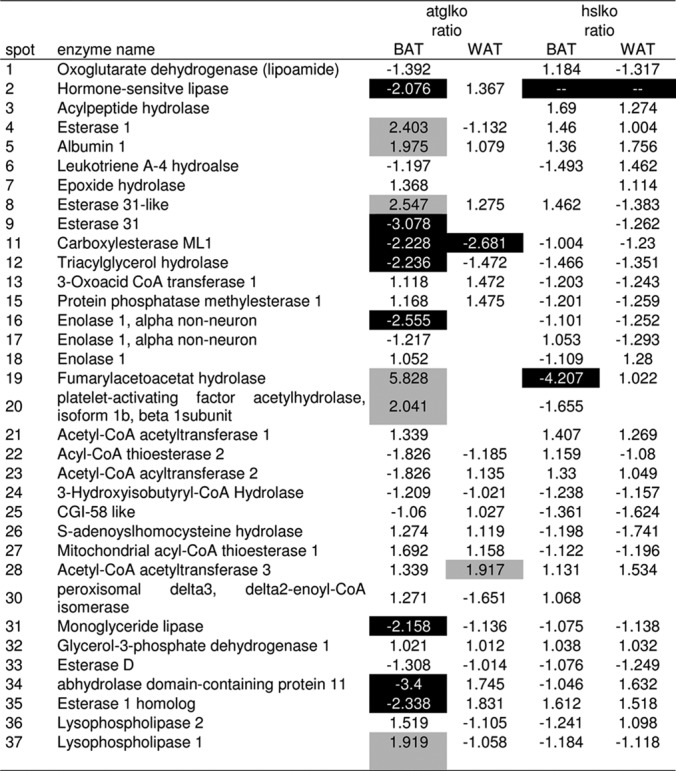
Table II. Differential lipolytic proteomes of adipose tissue from ATGL- and HSL-deficient mice (1D SDS-PAGE).
Shown are the relative ratios of enzyme activities in ATGL−/− and HSL−/− mouse adipose tissue. Reference samples were adipose tissues from wt mice. Letters correspond to the fluorescent protein lanes (1D PAGE) in Fig. 2. The relative ratios were calculated using the formula described by Morak et al. (20). Active enzymes are considered less abundant if relative ratios are lower that −1.9 and more abundant if ratios are higher than 1.9.
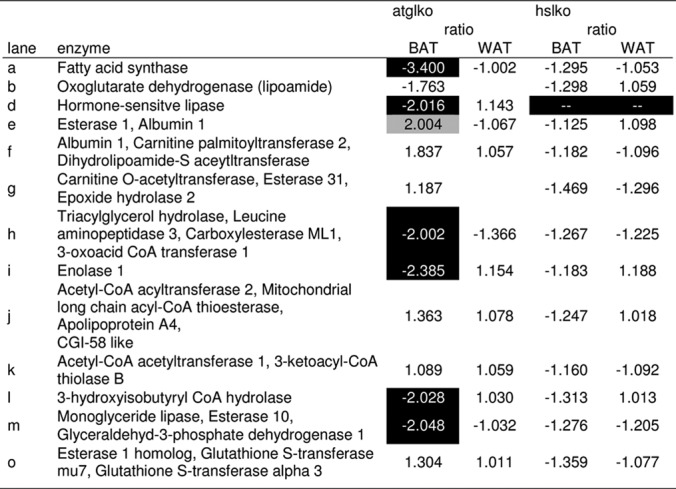
The lipolytic proteomes of brown adipose tissue are greatly influenced by ATGL-deficiency. All enzymes of the lipolytic cascade involved in the degradation of triacylglycerol (ATGL, HSL, and MGL) are less abundant in BAT of ATGL-ko mice. In addition, other enzymes are also down-regulated, including esterase 31 (Es31), carboxylesterase ML1 (CesML1), triacylglycerol hydrolase (TGH), abhydrolase domain-containing protein, 11 esterase 1 homolog (Es1 homolog), as well as enolase 1. On the other hand, several enzymes show higher activity in BAT of ATGL-deficient mice. These proteins are esterase 1 (Es1), albumin 1, esterase 31-like (Es31-like), apolipoprotein A-IV, fumarylacetoacetat hydrolase, platelet-activating factor acetylhydrolase isoform 1B beta 1 subunit (LIS), as well as lysophospholipase 1. Only a small number of enzymes is influenced by ATGL-deficiency in WAT. Under these conditions, two enzymes are expressed differently compared with the wild-type. These proteins are carboxylesterase ML1, which is down-regulated and acetyl-CoA acetyltransferase 3, which is more abundant in WAT from ATGL-ko mice.
HSL-deficiency influences the lipolytic proteome only to a very small extent. In contrast to BAT from ATGL-ko mice, HSL-deficient BAT shows significantly lower levels of fumarylacetoacetate hydrolase. The lipase/esterase patterns in HSL-deficient and wild-type WAT are very similar. In summary, ATGL-deficiency has a more profound influence on the level of other lipolytic enzymes than HSL-deficiency.
Total Lipolytic Activities of BAT and WAT from ATGL and HSL-deficient Mice
The total lipase/esterase activities of ATGL-ko, HSL-ko and wt mouse adipose tissues were determined using chemically defined substrates. On the one hand, the tissue capacity of hydrolyzing chromogenic p-nitrophenyl acetate (pNP-acetate), butyrate, and laurate was determined. The respective compounds differ with respect to polarity and represent substrates for esterases (acetate) as well as for lipases (laurate). On the other hand, acylglycerol hydrolase activities were determined using pyrene-labeled tri-, di-, and monoacylglycerols as substrates. The results (relative activities of ATGL or HSL-ko tissues versus wt) are shown in Figs. 3 and 4. The hydrolytic activities toward pNP acetate were about 50% lower in BAT from ATGL-deficient mice and about 25% lower in WAT from HSL-deficient mice as compared to wt animals. There was no difference in the activities of WAT from ATGL-ko and BAT of HSL-ko mice as compared with the wild-type. If pNP butyrate was used as substrate, the activities of tissues from knock-out and wt mice were almost the same except for BAT from ATGL-deficient mice. The latter expressed only 80% of the wild-type activity. The relative enzyme activities entirely changed if pNP laurate, which is the most hydrophobic lipid in the pNP ester series, was used as a substrate. BAT and WAT from ATGL−/− mice still showed about 65% and almost 100% activity relative to the wt, respectively. In contrast, HSL-deficiency led to a reduced lipase activity of 40 and 60% in BAT and WAT, respectively.
Fig. 3.

Lipolytic/esterolytic activities of BAT and WAT on carboxylic acid esters. Shown are the rates of substrate hydrolysis catalyzed by BAT and WAT deficient in ATGL or HSL relative to wt samples. Substrates were p-nitrophenyl acetate, butyrate and laurate. The assay was performed in a 96-well microtiterplate format. The total amount of tissue protein was 1 μg. Substrate concentration was 0.15 mm. Substrate hydrolysis was determined from the formation of p-nitrophenolate (absorption at 405 nm). Data points were collected every 3 mins during a period of 30 min (n = 12, p < 0.05 = *, p < 0.01 = **, p < 0.001 = ***).
Fig. 4.

Lipolytic activities of BAT and WAT on pyrene-tagged tri-, di-, and monoacylglycerols. Shown are the rates of substrate hydrolysis catalyzed by BAT and WAT deficient in ATGL or HSL relative to wt samples. Solutions containing 1 μmol of pyrene-labeled acylglycerol and 1 μmol of PC/PI (3:1 mol:mol) were mixed. The solvent of the resultant solution was removed under a stream of nitrogen and the substrate was solubilized in 10 ml of 50 mm Tris/HCl buffer (pH 7.4) followed by vigorous vortexing for 5 min and pulsed sonication for 5 min. For the assay 50 μl of the substrate solution, was diluted with 150 μl of 50 mm Tris/HCl buffer. The reaction was started by adding adipose tissue homogenate (50 μg protein). The assay mixture was incubated for 1 h at 37 °C and 1000 rpm. The reaction was stopped by adding CHCl3/MeOH (2:1, V:V) and 20 μl HCl followed by vigorous vortexing for 5 min. For better phase separation, the mixture was centrifuged for 2 min at 9000 × g followed by removal of the aqueous layer. The organic solvent was removed under a stream of nitrogen and the residue was dissolved in 20 μl CHCl3. The entire organic lipid solution was applied onto a TLC plate and separated using CHCl3/EtAc (90:10, V:V) as mobile phase. The fluorescent spots were quantified with a CCD camera using an excitation wavelength of 365 nm. The amounts of the fluorescent components were determined from their respective fluorescence intensities (p < 0.05 = *, p < 0.01 = **).
In addition, pyrene-labeled tri-, di-, and monoacylglycerols solubilized with PC/PI mixtures (3:1, mol:mol) were used as more reliable substrates for the determination of lipase activity (Fig. 4). ATGL-deficiency significantly reduced triacylglycerol hydrolysis in adipose tissue. In contrast, HSL-deficiency affected lipase activities in BAT and WAT to a much lesser extent. Triacylglycerol hydrolase activities of BAT and WAT from ATGL−/− mice were 75 and 70% lower than the respective activities of the wild-type tissues. HSL-deficiency reduced lipase activity toward triacylglycerols by 36 and 49% in BAT and WAT, respectively. Diacylglycerol hydrolase activities of BAT from ATGL-ko and wt mice were the same. They were slightly higher in ATGL-deficient WAT. HSL-deficiency significantly influenced the total diacylglycerol hydrolase activity, whereas ATGL-deficiency hardly showed any effect. DAG hydrolysis rates were reduced by more than 75 and 50% in BAT and WAT of HSL-deficient mice, respectively. Monoacylglycerol activity did not change if ATGL or HSL was absent.
Activity Profiling of Overexpressed Enzyme Candidates
ATGL-deficiency in BAT was associated with up- and down-regulation of several lipolytic/esterolytic enzymes. Three proteins, namely esterase 1, esterase 10, and esterase 31-like showed the most pronounced effects. Therefore, they were characterized in more detail with respect to substrate preference. The respective proteins were transiently overexpressed in COS 7 cells. Overexpressed HSL and β-galactosidase (LacZ) were used as positive and negative controls, respectively. In addition, apolipoprotein A-IV isolated from human plasma was studied because this protein showed significantly increased activities toward the lipase inhibitors in ATGL-deficient BAT. First, we determined the reactivities of these proteins toward two fluorescent lipase/esterase inhibitors, namely Cy5-Ethyl-P and the more hydrophobic Cy5-TGP. The enzyme candidates recognized both probes (Fig. 5), indicating, that they might have lipolytic or esterolytic activities. In addition, we measured the hydrolytic activities of the overexpressed proteins toward pNP-esters (Fig. 6) and pyrene-labeled acylglycerols as substrates (Fig. 7). Only HSL (3.4 fold increase) and Es 10 (1.61 fold increase) expressed higher activities toward pNP acetate than the “inactive” reference cell lysate (LacZ). The relative activities toward pNP-butyrate were 12.8 (HSL), 6 (esterase 10) and 1.7 (Esterase 31-like). Esterase 1 showed no activity toward pNP acetate and butyrate. All the overexpressed enzymes in this study catalyzed the hydrolysis of the hydrophobic substrate pNP-laurate (Activities relative to LacZ: HSL, 17.5; Es 1, 1.9; Es 10, 6.6; esterase 31-like, 2.2). The isolated apolipoprotein A-IV which reacted with the fluorescent inhibitors did not hydrolyze any of these substrates.
Fig. 5.

Transient expression of identified proteins. All enzymes except apolipoprotein A-IV were overexpressed in COS 7 cells. The cell homogenates were incubated with Cy5-Ethyl-P (A) and Cy5-TGP (B) resolved by SDS-PAGE, screened for Cy5 fluorescence and compared with LacZ as negative control (std. standard, lanes 1 and 7 HSL, lanes 2 and 8 apolipoprotein A-IV, lanes 3 and 9 esterase 1, lanes 4 and 10 esterase 10, lanes 5, 11 esterase 31-like and lanes 6 and 12 LacZ).
Fig. 6.

Lipolytic/esterolytic activities of overexpressed lipase candidates on carboxylic acid pNP esters. Shown are the rates of substrate hydrolysis catalyzed by overexpressed lipase candidates relative to LacZ. Substrates were p-nitrophenyl acetate, butyrate, and laurate. The assay was performed in a 96-well microtiterplate format. The total amount of tissue protein was 1 μg. Substrate concentration was 0.15 mm. Substrate hydrolysis was determined from the formation of p-nitrophenolate (absorption at 405 nm). Data points were collected every 3 mins during a period of 30 min (p < 0.001).
Fig. 7.

Lipolytic activities of overexpressed lipase candidates on pyrene-tagged tri-, di-, and monoacylglycerols. Shown are the rates of substrate hydrolysis catalyzed by overexpressed lipase candidates relative to LacZ. Solutions containing 1 μmol of pyrene-labeled acylglycerol and 1 μmol of PC/PI (3:1 mol:mol) were mixed. The solvent of the resultant solution was removed under a stream of nitrogen and the substrate was solubilized in 10 ml of 50 mm Tris/HCl buffer (pH 7.4) followed by vigorous vortexing for 5 min and pulsed sonication for 5 min. For the assay 50 μl of the substrate solution, was diluted with 150 μl of 50 mm Tris/HCl buffer. The reaction was started by adding 50 μg of the overexpressed protein. The assay mixture was incubated for 1 h at 37 °C and 1000 rpm. The reaction was stopped by adding CHCl3/MeOH (2:1, V:V) and 20 μl HCl followed by vigorous vortexing for 5 min. For better phase separation, the mixture was centrifuged for 2 min at 9000 × g followed by removal of the aqueous layer. The organic solvent was removed under a stream of nitrogen and the residue was dissolved in 20 μl CHCl3. The entire organic lipid solution was applied onto a TLC plate and separated using CHCl3/EtAc (90:10, V:V) as mobile phase. The fluorescent spots were quantified with a CCD camera using an excitation wavelength of 365 nm. The amounts of the fluorescent components were determined from their respective fluorescence intensities which were corrected with the corresponding emission intensities of LacZ.
Similar tendencies were seen when fluorescent tri-, di- and monoacylglycerols were used as substrates. HSL was the most efficient enzyme, if pyrene-sn1-TAG was used as a substrate. Es10 and Es31-like showed only half of the HSL activity. Es1 did not degrade this lipid. Pyrene-sn3-TAG was a less favorable substrate showing there is a stereopreference for its sn1-enantiomer. Pyrene-DAG was an excellent substrate for HSL and Es10. Es1 still showed detectable activity on this lipid, whereas the same compound was only slowly degraded by Es31-like. Pyrene-MAG was accepted as a substrate by all enzymes showing very similar activities.
DISCUSSION
We applied the recently described DABGE technique (20) to compare the lipolytic proteomes of brown and white adipose tissue from ATGL- and HSL-deficient mice with the corresponding tissues from wild-type mice. The ARPs used in this approach specifically label the nucleophilic serine in the active center of lipolytic and esterolytic enzymes. This method is well suited for the comparison of two different samples in one electrophoresis gel. It has already been successfully applied for the comparative analysis of the lipolytic proteomes of brown and white adipose tissue. Both “organs” fulfill different functions. WAT accumulates excess energy as triacylglycerols, whereas BAT dissipates energy through adaptive thermogenesis (1–3). According to the DABGE data, the lipase/esterase patterns of both tissues differ to a significant extent also (20).
In 2004, three groups independently published the discovery of an enzyme preferentially hydrolyzing TAG and named it ATGL (14), desnutrin (13), or calcium-independent phospholipase A2ζ (12). In mice, ATGL is predominantly expressed in white and brown adipose tissue. Lower enzyme levels were found in testis, cardiac, and skeletal muscle (13, 14, 30). Sound evidence has been provided that ATGL is the enzyme catalyzing the first step of triacylglycerol degradation, generating diacylglycerol and free fatty acid (14). Eventually it was demonstrated, that ATGL shows transacylase (12, 30) and phospholipase activity (12, 14) too, though these activities are lower than its TAG hydrolase activity. In line with these observations, ATGL-null mice showed accumulation of neutral lipids in most tissues, suggesting an essential role for ATGL in cellular TAG catabolism. As a consequence, ATGL-deficient mice are heavier, show a twofold increase in whole body fat mass and contain enlarged adipose fat depots (22).
In the present study a DABGE-based comparison of lipases/esterases in BAT from ATGL-deficient and wild-type mice showed that the absence of ATGL has a profound effect on the levels of many enzymes in brown adipose tissue. HSL and MGL which catalyze triacylglycerol degradation downstream of ATGL, were significantly down-regulated in BAT from ATGL−/− mice. In the absence of ATGL, supply of DAG and MAG is less efficient and as a consequence there is no need for high expression/activity of enzymes degrading these lipids. In addition, esterase 31, carboxylesterase ML1, triacylglycerol hydrolase, abhydrolase domain-containing protein 11, esterase 1 homolog, and enolase 1 were less abundant. Several enzymes in ATGL-deficient BAT were up-regulated including esterase 1, albumin, esterase 31-like, apolipoprotein A-IV, fumarylacetoacetat hydrolase, platelet-activating factor acetylhydrolase isoform 1b, beta 1 subunit, and lysophospholipase 1. The physiological function and substrate preference of some of these enzymes are still elusive. Little is known about esterase 31 and esterase 31-like in this respect. Both proteins are homologous to Es 22 (31). Es22 has meanwhile been identified as a retinyl ester hydrolase (32). Triacylglycerol hydrolase (TGH) is a member of the carboxylesterase family which localizes to the lumen of the endoplasmatic reticulum and likely contributes to the hydrolysis of intracellular triacylglycerol in adipose tissue, adipocytes (33) and hepatocytes (34). It likely plays a role in the assembly of very low density lipoprotein in liver (34–36). Carboxylesterase ML1 also known as triacylglycerol hydrolase 2 was recently characterized and shows remarkable similarity to TGH, with respect to structure, subcellular localization, substrate specificity and regulation (37). Abhydrolase domain-containing protein 11 is encoded on a chromosomal region that is often deleted in the human developmental disorder Williams-Beuren syndrome (38). Earlier experiments using substrates with various polarities led to the conclusion that this protein may rather be an esterase than a lipase (19). Enolase 1, which is also a serine hydrolase, catalyzes the stereochemically specific anti-elimination of water from 2-phosphoglycerate to form P-enolpyruvate in a stepwise reaction (39). Information on esterase D (synonymous with Es10), which was only slightly down-regulated, is scarce, although a human homolog is supposed to be involved in detoxification (40, 41).
Esterase 1 belongs to the carboxylesterase multigene family and is highly homologous to TGH. However, there is nothing known about the physiological function and the substrate preference of this enzyme. Serum albumin was also detected in our DABGE analysis of adipose tissues. This is not surprising because it exhibits esterase activity on various compounds, including short-chain esters and phosphonates (42–45). Lysophospholipase 1 belongs to a family with broad substrate specificity for lysophospholipids (46). Lysophospholipase 1 also possesses the common features of lipases, which are a GXSXG motif, an α/β-hydrolase fold and a nucleophilic serine, which is essential for its catalytic activity (47). Platelet-activating factor (PAF) acetylhydrolase (PAF-AH), also known as lipoprotein-associated phospholipase A2, catalyzes the hydrolysis of short and/or oxidized acyl chains in position sn2 of PAF, truncated gylcerophospholipids, and phospholipid hydroperoxides (48–51). In human plasma, a significant fraction (∼70%) of PAF-AH activity is associated with LDL. The residual activity localizes to plasma HDL (52). It has been reported that changes in localization of PAF-AH correlate with human diseases including coronary artery disease (53), hypercholesterolemia (54), paroxysmal atrial fibrillation (55), and chronic kidney disease (56).
ATGL-deficiency only affects a small number of lipases/esterases in murine WAT. Among these enzymes, CesML1 is down-regulated and Acetyl-CoA acetyltransferase 3 is slightly up-regulated. It may be speculated, that the lack of ATGL activity is in part compensated by the former two enzymes in murine BAT.
Hormone-sensitive lipase (HSL) is an intracellular neutral lipase, which is capable of hydrolyzing TAGs, DAGs, MAGs, and cholesteryl esters (CE), with a preference for DAG and CE. In adipose tissue, it mainly catalyzes the second step of triacylglycerol degradation, namely the release of fatty acid from diacylglycerol (17). As a consequence, HSL-deficient mice, exhibiting normal body-weight accumulate DAG in various tissues including adipose tissue (21). According to our DABGE analysis, HSL-deficiency has no effect on the activity and/or abundance of other lipolytic enzymes in murine BAT and WAT. Fumarylacetoacetase was the only enzyme which was significantly down-regulated in brown adipose tissue of HSL-null mice.
The profound changes of the lipase/esterase patterns in ATGL-ko mice result in significant alterations of total lipase activities in adipose tissues toward synthetic substrates. BAT of ATGL-null mice showed a 50 and 65% reduction in activity toward pNP-acetate and pNP-laurate, respectively. Triacylglycerol hydrolase activity was significantly decreased (25% left), too but did not reach zero. This is remarkable as HSL activity was lower in BAT of ATGL-ko mice, too. Obviously, there must be other enzymes compensating for the loss of total TAG hydrolase activity in this tissue. Similar effects are seen if total DAG and MAG hydrolase activities of ATGL−/− BAT are compared with those of the wild-type. Despite the fact that HSL and MGL activities are lower, too, the overall DAG and MAG hydrolysis rates are the same in ATGL ko and wt mice. It can be speculated that esterase 1 substitutes for HSL in this respect. If overexpressed in COS 7 cells Es1 catalyzes the hydrolysis of a series of different substrates including pNP-esters and as well as diacylglycerols. Its in vitro activity toward diacylglycerol is about 30% of the HSL activity toward the same substrate. Esterase 10 which was also overexpressed in COS 7 cells showed activity toward various substrates including pNP-esters as well as tri-, di and monoacylglycerol. We speculate that this enzyme is responsible for the residual triacylglycerol activity if ATGL is missing. Esterase 31-like might be another enzyme which is able to compensate at least to some extent for the loss of activity toward TAG in ATGL−/− BAT. It has to be left open whether apolipoprotein A-IV is also a candidate contributing to lipolysis in ATGL−/− BAT. It reacted with polar and hydrophobic substrate analogous ARPs. However, we did not find any activity toward any substrates to date.
The total lipase activities of WAT from ATGL-deficient mice showed only small differences compared with the wild-type. Only the triacylglycerol hydrolase activity was reduced by 65% in the ATGL −/− tissue. This result is in agreement with the observation that ATGL is missing and CesML1, which also hydrolyzes triacylglycerols is down-regulated.
Although HSL-deficiency hardly influences the level of the other lipolytic enzymes in the investigated tissues, total enzyme activities toward tri- and diacylglycerols are reduced by 36 and 76% in BAT and by 49 and 53% in WAT, respectively. The lack of HSL activity in adipose tissue obviously accounts for a significant fraction of TAG and DAG degradation in BAT and WAT. Lipolytic activities toward monoacylglycerol were not influenced in adipose tissues by ATGL- nor HSL-deficiency.
ATGL-deficiency in mice is associated with a profound effect on lipolytic enzyme patterns and total lipase activities of BAT, whereas the lipolytic proteomes and the lipolytic activities of WAT are hardly influenced. The absence of HSL in BAT and WAT do not greatly change the expression levels of other lipolytic proteins either. In all cases, ATGL and HSL deficiencies lead to pathophysiological consequences. Because of the individual substrate preferences of these enzymes, cells accumulate triacyl- and diacylglycerols, if ATGL and HSL are absent, respectively. The biochemical abnormalities are associated with pathological phenotypes. ATGL-deficient mice are obese and develop lethal cardiac dysfunction at an early age (21). HSL-deficient mice exhibit a lean phenotype and male animals are sterile (22). HSL has been shown to preferentially hydrolyze long chain FAs from the TG pool and its substrate specificity may be a consequence of the polarity of the TG molecule (22, 57–60). However, the role of ATGL in selective fatty acid (FA) mobilization from the cellular TG pool is currently not known. Accordingly, it is thinkable that the induction of alternative lipolytic enzymes may be an adaptation to the inadequate mobilization of certain FA species in ATGL- and HSL-deficient adipose tissue. Notably, ATGL-deficiency does not completely abolish TAG hydrolysis in WAT and BAT, respectively (21, 61). Given that HSL mainly hydrolyzes DAG these findings suggest that alternative lipases can be responsible for the residual lipolytic activity in ATGL-deficient adipose tissue which is strongly supported by our findings: Several serine lipid hydrolases are up-regulated in ATGL-deficient BAT (see below). According to the in vitro lipase activities determined in this study, some of these enzymes could partially compensate for the lack of ATGL-mediated TG hydrolysis in brown fat cells. Studies with overexpressed esterase 1, esterase 10, and esterase 31-like provided some hints for potential functions of these proteins as lipases. Esterase 10 hydrolyzes tri-, di-, and monoacylglycerols as well as fatty acid pNP esters. Esterase 1 reacts with the polar and hydrophobic inhibitors. In addition, it catalyzes the hydrolysis of di- and monoacylglycerols, as well as pNP-laurate. Esterase 31-like does not only hydrolyze pNP-laurate, but also degrades TAG, DAG and MAG to some extent. Es10 and Es31-like could account for the residual triacylglycerol hydrolase activity if activities of HSL, TGH, and CesML1 due to ATGL-deficiency are low.
ATGL- but not HSL-deficiency has a dramatic impact on the expression of other lipases in BAT. Mice lacking ATGL are strongly cold-sensitive and BAT mass is severely increased in size due to massive TG accumulation indicating that a defect in BAT-associated TAG hydrolysis accounts for defective thermoregulation. However, thermogenic adaptation was examined in mice globally lacking ATGL (21) or in mice lacking ATGL in WAT and BAT, respectively (61). With regard to defective TAG mobilization in WAT of these mouse models and consequently the marked reduction in circulating FA levels it is also thinkable that the thermogenic defect is due to an insufficient FA delivery from the circulation. Accordingly, the induction of lipase expression in BAT of ATGL-deficient mice could also be an adaptation to the inadequate supply of exogenous FAs and the reduction in circulating FA.
The activities reported in this study were determined in vitro. Thus, we do not know whether we have detected their full catalytic capacities under optimal assay conditions including the requirement for potential activators and specific environments of subcellular lipid structures. In addition, we have to leave it open, whether some enzymes have escaped detection for the same reasons. Future in vivo studies including the silencing of these candidate genes in both, wild type and ATGL-deficient cell lines and the measurement of lipolytic activities will address the significance of these potential lipases in TG catabolism.
In summary, our study discovers several potential lipase candidates that could partially compensate for the lack of ATGL (at least in BAT). Importantly, the discovered lipase candidates could also exhibit a non-ATGL related role in adipose- and non-adipose tissue lipid catabolism.
Supplementary Material
Acknowledgments
We thank Linda Fineder for the preparation of apolipoprotein A-IV.
Footnotes
* This work was supported by the Austrian Federal Ministry of Science and Research in the framework of the GEN-AU program (GOLD project), the Austrian Science Fund (FWF project I308-B12 to AH) and the Standortagentur Tirol (to FK).
 This article contains supplemental Files S1 to S4.
1 The abbreviations used are:
- TAG
- Triacylglycerol
- Apo AIV
- Apolipoprotein A-IV
- ATGL
- Adipose triglyceride lipase
- BAT
- Brown adipose tissue
- DABGE
- Differential activity-based gel electrophoresis
- DAG
- Diacylglycerol
- FA
- Fatty acid
- HSL
- Hormone-sensitive lipase
- ko
- Knock-out
- LacZ
- β-galactosidase
- LyPL
- Lysophospholipase
- MAG
- Monoacylglycerol
- MGL
- Monoglycerid lipase
- PAF-AH
- Platelet-activating factor acetylhydrolase
- pNP
- p-Nitrophenol
- TGH
- Triacylglycerol hydrolase
- WAT
- White adipose tissue
- wt
- Wild-type
- ARP
- activity recognition probe.
REFERENCES
- 1. Cinti S. (2001) The adipose organ: morphological perspectives of adipose tissues. Proc. Nutr. Soc. 60, 319–328 [DOI] [PubMed] [Google Scholar]
- 2. Cinti S. (2005) The adipose organ. Prostaglandins Leukot. Essent. Fatty Acids 73, 9–15 [DOI] [PubMed] [Google Scholar]
- 3. Hansen J. B., Kristiansen K. (2006) Regulatory circuits controlling white versus brown adipocyte differentiation. Biochem. J. 398, 153–168 [DOI] [PMC free article] [PubMed] [Google Scholar]
- 4. Coppack S. W., Jensen M. D., Miles J. M. (1994) In vivo regulation of lipolysis in humans. J. Lipid Res. 35, 177–193 [PubMed] [Google Scholar]
- 5. Zechner R., Strauss J. G., Haemmerle G., Lass A., Zimmermann R. (2005) Lipolysis: pathway under construction. Curr. Opin. Lipidol. 16, 333–340 [DOI] [PubMed] [Google Scholar]
- 6. Large V., Arner P. (1998) Regulation of lipolysis in humans. Pathophysiological modulation in obesity, diabetes, and hyperlipidaemia. Diabetes Metab. 24, 409–418 [PubMed] [Google Scholar]
- 7. Arner P. (2002) Insulin resistance in type 2 diabetes: role of fatty acids. Diabetes Metab. Res. Rev. 18, S5–S9 [DOI] [PubMed] [Google Scholar]
- 8. Bergman R. N., Van Citters G. W., Mittelman S. D., Dea M. K., Hamilton-Wessler M., Kim S. P., Ellmerer M. (2001) Central Role of the Adipocyte in the Metabolic Syndrome. J. Investig. Med. 49, 119–126 [DOI] [PubMed] [Google Scholar]
- 9. Blaak E. E. (2003) Fatty acid metabolism in obesity and type 2 diabetes mellitus. Proc. Nutrition Soc. 62, 753–760 [DOI] [PubMed] [Google Scholar]
- 10. Boden G., Shulman G. I. (2002) Free fatty acids in obesity and type 2 diabetes: defining their role in the development of insulin resistance and β-cell dysfunction. European J. Clin. Investig. 32, 14–23 [DOI] [PubMed] [Google Scholar]
- 11. Watt M. J., Steinberg G. R. (2008) Regulation and function of triacylglycerol lipases in cellular metabolism. Biochem. J. 414, 313–325 [DOI] [PubMed] [Google Scholar]
- 12. Jenkins C. M., Mancuso D. J., Yan W., Sims H. F., Gibson B., Gross R. W. (2004) Identification, cloning, expression, and purification of three novel human calcium-independent phospholipase A2 family members possessing triacylglycerol lipase and acylglycerol transacylase activities. J. Biol. Chem. 279, 48968–48975 [DOI] [PubMed] [Google Scholar]
- 13. Villena J. A., Roy S., Sarkadi-Nagy E., Kim K. H., Sul H. S. (2004) Desnutrin, an adipocyte gene encoding a novel patatin domain-containing protein, is induced by fasting and glucocorticoids: Ectopic expression of desnutrin increases triglyceride hydrolysis. J. Biol. Chem. 279, 47066–47075 [DOI] [PubMed] [Google Scholar]
- 14. Zimmermann R., Strauss J. G., Haemmerle G., Schoiswohl G., Birner-Gruenberger R., Riederer M., Lass A., Neuberger G., Eisenhaber F., Hermetter A., Zechner R. (2004) Fat mobilization in adipose tissue is promoted by adipose triglyceride lipase. Science 306, 1383–1386 [DOI] [PubMed] [Google Scholar]
- 15. Lass A., Zimmermann R., Haemmerle G., Riederer M., Schoiswohl G., Schweiger M., Kienesberger P., Strauss J. G., Gorkiewicz G., Zechner R. (2006) Adipose triglyceride lipase-mediated lipolysis of cellular fat stores is activated by CGI-58 and defective in Chanarin-Dorfman Syndrome. Cell Metab. 3, 309–319 [DOI] [PubMed] [Google Scholar]
- 16. Doolittle M., Reue K., Holm C., Østerlund T. (1999) Hormone-sensitive lipase and neutral cholesteryl ester lipase. Lipase Phospholipase Protocols, Vol. 109, 109–121, Humana Press; [DOI] [PubMed] [Google Scholar]
- 17. Kraemer F. B., Shen W. J. (2002) Hormone-sensitive lipase. J. Lipid Res. 43, 1585–1594 [DOI] [PubMed] [Google Scholar]
- 18. Tornqvist Hans, Belfrage Per, Lowenstein J. M. (1981) [75] Monoacylglycerol lipase from rat adipose tissue: EC 3.1.1.23 Glycerol-monoester acylhydrolase. Methods Enzymol. 71, 646–652 [DOI] [PubMed] [Google Scholar]
- 19. Birner-Gruenberger R., Susani-Etzerodt H., Waldhuber M., Riesenhuber G., Schmidinger H., Rechberger G., Kollroser M., Strauss J. G., Lass A., Zimmermann R., Haemmerle G., Zechner R., Hermetter A. (2005) The lipolytic proteome of mouse adipose tissue. Mol. Cell. Proteomics 4, 1710–1717 [DOI] [PubMed] [Google Scholar]
- 20. Morak M., Schmidinger H., Krempl P., Rechberger G., Kollroser M., Birner-Gruenberger R., Hermetter A. (2009) Differential activity-based gel electrophoresis for comparative analysis of lipolytic and esterolytic activities. J. Lipid Res. 50, 1281–1292 [DOI] [PMC free article] [PubMed] [Google Scholar]
- 21. Haemmerle G., Lass A., Zimmermann R., Gorkiewicz G., Meyer C., Rozman J., Heldmaier G., Maier R., Theussl C., Eder S., Kratky D., Wagner E. F., Klingenspor M., Hoefler G., Zechner R. (2006) defective lipolysis and altered energy metabolism in mice lacking adipose triglyceride lipase. Science 312, 734–737 [DOI] [PubMed] [Google Scholar]
- 22. Haemmerle G., Zimmermann R., Hayn M., Theussl C., Waeg G., Wagner E. F., Sattler W., Margin T. M., Zechner R. (2002) Hormone-sensitive lipase deficiency in mice causes diglyceride accumulation in adipose tissue, muscle, and testis. J. Biol. Chem. 277, 4806–4815 [DOI] [PubMed] [Google Scholar]
- 23. Bradford M. M. (1976) A rapid and sensitive method for the quantitation of microgram quantities of protein utilizing the principle of protein-dye binding. Anal. Biochem. 72, 248–254 [DOI] [PubMed] [Google Scholar]
- 24. Fling S. P., Gregerson D. S. (1986) Peptide and protein molecular weight determination by electrophoresis using a high-molarity tris buffer system without urea. Anal. Biochem. 155, 83–88 [DOI] [PubMed] [Google Scholar]
- 25. Görg A., Postel W., Günther S. (1988) Two-dimensional electrophoresis. The current state of two-dimensional electrophoresis with immobilized pH gradients. Electrophoresis 9, 531–546 [DOI] [PubMed] [Google Scholar]
- 26. Görg A., Postel W., Günther S., Weser J. (1985) Improved horizontal two-dimensional electrophoresis with hybrid isoelectric focusing in immobilized pH gradients in the first dimension and laying-on transfer to the second dimension. Electrophoresis 6, 599–604 [Google Scholar]
- 27. Görg A., Weiss W., Dunn M. J. (2004) Current two-dimensional electrophoresis technology for proteomics. Proteomics 4, 3665–3685 [DOI] [PubMed] [Google Scholar]
- 28. Shevchenko A., Wilm M., Vorm O., Mann M. (1996) Mass spectrometric sequencing of proteins from silver-stained polyacrylamide gels. Anal. Chem. 68, 850–858 [DOI] [PubMed] [Google Scholar]
- 29. Haiman M., Salvenmoser W., Scheiber K., Lingenhel A., Rudolph C., Schmitz G., Kronenberg F., Dieplinger H. (2005) Immunohistochemical localization of apolipoprotein A-IV in human kidney tissue. Kidney Int. 68, 1130–1136 [DOI] [PubMed] [Google Scholar]
- 30. Lake A. C., Sun Y., Li J. L., Kim J. E., Johnson J. W., Li D., Revett T., Shih H. H., Liu W., Paulsen J. E., Gimeno R. E. (2005) Expression, regulation, and triglyceride hydrolase activity of Adiponutrin family members. J. Lipid Res. 46, 2477–2487 [DOI] [PubMed] [Google Scholar]
- 31. Aida K., Moore R., Negishi M. (1993) Cloning and nucleotide sequence of a novel, male-predominant carboxylesterase in mouse liver. Biochim. Biophys. Acta 1174, 72–74 [DOI] [PubMed] [Google Scholar]
- 32. Schreiber R., Taschler U., Wolinski H., Seper A., Tamegger S. N., Graf M., Kohlwein S. D., Haemmerle G., Zimmermann R., Zechner R., Lass A. (2009) Esterase 22 and beta-glucuronidase hydrolyze retinoids in mouse liver. J. Lipid Res. 50, 2514–2523 [DOI] [PMC free article] [PubMed] [Google Scholar]
- 33. Soni K. G., Lehner R., Metalnikov P., O'Donnell P., Semache M., Gao W., Ashman K., Pshezhetsky A. V., Mitchell G. A. (2004) Carboxylesterase 3 (EC 3.1.1.1) is a major adipocyte lipase. J. Biol. Chem. 279, 40683–40689 [DOI] [PubMed] [Google Scholar]
- 34. Gilham D., Alam M., Gao W., Vance D. E., Lehner R. (2005) Triacylglycerol hydrolase is localized to the endoplasmic reticulum by an unusual retrieval sequence where it participates in VLDL assembly without utilizing VLDL lipids as substrates. Mol. Biol. Cell 16, 984–996 [DOI] [PMC free article] [PubMed] [Google Scholar]
- 35. Dolinsky V. W., Gilham D., Alam M., Vance D. E., Lehner R. (2004) Triacylglycerol hydrolase: role in intracellular lipid metabolism. Cell. Mol. Life Sci. 61, 1633–1651 [DOI] [PMC free article] [PubMed] [Google Scholar]
- 36. Dolinsky V. W., Sipione S., Lehner R., Vance D. E. (2001) The cloning and expression of a murine triacylglycerol hydrolase cDNA and the structure of its corresponding gene. Biochim. Biophys. Acta 1532, 162–172 [DOI] [PubMed] [Google Scholar]
- 37. Okazaki H., Igarashi M., Nishi M., Tajima M., Sekiya M., Okazaki S., Yahagi N., Ohashi K., Tsukamoto K., Amemiya-Kudo M., Matsuzaka T., Shimano H., Yamada N., Aoki J., Morikawa R., Takanezawa Y., Arai H., Nagai R., Kadowaki T., Osuga J. I., Ishibashi S. (2006) Identification of a novel member of the carboxylesterase family that hydrolyzes triacylglycerol. Diabetes 55, 2091–2097 [DOI] [PubMed] [Google Scholar]
- 38. Merla G., Ucla C., Guipponi M., Reymond A. (2002) Identification of additional transcripts in the Williams-Beuren syndrome critical region. Human Genet. 110, 429–438 [DOI] [PubMed] [Google Scholar]
- 39. Brewer J. M., Glover C. V., Holland M. J., Lebioda L. (1998) Significance of the enzymatic properties of yeast S39A enolase to the catalytic mechanism. Biochim. Biophys. Acta 1383, 351–355 [DOI] [PubMed] [Google Scholar]
- 40. Lee E. Y., Lee W. H. (1986) Molecular cloning of the human esterase D gene, a genetic marker of retinoblastoma. Proc. Natl. Acad. Sci. U. S. A. 83, 6337–6341 [DOI] [PMC free article] [PubMed] [Google Scholar]
- 41. Lee W. H., Wheatley W., Benedict W. F., Huang C. M., Lee E. Y. (1986) Purification, biochemical characterization, and biological function of human esterase D. Proc. Natl. Acad. Sci. U. S. A. 83, 6790–6794 [DOI] [PMC free article] [PubMed] [Google Scholar]
- 42. Córdova J., Ryan J. D., Boonyaratanakornkit B. B., Clark D. S. (2008) Esterase activity of bovine serum albumin up to 160 °C: A new benchmark for biocatalysis. Enz. Microb. Technol. 42, 278–283 [Google Scholar]
- 43. Means G. E., Bender M. L. (1975) Acetylation of human serum albumin by p-nitrophenyl acetate. Biochemistry 14, 4989–4994 [DOI] [PubMed] [Google Scholar]
- 44. Quon C. Y., Mai K., Patil G., Stampfli H. F. (1988) Species differences in the stereoselective hydrolysis of esmolol by blood esterases. Drug Metab. Disposition 16, 425–428 [PubMed] [Google Scholar]
- 45. Sakurai Y., Ma S.-F., Watanabe H., Yamaotsu N., Hirono S., Kurono Y., Kragh-Hansen U., Masaki O. (2004) Esterase-like activity of serum albumin: characterization of its structural chemistry using p-nitrophenyl esters as substrates. Pharmaceut. Res. 21, 285–292 [DOI] [PubMed] [Google Scholar]
- 46. Wang A., Deems R. A., Dennis E. A. (1997) Cloning, expression, and catalytic mechanism of murine lysophospholipase I. J. Biol. Chem. 272, 12723–12729 [DOI] [PubMed] [Google Scholar]
- 47. Wang A., Loo R., Chen Z., Dennis E. A. (1997) Regiospecificity and catalytic triad of lysophospholipase I. J. Biol. Chem. 272, 22030–22036 [DOI] [PubMed] [Google Scholar]
- 48. Stafforini D. M., Sheller J. R., Blackwell T. S., Sapirstein A., Yull F. E., McIntyre T. M., Bonventre J. V., Prescott S. M., Roberts L. J., 2nd (2006) Release of free F2-isoprostanes from esterified phospholipids is catalyzed by intracellular and plasma platelet-activating factor acetylhydrolases. J. Biol. Chem. 281, 4616–4623 [DOI] [PubMed] [Google Scholar]
- 49. Stremler K. E., Stafforini D. M., Prescott S. M., McIntyre T. M. (1991) Human plasma platelet-activating factor acetylhydrolase. Oxidatively fragmented phospholipids as substrates. J. Biol. Chem. 266, 11095–11103 [PubMed] [Google Scholar]
- 50. Stremler K. E., Stafforini D. M., Prescott S. M., Zimmerman G. A., McIntyre T. M. (1989) An oxidized derivative of phosphatidylcholine is a substrate for the platelet-activating factor acetylhydrolase from human plasma. J. Biol. Chem. 264, 5331–5334 [PubMed] [Google Scholar]
- 51. Kriska T., Marathe G. K., Schmidt J. C., McIntyre T. M., Girotti A. W. (2007) Phospholipase action of platelet-activating factor acetylhydrolase, but not paraoxonase-1, on long fatty acyl chain phospholipid hydroperoxides. J. Biol. Chem. 282, 100–108 [DOI] [PubMed] [Google Scholar]
- 52. Stafforini D. M., Tjoelker L. W., McCormick S. P., Vaitkus D., McIntyre T. M., Gray P. W., Young S. G., Prescott S. M. (1999) Molecular basis of the interaction between plasma platelet-activating factor acetylhydrolase and low density lipoprotein. J. Biol. Chem. 274, 7018–7024 [DOI] [PubMed] [Google Scholar]
- 53. Karabina S. A. P., Elisaf M., Bairaktari E., Tzallas C., Siamopoulos K. C., Tselepis A. D. (1997) Increased activity of platelet-activating factor acetylhydrolase in low-density lipoprotein subfractions induces enhanced lysophosphatidylcholine production during oxidation in patients with heterozygous familial hypercholesterolaemia. Eur. J. Clin. Invest. 27, 595–602 [DOI] [PubMed] [Google Scholar]
- 54. Tsimihodimos V., Karabina S. A., Tambaki A. P., Bairaktari E., Miltiadous G., Goudevenos J. A., Cariolou M. A., Chapman M. J., Tselepis A. D., Elisaf M. (2002) Altered distribution of platelet-activating factor-acetylhydrolase activity between LDL and HDL as a function of the severity of hypercholesterolemia. J. Lipid Res. 43, 256–263 [PubMed] [Google Scholar]
- 55. Okamura K., Miura S., Zhang B., Uehara Y., Matsuo K., Kumagai K., Saku K. (2007) Ratio of LDL- to HDL-Associated platelet-activating factor acetylhydrolase may be a marker of inflammation in patients with paroxysmal atrial fibrillation. Circ. J. 71, 214–219 [DOI] [PubMed] [Google Scholar]
- 56. Papavasiliou E. C., Gouva C., Siamopoulos K. C., Tselepis A. D. (2006) PAF-acetylhydrolase activity in plasma of patients with chronic kidney disease. Effect of long-term therapy with erythropoietin. Nephrol. Dial. Transplant. 21, 1270–1277 [DOI] [PubMed] [Google Scholar]
- 57. Raclot T. (1997) Selective mobilization of fatty acids from white fat cells: evidence for a relationship to the polarity of triacylglycerols. Biochem. J. 322, 483–489 [DOI] [PMC free article] [PubMed] [Google Scholar]
- 58. Raclot T., Holm C., Langin D. (2001) A role for hormone-sensitive lipase in the selective mobilization of adipose tissue fatty acids. Biochim. Biophys. Acta 1532, 88–96 [DOI] [PubMed] [Google Scholar]
- 59. Raclot T., Langin D., Lafontan M., Groscolas R. (1997) Selective release of human adipocyte fatty acids according to molecular structure. Biochem. J. 324, 911–915 [DOI] [PMC free article] [PubMed] [Google Scholar]
- 60. Raclot T., Oudart H. (1999) Selectivity of fatty acids on lipid metabolism and gene expression. Proc. Nutr. Soc. 58, 633–646 [DOI] [PubMed] [Google Scholar]
- 61. Ahmadian M., Abbott, Marcia J., Tang T., Hudak, Carolyn S. S., Kim Y., Bruss M., Hellerstein, Marc K., Lee H. Y., Samuel Varman T., Shulman Gerald I., Wang Y., Duncan Robin E., Kang C., Sul Hei S. (2011) Desnutrin/ATGL is regulated by AMPK and Is required for a brown adipose phenotype. Cell Metabolism 13, 739–748 [DOI] [PMC free article] [PubMed] [Google Scholar]
Associated Data
This section collects any data citations, data availability statements, or supplementary materials included in this article.