

Abstract
Structural characterization of proteasome complexes is an essential step toward understanding the ubiquitin-proteasome system. Currently, high resolution structures are not available for the 26S proteasome holocomplex as well as its subcomplex, the 19S regulatory particle (RP). Here we have employed a novel integrated strategy combining chemical cross-linking with multistage tandem mass spectrometry to define the proximity of subunits within the yeast 19S RP to elucidate its topology. This has resulted in the identification of 174 cross-linked peptides of the yeast 19S RP, representing 43 unique lysine-lysine linkages within 24 nonredundant pair-wise subunit interactions. To map the spatial organization of the 19S RP, we have developed and utilized a rigorous probabilistic framework to derive maximum likelihood (ML) topologies based on cross-linked peptides determined from our analysis. Probabilistic modeling of the yeast 19S AAA-ATPase ring (i.e., Rpt1–6) has produced an ML topology that is in excellent agreement with known topologies of its orthologs. In addition, similar analysis was carried out on the 19S lid subcomplex, whose predicted ML topology corroborates recently reported electron microscopy studies. Together, we have demonstrated the effectiveness and potential of probabilistic modeling for unraveling topologies of protein complexes using cross-linking data. This report describes the first study of the 19S RP topology using a new integrated strategy combining chemical cross-linking, mass spectrometry, and probabilistic modeling. Our results have provided a solid foundation to advance our understanding of the 19S RP architecture at peptide level resolution. Furthermore, our methodology developed here is a valuable proteomic tool that can be generalized for elucidating the structures of protein complexes.
Basic cellular homeostasis depends on the regulated protein degradation and turnover by the ubiquitin-proteasome system (1, 2). Central to this pathway is the 26S proteasome complex, which is responsible for ubiquitin/ATP-dependent protein degradation (3–5). The 26S holocomplex is a megadalton-sized protein assembly consisting of the 20S catalytic core particle (CP)1 and the 19S regulatory particle (RP). The eukaryotic 20S CP is composed of two copies of 14 nonidentical subunits (α1–7 and β1–7) arranged into four stacked heptameric rings in an order of α7β7β7α7. The crystal structure and topology of the highly ordered 20S CP has been resolved and is evolutionarily conserved (6). Although α subunits of the 20S CP are essential for the assembly of the complex and its interactions with the regulatory complex, three catalytic β subunits (β1, β2, and β5) harbor various catalytic activities responsible for regulated proteasomal degradation. The 19S RP is composed of 19 subunits, which forms two subcomplexes, the base consisting of six related AAA-ATPase (Rpt1–6) and four non-ATPase (Rpn1, Rpn2, Rpn10, and Rpn13) subunits and the lid containing nine non-ATPase subunits (Rpn3, Rpn5–9, Rpn11, Rpn12, and Rpn15/Sem1) (7, 8). In comparison with the 20S core, the function and structure of the 19S RP is much less well understood. Nevertheless, it is believed that the 19S RP is involved in multiple functions including recognition of polyubiquitinated substrates (9, 10), cleavage of the polyubiquitin chains to recycle ubiquitin (11), unfolding of substrates, assisting in opening the gate of the 20S chamber, and subsequently translocating the unfolded substrates into the catalytic chamber (4, 12–14). The six AAA-ATPase subunits (Rpt1–6), which directly interact with the 20S α-ring, function as a molecular chaperone responsible for protein unfolding and are involved in substrate translocation and modulating gating of the CP (5, 15). Although detailed functions for most of the 19S non-ATPase subunits remain elusive, Rpn11 is known to carry an Mpr1p and Pad1p N-termini (MPN) domain, which harbors an essential deubiquitination activity responsible for cleaving polyubiquitin chains from proteasomal substrates (11, 16). In addition, two proteasome subunits, Rpn10 and Rpn13, have been identified as ubiquitin receptors, which are important in docking ubiquitinated substrates to the proteasome for degradation (4). Moreover, the two largest proteasome subunits, Rpn1 and Rpn2, interact with a variety of proteins including ubiquitin receptors and deubiquitinases and thus may function as scaffolding proteins to assist proteasomal degradation. Thus far, no atomic resolution structures are available for either the 19S RP or the 26S holocomplex. New insights of the overall topology of the 19S RP will illuminate protein interactions within, thus providing evidence for its otherwise unknown functions.
Although many studies have been performed to characterize the 19S structure utilizing various techniques including cryo-EM (17, 18) and native mass spectrometry (19), details on spatial interfaces and subunit interconnectivity of the 19S RP remain to be unraveled. During the course of our study, the rough topology of the 19S RP was determined by cryo-EM alone (20) or coupled with other approaches (21); nevertheless more detailed information at the peptide or atomic level is still required. In addition to technological limitations in current approaches, the highly dynamic and heterogeneous nature of the 19S RP may attribute to the difficulty in obtaining its high resolution structure. In recent years, chemical cross-linking coupled with mass spectrometry (XL-MS) has become an attractive alternative for structure analysis of proteins and protein complexes (22, 23). The ability of XL-MS to identify interaction interfaces between proteins allows us to define low resolution protein topology. In addition to protein interaction networks and the site of protein interactions at binding interfaces, cross-linking analysis can reveal information about the spatial distance between cross-linked amino acids on the surface of folded proteins. Although such knowledge only reveals the maximum distance given by the length of the cross-linker and can be influenced by protein conformational flexibility, it can be used as the distance constraint for molecular modeling of protein folds and complex topologies, i.e., the arrangement of the constituents of a complex in space. A recent study by Chen et al. (24) on yeast RNA polymerase II (RNAPII) complex has exemplified the power of XL-MS in elucidating the architecture of large multisubunit complexes. Although effective, cross-linking studies have been challenging because of the low abundance of cross-linked products and the inherent complexity of sequencing interlinked peptides by MS for unambiguous identification. To facilitate MS detection and identification of cross-linked products, we have recently developed a novel homobifunctional amine reactive, low energy MS-cleavable cross-linker, disuccinimidyl sulfoxide (DSSO), and successfully applied it to cross-link the yeast 20S proteasome for rapid, accurate, and simplified determination of protein interaction interfaces within the complex (25). The unique functionality of our cross-linking reagent and specialized bioinformatics tools significantly increase our confidence and speed in the identification of cross-linked products when compared with cross-linking studies using traditional noncleavable reagents. Current cross-linking studies have been focused on protein complexes with known crystal structures, but topological structures of protein complexes based primarily on cross-linking data have not yet been reported. This is due to the lack of computational tools that use cross-linking data to deduce the spatial organization of subunits in a given complex. To define the architecture of the yeast 19S RP, we have characterized the proximity and interconnectivity of the subunits by employing our newly developed cross-linking strategy. The resulting cross-linking information serves as a basis for a rigorous probabilistic analysis to obtain the maximum likelihood (ML) topology. This strategy is developed by first analyzing our cross-linking data for the 19S six-member AAA-ATPase base ring, as the topology ordering of yeast orthologs has been recently determined (14, 26–28). The effectiveness of this new probabilistic platform is supported by the agreement between our derived ML topology of the AAA-ATPase base ring and previous reports. When the same probabilistic approach is applied to the 19S lid subcomplex, the resulting topology is also in agreement with recently proposed models (20, 21). This work represents the first application of probabilistic modeling of protein complexes based solely on cross-link data, establishing a new workflow for future structural analysis of large protein complexes using XL-MS.
EXPERIMENTAL PROCEDURES
Materials and Reagents
General chemicals were obtained from Fisher Scientific (Hampton, NH) or VWR International (West Chester, PA). Sequencing grade modified trypsin was obtained from Promega (Fitchburg, WI), Lys-C endoprotease was from Wako Chemical (Japan), and chymotrypsin protease was from Roche Pharmaceuticals (Basel, Switzerland).
Purification of the Yeast 19S RP
The 19S regulatory particle was affinity purified using an RPN11-TAP expressing yeast strain (Saccharomyces cerevisiae) as previously described (29, 30). The isolated proteasome complex composition and stoichiometry were evaluated by one-dimensional SDS-PAGE and mass spectrometry.
DSSO Cross-linking and Digestion of the 19S RP
Affinity purified 19S proteasome complexes (∼1 μm) were cross-linked in PBS buffer (pH 7.5) with DSSO (dissolved in DMSO to ∼20 mm) at 1:500 molar ratio for 30 min at room temperature with agitation. After 30 min, a second aliquot of DSSO was added to the mixture allowing for at least an additional 2 h of cross-linking at room temperature before quenching with 1 m NH4HCO3. Prior to enzymatic digestion, the proteins were reduced with 5 mm DTT at 56 °C for 30 min and alkylated with 10 mm chloroacetamide for 10 min in 200 mm NH4HCO3 at room temperature. The resulting cross-linked samples were digested first by 1% Lys-C (w/w) at 37 °C for 4 h and then by 2% trypsin (w/w) at 37 °C overnight. For some analyses, the samples were digested by 2% (w/w) chymotrypsin to improve sequence coverage. To isolate highly charged cross-linked peptides, off-line strong cation exchange chromatography was performed using an ÄKTA HPLC system (GE Healthcare). All of the fractions of peptide digests were desalted by Varian C18 OMIX ZipTip (Palo Alto, CA) prior to liquid chromatography-multistage mass spectrometric analysis (LC MSn).
LC MSn Analysis
DSSO cross-linked peptides were analyzed by LC MSn utilizing an LTQ-Orbitrap XL mass spectrometer (ThermoFisher, San Jose, CA) coupled on-line with an Eksigent NanoLC system (Dublin, CA). The reverse phase LC separation was as previously described (31). An MSn method was made specifically for the analysis of DSSO cross-linked peptides for automated data analysis as previously described (25). Both MS2 and MS3 scans were acquired for automated analysis of cross-linked peptides; each acquisition cycle of an MSn experiment includes one MS1 scan in FT mode (350–1800 m/z, resolution of 60,000 at m/z 400) followed by two data-dependent MS2 scans with normalized collision energy at 15% on the top two peaks from the MS1 scan and three MS3 scans in the LTQ with normalized collision energy at 29% on the top three peaks from MS2 for conventional peptide sequencing.
Data Analysis of DSSO Cross-linked Peptides
LC MS2 and LC MS3 spectra were firstly extracted using in-house software based on the Raw_Extract script from Xcalibur v2.4 (Thermo Scientific). Then extracted MS3 data were reformatted such that MS3 fragment ions were directly linked to their MS2 parent ions with in-house scripts (25). Using Batch-Tag software within a developmental version of Protein Prospector (v5.8.0, University of California San Francisco), MS2 and MS3 spectra were searched against a decoy database (13,490 entries) consisting of a normal Saccharomyces Genome Database protein sequence database (December 12, 2007) concatenated with its reversed version. Batch-Tag searching was carried out similarly as for protein identification (32). The mass tolerances for parent ions and fragment ions were set as ± 20 ppm and 0.6 Da. For Lys-C/trypsin digests, trypsin was set as the enzyme with two maximum missed cleavages allowed. For MS3 data, nonspecific cleavage at one terminus was chosen during Batch-Tag searching. Protein N-terminal acetylation, methionine oxidation, N-terminal conversion of glutamine to pyroglutamic acid, asparagine deamidation, and cysteine carbamidomethylation were selected as variable modifications. In addition, three defined modifications on uncleaved lysines and free protein N-terminus were chosen, including alkene (C3H2O, + 54 Da), sulfenic acid (C3H4O2S, + 104 Da), and unsaturated thiol (C3H2SO, + 86 Da) modifications caused by remnant fragment moiety of the DSSO cross-linker (25). For chymotryptic digests, all of the parameters are the same except that chymotrypsin was selected as the enzyme with five maximum missed cleavages allowed. Initial acceptance criteria for peptide identification required a reported expectation value ≤ 0.05. For the 19S proteasome analysis, the false positive rate for peptide identification is less than 1%.
MS-Bridge was used to confirm the identification of cross-linked peptides by matching their observed masses to theoretical masses of predicted cross-linked peptides. This search was only against targeted accession numbers, which are identified in the purified samples to minimize unnecessary complications (33). The parent mass error for MS-Bridge search was set as ± 10 ppm, and only one cross-link was allowed in the cross-linked peptides for general search. All three types of cross-linked peptide (34), i.e., interlinked (type 2), intralinked (type 1), and dead end modified (type 0) peptides, can be computed and matched in MS-Bridge (33).
The Link-Finder web-based program was designed to automatically identify candidate cross-linked peptides by correlating observed fragmentation in MS2 spectra with the predicted characteristic cleavage patterns of DSSO dead end, intralinked, and interlinked peptides as previously described (25). The search results from Link-Finder, Batch-Tag, and MS-Bridge programs are integrated together using in-house scripts to compile the list of cross-linked peptides identified with high confidence. The final results were validated manually by examining MS2 spectra and MS3 spectra, respectively.
Mathematical Model of Cross-linking Data to Predict the Maximum Likelihood Topology of the 19S Base ATPase Heterohexamer Ring and the Lid PCI Heterohexamer
We consider a protein complex with N protein subunits. Each putative topology for the complex is represented by a graph G = (V, E) where V is the set of vertices associated with the subunits numbered from 1 to N, and E is the set of undirected edges. If necessary, we let G* = (V*, E*) denote the “true” graph. We let EC denote the complement of E (i.e., the set of all pairs of vertices that are not in E). Obviously, we have the following equation.
 |
The data D = (dij) is a matrix of integers representing how often a cross-link between vertex i and vertex j is observed using mass spectrometry measurements. We assume that M = Σ(i,j)dij is the total number of observations. Because all edges are undirected, here and everywhere else we use notations like Σ(i,j) = Σ(i,j) ∈ E to denote Σi<j. Note that intrasubunit cross-links were observed, but these data are not considered here because they are not of interest in describing the overall topology.
In general, one may have additional constraints or information, I, on the class of possible graphs. For instance, we may know that the graph is a ring structure, in which case there are (N − 1!)/2 possible graphs, or we may have an estimate for the total number of edges (|E|). Another general constraint for a single protein complex is that the graph is connected (i.e., a path exists between all pairs of subunits). With sufficient constraints, it is possible to translate the information into a proper prior on the set of all graphs that satisfy the constraints, for instance a uniform prior.
To generate the data, D, we now assume a simple multinomial model where the data are generated by sampling pairs with replacement or equivalently by flipping M times the same die with
 |
faces (one face for each pair of vertices). The probability of each face represents the propensity toward observing the corresponding pair in the data. We can expect this probability to depend on many different factors, in particular on whether (i, j) is in E or in EC. We denote this probability by pij(G). Obviously, for each die (i.e., each graph) we must have ΣEpij(G) = 1.
A simple model for pij(G) is given by the following,
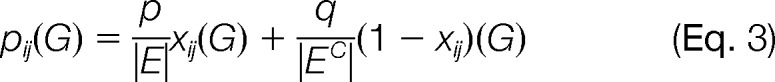 |
where p ≥ 0 represents the total probability associated with the pairs in E, q ≥ 0 represents the total probability associated with pairs in EC, and p + q = 1. xij(G) is a binary indicator variable: xij(G) = 1 if (i, j) ∈ E, and xij(G) = 0 if (i, j) ∈ EC. Alternatively, we can use the notation pij for edges in E and qij for edges in EC.
In this simple model, all the edges of G have the same probability of being observed, and all the non-edges of G have the same probability of being observed. This model is completely defined by the value of E and the value of p (because q = 1 − p). Note that this model can also be viewed as first flipping a biased coin with probabilities p and q to decide whether to sample from E or EC and then sampling uniformly from the corresponding subset. More general models can be obtained when pij(G) is allowed to vary among pairs in E or EC; however, here we focus on the simple model. The likelihood P(D|G) of observing the data given a specific graph is as follows.
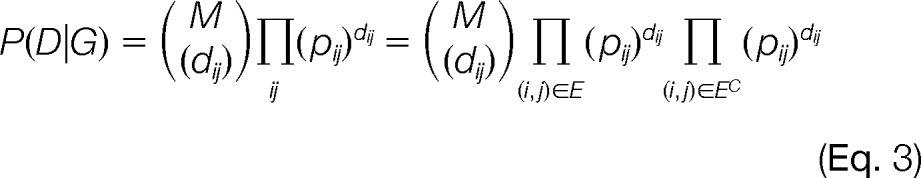 |
Here
 |
denotes the usual multinomial coefficient. For instance,
 |
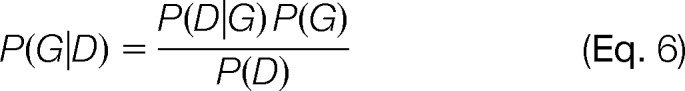 |
Maximum a posteriori estimation aims at finding the graph that maximizes the posterior distribution P(G|D). When P(G) is uniform over the set of graphs satisfying the constraints I, this is equivalent to ML estimation, which aims at finding the graph that maximizes the likelihood P(D|G) over the set of graphs satisfying the constraints I.
When the set of graphs satisfying the constraints I is small (e.g., 19S base ring of six subunits), one can exhaustively enumerate all its members, compute the likelihood (or posterior) for each one of them, and take the maximum. When this exhaustive enumeration is not feasible, one can observe that if pij ≥ qij for all (i, j), then the graph that solves the ML problem (the maximum likelihood graph or GML) has an edge for each dij > 0 and no edges for dij = 0; however, this graph may violate constraints in I. Thus, in many cases the ML or maximum a posteriori problem will not have a unique solution, and displaying one solution without commenting on the alternatives would be misleading. When all of the possible graphs that satisfy the constraints I can be exhaustively enumerated, then the total probability associated with all possible graphs can be used to normalize P(G|D). Thus, the probability of a specific graph is given by
 |
where FI is the set of all possible graphs that satisfy I.
Defining Edges in the Graph for Adjacent Subunits
In the biological context of a protein complex, there is no universal definition of what constitutes adjacency between protein subunits. Even defining this between subunits from a known three-dimensional structure of a complex requires a precise threshold on some objective measurement of interaction between pairs of subunits. Using our interpretation of RNA polymerase II cross-linking data from Chen et al. (24) compared with its resolved crystal data to define adjacency, we describe how this information is used to establish a confidence interval on the global parameter p (for details see supplemental “Methods”).
Establishing Confidence Intervals on the Parameter, p
In the probabilistic model, the value of the global parameter, p, indicates the confidence of the model; however, the value of p is unknown. Thus, we are interested in obtaining point estimates and establishing confidence intervals on the parameter p. Using cross-linking data of RNAPII by Chen et al. (24) and our own data, we were able to generate confidence intervals on p that are used to focus our analysis of the maximum likelihood graph to the most likely values of p (for details see supplemental “Methods”).
RESULTS
An Integrated Strategy for Structural Analysis of the Yeast 19S RP
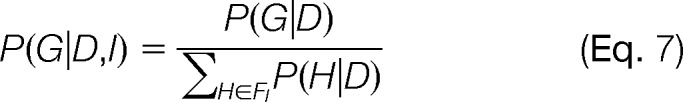
The general strategy for structural characterization of the 19S RP using cross-linking, multistage mass spectrometry (MSn), and computational modeling is illustrated in Fig. 1. As shown, affinity-purified yeast 19S proteasome complexes were first cross-linked by DSSO in vitro, and the resulting cross-linked products were then subjected to reduction/alkylation prior to enzymatic digestion. The samples were either directly analyzed by LC MSn or separated first by off-line strong cation exchange chromatography. Database searching of MSn spectra was carried out using Protein Prospector, and the results were summarized and validated through our Link-Finder program (25). Pair-wise subunit interactions derived from the identified DSSO cross-linked peptides were the basis for subsequent probabilistic analysis to obtain the spatial organization of the 19S RP subcomplexes.
Fig. 1.
An integrated strategy for topological analysis of the 19S RP using DSSO cross-linking, LC MSn, and probabilistic modeling. SCX, strong cation exchange.
Identification of Cross-linked Peptides of the Yeast 19S RP
In our analysis, three typical types of cross-linked peptides have been identified including interlinked, intralinked, and dead end modified peptides. However, only interlinked peptides are reported here because they are the ones that provide information on protein interaction interfaces and subunit-subunit interactions for elucidating the structural topology of protein complexes. The DSSO interlinked peptides of the 19S RP were identified in a similar manner as previously described (25). Briefly, three lines of evidence have been obtained to support the identity of a DSSO cross-linked peptide from its MSn spectral data (Fig. 2). We have previously demonstrated that the C–S bond adjacent to the sulfoxide in DSSO is much more labile than the peptide backbone, and DSSO cross-linked peptides can undergo characteristic fragmentation during collision-induced dissociation analysis. There are two symmetric C–S bonds present in DSSO. As an example, a DSSO interlinked heterodimeric peptide (i.e., α peptide–β peptide) is shown in Fig. 2A; the cleavage of one of the two symmetric C–S bonds next to the central sulfoxide separates the interlinked parent ion into a pair of peptide fragments in MS2 with a defined mass relationship. Such characteristic MS2 fragmentation of DSSO interlinked peptides allows their automatic identification using our in-house program Link-Finder. In Fig. 2B, the MS3 analysis of the unique α and β peptide fragments permits their unambiguous identification using conventional database searching tools such as Batch-Tag in Protein Prospector. Because these peptide fragments carry stable and known mass modifications resulting from the defined cleavage of the DSSO cross-linker, this allows not only unambiguous peptide identification, but also the identification of exact protein interaction interfaces through lysine-lysine linkages. In addition to MS2 and MS3 data, the MS1 parent ion information is used to further confirm identities of cross-linked peptides by matching their observed peptide masses to the theoretical masses of predicted cross-linked peptides using the MS-Bridge program (Fig. 2C). Together, these three different types of MS data are integrated to provide three lines of evidence for unambiguous identification of DSSO cross-linked peptides (Fig. 2D) prior to final manual validation.
Fig. 2.

The workflow for integrated data analysis of LC MSn data to identify DSSO interlink peptides. An example of a DSSO interlinked peptide (m/z 470.51214+) from the 19S subunits is shown here. A, the MS2 fragmentation pattern is indicative of the type of cross-link observed. In this example, the cleavage of one C–S bond next to the sulfoxide separates an interlinked peptide into a pair of peptide fragments, i.e., αT/βA, in which the α peptide fragment is modified with an unsaturated thiol (T) moiety (+ 86 Da), whereas the β peptide fragment is modified with an alkene (A) moiety (+ 54 Da). B, MS3 sequencing of the unique MS2 peptide fragment ions detected in A to unambiguously identify their sequences. C, identification of DSSO interlinks using MS1 parent mass. D, integration of the three lines of results from A–C for unambiguous identification of DSSO cross-linked peptides. CID, collision-induced dissociation.
Our cross-linking analysis of the yeast 19S RP has led to the identification of interlinked peptides consisting of intrasubunit and intersubunit interactions. An example of an intersubunit DSSO interlinked peptide identified by MSn analysis is displayed in Fig. 2. As shown, the example interlinked peptide was detected as a quadruply charged ion (m/z 470.51214+), which yielded an MS2 fragmentation pattern unique to DSSO interlinked peptides (25). The two most abundant peaks (m/z 565.81762+/366.20162+) observed in Fig. 2A were identified as fragment pairs αT/βA based on the mass relationship between expected fragments and the parent ion of DSSO interlinked peptides. In addition, another fragment pairs (αA/βT) (533.79942+/399.82832+) were also detected at lower abundance. These results confirmed that this peptide is a heterodimeric interlinked peptide (α-β). As seen in Fig. 2B, MS3 analysis of the MS2 fragment ion (m/z 565.81762+) identified its sequence as LTNQLKSLK matched to subunit Rpn8, in which the sixth residue (Lys-195 in the full-length sequence of Rpn8) is modified with the unsaturated thiol (T) fragment moiety. MS3 sequencing of another MS fragment ion (m/z 366.20162+) identified its sequence as TAKETK matched to subunit Rpn11, in which the third residue (Lys-208 in the full-length sequence of Rpn11) is modified with the alkene (A) fragment moiety. Combined with the MS-Bridge result by mass mapping of the parent ion (m/z 470.51214+) measured in MS1, we have identified this DSSO interlinked peptide as LTNQLK195SLK interlinked to TAK208ETK unambiguously, which represents an intersubunit interaction between Rpn8 and Rpn11 (Fig. 2D). Rpn8 and Rpn11 are the only two non-ATPase subunits that contain an N-terminal MPN domain. Unlike Rpn8, the Rpn11 has a zinc-binding motif-containing MPN domain that is responsible for its deubiquitination activity (11, 16). During the course of our study, two recent reports have shown that Rpn8 is in close contact with Rpn11 in the proteasome structure (20, 21). The identification of the cross-link between Rpn8 and Rpn11 not only confirms their interaction but also provides information on their spatial proximity at specific amino acid residues for the first time.
To obtain comprehensive information on subunit connectivity, multiple cross-linking experiments were performed along with extensive peptide fractionations using strong cation exchange chromatography prior to LC MSn. In total, 624 DSSO interlinked peptides of the yeast 19S RP have been identified in this work, corresponding to 208 unique intrasubunit (data not shown) and 43 unique intersubunit interlinks. Because only interlinked peptides between two different subunits are used for topological studies, only those MSn spectra are reported here as illustrated in supplemental Fig. 1, and the detailed list of the redundant DSSO interlinked peptides is summarized in supplemental Table 1. Based on the identified intersubunit cross-links, 24 unique pairwise interactions were identified among the 19S subunits with nine being base-to-base (among subunits Rpt1–6, Rpn2, and Rpn13), 12 being lid-to-lid (among subunits Rpn3, Rpn5–9, Rpn11–12, and Rpn15/Sem1), and three being lid-to-base interactions (among subunits Rpt1, Rpt5, Rpn7–9, and Rpn10–11) as summarized in Table I. In comparison with previous reports on subunit interactions using various biochemical approaches including two-hybrid, in vitro pulldown and cross-linking analyses (17, 19, 21, 35–39), eight novel pair-wise interactions (i.e., Rpn3–Rpn8, Rpn6–Rpn7, Rpn6–Rpn11, Rpn7–Rpn11, Rpn2–Rpn13, Rpt1–Rpt6, Rpn8–Rpn10, and Rpn10–Rpn11) have been determined for the first time in yeast 19S RP based on the identification of nine unique lysine-lysine linkages in this study (supplemental Table 2). In addition, we have identified new interlinked peptides to confirm 16 known interactions, eight of which did not have any prior information on protein interaction interfaces. This represents a significant amount of new information regarding to the 19S subunit interconnectivity, which has led to the generation of a comprehensive cross-link map of the 19S RP with a total 43 unique lysine-lysine linkages (Fig. 3). Therefore, our results have provided new molecular linkages to allow more detailed structural characterization of the proteasome complex at peptide level resolution.
Table I. Summary of unique intersubunit interlinks of the yeast 19S RP identified by DSSO cross-linking and LC MSn.
See supplemental Table 2 for detailed references.
| Within 19S Lid | Within 19S Base | ||
| Rpn3–Rpn7a,b | Rpn3:K353–Rpn7:K375 | Rpn2–Rpn13 | Rpn2:K911–Rpn13:K119 |
| Rpn3:K389–Rpn7:K416 | |||
| Rpn2–Rpt2a,b | Rpn2:K689–Rpt2:K94 | ||
| Rpn3–Rpn8 | Rpn3:K299–Rpn8:K299 | ||
| Rpn3:K485–Rpn8:K300 | Rpn2–Rpt6a,b | Rpn2:K689–Rpt6:K82 | |
| Rpn2:K689–Rpt6:K100 | |||
| Rpn3–Rpn12a | Rpn3:K368–Rpn12:K134 | ||
| Rpn3:K373–Rpn12:K134 | Rpt1–Rpt2a | Rpt1:K50–Rpt2:K58 | |
| Rpn3–Rpn15a | Rpn3:K58–Rpn15:K26 | Rpt1–Rpt5a,b | Rpt1:K154–Rpt5:K120 |
| Rpt1:K154–Rpt5:K168 | |||
| Rpn5–Rpn6a | Rpn5:K190–Rpn6:K288 | ||
| Rpt1–Rpt6 | Rpt1:K282–Rpt6:K334 | ||
| Rpn5–Rpn9a,b | Rpn5:K258–Rpn9:K182 | ||
| Rpn5:K292–Rpn9:K140 | Rpt2–Rpt6a | Rpt2:K94–Rpt6:K100 | |
| Rpn5:K292–Rpn9:K145 | |||
| Rpt3–Rpt6a,b | Rpt3:K76–Rpt6:K54 | ||
| Rpn6–Rpn7 | Rpn6:K421–Rpn7:K225 | Rpt3:K87–Rpt6:K54 | |
| Rpn6–Rpn11 | Rpn6:K421–Rpn11:K253 | Rpt4–Rpt5a,b | Rpt4:K55–Rpt5:K35 |
| Rpt4:K63–Rpt5:K35 | |||
| Rpn7–Rpn11 | Rpn7:K211–Rpn11:K12 | Rpt4:K90–Rpt5:K66 | |
| Rpt4:120–Rpt5:120 | |||
| Rpn7–Rpn15a | Rpn7:K416–Rpn15:K18 | ||
| Rpn7:K416–Rpn15:K20 | Between 19S Lid and Base | ||
| Rpn8–Rpn10 | Rpn8:K28–Rpn10:K104 | ||
| Rpn8–Rpn9a | Rpn8:K82–Rpn9:K155 | ||
| Rpn8:K82–Rpn9:K159 | Rpn9–Rpt5a,b | Rpn9:K72–Rpt5:K35 | |
| Rpn8:K86–Rpn9:K159 | |||
| Rpn8:K198–Rpn9:K382/K383 | Rpn10–Rpn11 | Rpn10:K104–Rpn11:K96 | |
| Rpn8–Rpn11a | Rpn8:K7–Rpn11:K218 | ||
| Rpn8:K28–Rpn11:K96 | |||
| Rpn8:K195–Rpn11:K208 | |||
| Rpn8:K263–Rpn11:K12 | |||
| Rpn8:K300–Rpn11:K267 |
a Subunit level interaction seen in literature.
b Peptide level interaction seen in literature.
Fig. 3.

DSSO cross-linking map of the yeast 19S RP. Forty-four unique lysine-lysine linkages are shown between primary sequences of 19S RP subunits with blue lines as lid-lid cross-links, purple lines as base-base, and green lines as lid-base. Six PCI domain-containing subunits, Rpn3, Rpn5–7, Rpn9, and Rpn12, forming a lid subcomplex within a horseshoe shape are outlined in red dots. The two MPN domain-containing subunits, Rpn8 and Rpn11. Six AAA-ATPase domain-containing subunits, Rpt1–6, forming the AAA-ATPase base ring are outlined in gray dots. Rpn2 contains α-helical repeats, and Rpn10 has an N-terminal von Willebrand factor type A (VWA) domain and a C-terminal ubiquitin-interacting motif (UIM) domain. Rpn13 has a ubiquitin-binding pleckstrin homology domain. Major structural domains in each subunit were determined by GlobPlot (http://globplot.embl.de) and are depicted approximately to scale here.
Developing a New Probabilistic Analysis Platform for Generating the Maximum Likelihood Topology of the 19S Hexametric AAA-ATPase Ring
In previous XL/MS studies (24, 25, 40, 41), cross-linked peptides of protein complexes have been successfully used to support known structures and/or provide spatial proximity of cross-linked proteins. So far, spatial organization of proteins within a complex has not been determined primarily based on cross-linked data. Therefore, we aimed to develop a rigorous probabilistic analysis platform to examine the likelihood of possible topologies using the identified cross-linked peptides and thus derive a topological model of the 19S RP with the ML. The schematic representation of our probabilistic framework is illustrated in Fig. 4. To develop this strategy and evaluate its validity, we have first carried out the probabilistic analysis to infer the spatial ordering of the AAA-ATPase base ring in the yeast 19S RP. It is well recognized that the six AAA-ATPase subunits (Rpt1–6) form a hexameric ring (5, 15). Although crystal structures of the yeast AAA-ATPase ring are not available, recent studies have proposed the assembly mechanism underlying the formation of a hexameric ring, and various structural and biochemical evidence has suggested that the AAA-ATPase ring is most likely in the form of Rpt1–2-6–3-4–5 (14, 17, 18, 26–28, 42). In this work, we have identified 105 DSSO interlinked peptides, representing 11 unique intersubunit lysine-lysine linkages among the six Rpt subunits. Based on known cyclic structures of PAN homohexamers (43, 44), we assumed each Rpt subunit interacts directly with only two other Rpt subunits in the base ring (Fig. 4A). Given this constraint (I), there will be 60 possible unique graphs (G) representing all possible topological ordering of six Rpt subunits in a ring (Fig. 4B). Among them, one graph (G*) would describe the true topology of the complex, from which our cross-linking results were obtained experimentally. Each graph (G) can be depicted by the set of vertices (V) and the set of undirected edges (E). Assuming that adjacent subunits would have higher chance of producing cross-links than nonadjacent subunits, we have introduced a parameter D as the data matrix representing how often a cross-link between two vertices (i, j) is observed by MS measurements, i.e., the number of lysine-lysine cross-links identified between two different subunits (Fig. 4C). Thus, the likelihood P(G = G*|D, I) that each graph (G) corresponds to the true topology was calculated over a range of values of p (equation 4), where p is the probability that a randomly drawn cross-link comes from adjacent subunits (see supplemental “Methods” and supplemental Fig. 2).
Fig. 4.

The probabilistic analysis workflow for determining the ML topology model of the 19S ATPase hexamer. The probabilistic framework uses the data generated from the observed cross-links (i.e., cross-links identified in this study) to quantify the likelihood that the maximum likelihood model (GML) is the true graph considering all possible graphs. A, defining the graph structure: the ATPase base complex has a ring structure, but the true ordering is unknown. This graph structure can be represented by a subunit adjacency matrix. B, enumerating subunit orderings. There are 60 possible orderings for this shape with only four possible ones shown. C, generating cross-link data matrix. Counts of observed cross-links between subunits are used to populate a data matrix. This panel shows the data matrix generated from 11 unique cross-links. D, the plots of probability of the ML graph (G) as a function of p calculated using either the data consisting only of 11 unique lysine-lysine pairs observed in the raw data (nonredundant) (left panel) or the data consisting of 105 lysine-lysine pairs (redundant) (right panel). The x axis is the probability (p) that a randomly drawn cross-link comes from adjacent subunits. In both panels, the probabilities associated with the ML graph are shown with diamonds, and the probabilities associated with the second most likely graph are shown with circles. E, the ML topology ordering of the 19S ATPase hexamer is determined as Rpt1–2-6–3-4–5. The identified unique lysine-lysine cross-links between 19S base subunits Rpt1–6 are shown.
Based on the calculated probabilities, the GML (also called the most likely topology) and the second most likely graph (GML2) can be identified. To determine the confidence of the model with respect to these two graphs and all other possible graphs, we plotted their likelihood values (i.e., P(GML|D,I) and P(GML2|D,I)) as a function of p in Fig. 4D over the range of all relevant values of p > 0.4, which corresponds to greater than equal probability of drawing a cross-link from an adjacent pair and from a specific nonadjacent pair (see “Experimental Procedures” and supplemental “Methods” for details). The plot in the left panel of Fig. 4D utilizes the data matrix (D) consisting of only 11 unique and nonredundant lysine-lysine linkages between any two Rpt subunits determined experimentally in this work. As shown, as the value of p increases, both P(GML|D,I) and the ratio of P(GML|D,I)/P(GML2|D,I) also increase, thus leading to increased difference between the maximum and the second most likely graphs. The same qualitative result was obtained when a similar plot was generated as shown in the right panel of Fig. 4D using the data matrix (D) that contains a total of 105 redundant intersubunit lysine-lysine linkages identified between Rpt subunits.
Because the value of p corresponds to the accuracy of the data in the context of the graphical representation of a protein complex, the higher the value of p, the more likely it is that the maximum likelihood graph is the true graph (i.e., GML = G*). Because the value of p is unknown, any information that could constrain the value to a range is most useful. If we assume that the maximum likelihood Rpt subunit ordering is the true ordering (GML = G*), then the value of p that maximizes P(GML|D,I) is at p = 0.90 (10 of our observed 11 Rpt-Rpt cross-links were from adjacent subunits based on the assumed ordering). The 95% confidence interval on p = 0.90 is defined by P(0.66 ≤ p ≤ 1.0) = 0.95 (see supplemental “Methods” and supplemental Fig. 3A), meaning p > 0.66 is a highly probable range to consider when choosing which graph would be the ML graph. To generate a confidence interval on p using a known complex structure and external cross-linking data, we have undertaken similar analyses on the yeast RNAPII complex (24). According to the crystal structure of RNAPII complex, we have defined its subunits with a shared interface of at least 250 Å2 as adjacent. Therefore, 53 of 65 reported cross-links of RNAPII complex resulted from adjacent subunits (24). Based on this, we have determined that the 95% confidence interval on p is defined by P(0.72 ≤ p ≤ 1.0) for RNAPII complex (supplemental Fig. 3B), which is in good coordination with that of the 19S base ring subcomplex (see supplemental “Methods” on establishing confidence intervals on p for details). This further supports the significance of the p determined from our experimental results.
As a result, considering the relevant ranges of values of p ≥ 0.4, both interpretations of the cross-linking data have derived the same topological models, i.e., the maximum likelihood graphs (GML), with the spatial ordering of yeast 19S base subunits as Rpt1–2-6–3-4–5 (Fig. 4E). In comparison with the GML2 topology of the base ring (supplemental Fig. 4A), only the GML topology is in excellent agreement with our current knowledge of AAA-ATPase ring structures of proteasome complexes (14, 17, 18, 26–28, 42), thus demonstrating the effectiveness of our probabilistic analysis platform for inferring protein complex topologies and assessing their confidence using cross-linking data.
Maximum Likelihood Topology of the 19S RP Lid Subcomplex
During the course of our study, structural models for the 19S lid subcomplex composed of six PCI domain-containing non-ATPase subunits (i.e., Rpn3, Rpn5, Rpn6, Rpn7, Rpn9, and Rpn12) were recently proposed as a horseshoe shape (20, 21). Although also a heterohexamer, this PCI subcomplex of the 19S lid has a different shape and structure than the 19S ATPase base ring. To further evaluate whether our probabilistic analysis platform can be directly applied to a less ordered structure, we have carried out similar analysis to the 19S lid subcomplex, the PCI heterohexamer, to identify its ML topology and distinguish it from all possible topological graphs. In contrast to the closed AAA-ATPase base ring, the PCI heterohexamer has a horseshoe shape with an open end between two terminal subunits. To simplify our analysis, we consider the PCI heterohexamer in the form of A-B-C-D-E-F, in which we assume each of the four internal subunits (B, C, D, and E) interact with two adjacent subunits, and each of the two terminal subunits interacts with one adjacent subunit. Given these constraints (I), there are 360 unique graphs (G) representing all possible topological ordering of the six PCI domain-containing subunits. Similarly, we computed the likelihood values (equation 2) for all 360 graph structures for the GML as a function of p. Given the same shape, the probability of the maximum likelihood graph with respect to all possible graphs (Equation 7) is plotted for p in the range of [0.4,1.0] using either nine unique (Fig. 5A) or 30 redundant lysine-lysine linkages (Fig. 5B) of the PCI heterohexamer identified here. When p > 0.79, P(GML = G*|D,I) (i.e., the probability that ML graph is the true graph GML) is greater than the sum of the probabilities associated with the other 359 graphs combined. At p = 0.8, GML is eight times more likely than the second most likely individual graph (GML2). Furthermore, for p > 0.5, GML is at least twice as likely as GML2. Therefore, considering the most likely values of p, our probabilistic analysis infers that the ML topology (GML) of the PCI heterohexamer is Rpn9–5-6–7-3–12 (Fig. 5C) with high confidence. In comparison with the GML2 topology of the PCI heterohexamer (supplemental Fig. 4B), only the GML topology matches perfectly with the subunit ordering proposed by two recent reports (20, 21).
Fig. 5.

Determination of the maximum likelihood topology model of the 19S lid PCI domain-containing heterohexamer by probabilistic analysis of identified cross-links. A and B, the plots of probability of the ML graph (G) as a function of p calculated using either the data consisting only of nine unique lysine-lysine pairs observed in the raw data (nonredundant) in A or the data consisting of 30 lysine-lysine pairs (redundant) in B. The x axis is the probability (p) that a randomly drawn cross-link comes from adjacent subunits. In both panels the probabilities associated with the ML graph are shown with diamonds, and the probabilities associated with the second most likely graph are shown with circles. C, the ML topology ordering of the 19S lid PCI heterohexamer is determined as Rpn9–5-6–7-3–12. The identified unique lysine-lysine cross-links between 19S lid subunits are shown.
DISCUSSION
We have successfully employed a new integrated cross-linking strategy to unravel the spatial organization of the yeast 19S RP complex through the identification of cross-linked peptides and probabilistic modeling. In comparison with our previous cross-linking study on the yeast 20S proteasome (25), the total number of cross-linked peptides of the 19S RP has been significantly increased mainly because of improved sample preparation and data analysis workflow as well as the 19S RP containing more subunits and flexible regions. The results have further demonstrated the effectiveness of the new MS-cleavable DSSO cross-linking strategy for studying large protein complexes, highlighting the unambiguous identification of interfacing lysines by MSn analysis as an advantage of our strategy. In this analysis, we have identified not only unique binary interactions of proteasome subunits but also specific peptide linkages between lysine residues at protein interaction interfaces, thus allowing computational modeling of topological structure of proteasome complexes.
In this work, we have developed a rigorous probabilistic analysis platform to derive the maximum likelihood topology of the 19S AAA-ATPase base ring as well as the lid PCI heterohexamer, representing the first example of probabilistic analysis of cross-link data for topology prediction of protein complexes. This framework allows us to efficiently assess possible spatial organization of subunits in a given complex with a probability based on observed cross-link data, thus generating a rationalized prediction of topological ordering of proteins. In the context of a known architecture (or limited number of possible architectures) with unknown subunit ordering, the probabilistic interpretation of intersubunit cross-links described in this work provides a simple, yet rigorous, method to infer the maximum likelihood model and assess the relative confidence in the model. Our approach can be applied to study topologies of protein complexes by any group working with cross-linking data. In addition, it should serve as a baseline method for assessing topological information offered by complicated modeling procedures such as those shown recently by Kalisman et al. (45), in which a combinatorial homology modeling approach was used to determine the arrangement of the bovine TRiC chaperonin octameric rings. Although a high confidence model was produced based on cross-linking data, their proposed methodology depends on homology models of each subunit. In the specific case of the data of Kalisman et al. (45), our approach, which requires only the counts of unique intersubunit cross-links, results in the same model of the octameric rings with very high confidence (supplemental Fig. 5). This further demonstrates the effectiveness of our probabilistic analysis platform.
The probabilistic interpretation of our cross-linking data has derived the ML topology of the AAA-ATPase ring in the order of Rpt1–2-6–3-4–5, which is in consensus of recent studies (17, 18, 28). The Rpt base assembly has been postulated to be a trimer of dimers, in which the six unique Rpt subunits first form dimer complexes (i.e., Rpt1/2, Rpt3/6, and Rpt4/5) along with their respective chaperone proteins and then converge into a trimer to form a hexameric ring as seen in the 26S holocomplex (27, 28). Coincidently, our predicted Rpt1–2-6–3-4–5 order exhibits the dimer precursor pattern in the final ring structure. In our analysis, multiple cross-links among the three Rpt dimers have been identified, among which cross-links of Rpt4/5 dimer appear to be most frequently detected with highest spectral counts, suggesting their close contact with highly cross-linkable lysines at their interaction interfaces. In addition, detection of binary interactions of Rpt2 to Rpt6 and Rpt1 to Rpt5 further confirms their adjacency in the ordered hexameric ring. Together, our data strongly correlate with current knowledge of the AAA-ATPase ring assembly and topology and provide the first topological model generated by cross-linking data alone.
In addition to our probabilistic modeling of the ML ordering of the 19S lid PCI heterohexamer that corroborates with recently determined topology (20, 21), we have shown that multiple linkages between each adjacent subunit of the PCI subcomplex at their C-terminal ends have been identified, thus further confirming the spatial organization of the PCI domain-containing heterohexamer (Fig. 3). Our results support the notion that the N-terminal domains are distal to each other (thus not possibly cross-linked because of the maximum range of DSSO) and extend similarly to a hand-shaped structure. In addition, many cross-links between Rpn8 and Rpn11 have been identified that clearly indicate their close proximity in space supporting the proposed heterodimeric interaction in the lid structure (21). Moreover, our cross-linking results have demonstrated that Rpn8 is in close contact with Rpn9 and Rpn3, confirming cryo-EM maps where Rpn8 displays an extended conformation to connect Rpn3 and Rpn9 and thus closes the PCI heterohexamer horseshoe arrangement (20, 21). In comparison with other cross-linking studies, although we did not observe the cross-links between Rpn11 and Rpt6 (21), we have identified two new interactions for Rpn11, i.e., Rpn11:K253 to Rpn6:K421 and Rpn11:K12 to Rpn7:K211 in our study. Apart from Rpn8, Rpn11 was suggested to have extensive contacts with Rpn9 and Rpn5 (20); however, our results show that Rpn11 appears to be close to Rpn6 and Rpn7 of the PCI subcomplex as well.
One of the new and important interaction interfaces identified here is the interaction between Rpn2:K911 and Rpn13:K119. Rpn2 is a critical scaffolding protein in the proteasome structure for docking ubiquitin receptor proteins such as Rpn13 as well as deubiquitinases (4). Rpn13 is an inherent proteasome subunit functioning as an ubiquitin receptor responsible for recognizing and delivering ubiquitinated substrates to proteasome for degradation (46, 47). Rpn13 interacts with Rpn2 in the proteasome through its N-terminal ubiquitin/proteasome-binding domain, namely the Pru (pleckstrin-like receptor for ubiquitin) domain that is conserved in eukaryotes (46, 48). The N-terminal Pru domain of human Rpn13 has been shown to bind directly to the C-terminus of human Rpn2 (797–953) (49). Lys-119 in yeast Rpn13 is located at its Pru domain, whereas K911 is located at the C-terminal coiled-coil region of yeast Rpn2. The identification of Rpn13:K119 to Rpn2:K911 provides the first direct evidence at specific amino acid residues to support their physical interaction at the interface similar to that of their human orthologs.
Similar to Rpn2, Rpn1 also serves as a key molecular scaffold that mediates proteasome interaction with a variety of factors such as ubiquitin receptors (4). Although Rpn2 binds to ubiquitin receptor Rpn13 directly, Rpn1 has been shown to physically interact with other types of ubiquitin receptor proteins including Rad23 and Dsk2 (4). Although the interactions of Rpn1 with several subunits including Rpt6 and Rpn10 have been shown by in vitro reconstitution assay (50–52) and we have detected extensive cross-links within Rpn1 itself (data not shown), it is noted that no cross-links were identified between Rpn1 and any other proteasome subunits in our study as well as other cross-linking studies of proteasome complexes (17, 21). This suggests that Rpn1 may be highly mobile and that its interactions with other proteasome subunits are not detectable by current cross-linking strategies. Recent EM maps of 26S proteasome complexes have indicated that Rpn1 is conformationally variable in the proteasome structure while locating at the periphery of the ATPase ring (21). Interestingly, such an absence of detectable cross-linking between a highly mobile subunit and the rest of the protein complex has also been analogously described for the RNA polymerase II-TFIIF complex (24), suggesting that effective cross-linking of proteins with dynamic natures by NHS esters may require certain constraints on protein interaction interfaces to allow MS detectable cross-links. New cross-linking strategies may be needed to capture such labile and dynamic interactions.
Recent studies have shown that cross-linking data can be complementary to other structural tools such as cryo-EM in elucidating architectures of protein complexes (17, 21). Although EM has been quite powerful for probing structural topologies (17, 18, 21), there are often areas with unassigned electron densities caused by limited resolution. In addition, small protein subunits are often not well represented in EM maps. Among the subunits of the 19S RP, Rpn15/Sem1 is the smallest protein with a molecular weight of ∼15 kDa. During the 19S lid assembly, it has been suggested that Rpn15/Sem1 first forms a module with two PCI subunits Rpn3 and Rpn7, which then incorporates with a core module consisting of Rpn5, Rpn6, Rpn8, Rpn9, and Rpn11 followed by subsequent integration of Rpn12 to form the integral lid (53). Rpn15/Sem1 appears to be important in proteasome assembly and stability as SEM1 deletion leads to pervasive proteasome defects (54). Because of its small size, Rpn15/Sem1 was not assigned in current cryo-EM maps, and its interactions with other proteasome subunits were not detected by previous cross-linking studies (20, 21). Here, we have shown that our DSSO cross-linking strategy has allowed the identification of one unique cross-link between Rpn15/Sem1 and Rpn3 and two unique interactions between Rpn15/Sem1 and Rpn7. This supports the close relationship of Rpn15/Sem1 with Rpn3 and Rpn7 previously observed by biochemical experiments. Based on these specific interactions and the positions of Rpn3 and Rpn7 in the 19S RP, we suspect that Rpn15/Sem1 would be located at the side of the PCI subcomplex.
In summary, we have successfully mapped the topology of the yeast 19S RP subcomplexes using our newly developed cross-linking strategy and probabilistic modeling. This type of analysis significantly expands the potential and efficacy of cross-linking studies in elucidating architectures of protein complexes to a level beyond simple confirmation and/or refinement of known structures.
Supplementary Material
Acknowledgments
We thank members of the Huang laboratory for help during this study. We thank A. L. Burlingame, Peter Baker, Larry Schweitzer, and Robert Chalkley at University of California San Francisco for using Protein Prospector.
Footnotes
* This work was supported by National Institutes of Health Grants K99LM010821 (to A. R.), 5T15LM007443-10 (biomedical informatics training predoctoral fellowship to A. K.), RO1LM010235 (to P. B.), and RO1GM74830-06A1 (to L. H.).
 This article contains supplemental material.
1 The abbreviations used are:
- CP
- core particle
- RP
- regulatory particle
- cryo-EM
- cryo-electron microscopy
- XL-MS
- cross-linking coupled with mass spectrometry
- DSSO
- disuccinimidyl sulfoxide
- MS2
- tandem mass spectrometry
- MSn
- multi-stage tandem mass spectrometry
- LC MSn
- liquid chromatography multi-stage tandem mass spectrometry
- MS3
- third stage mass spectrometry
- ML
- maximum likelihood
- RNAPII
- RNA Polymerase II
- PCI domain
- proteasome/COP9 signalosome/initiation factor 3 component
- MPN
- Mpr1p and Pad1p N-termini.
REFERENCES
- 1. Goldberg A. L. (2003) Protein degradation and protection against misfolded or damaged proteins. Nature 426, 895–899 [DOI] [PubMed] [Google Scholar]
- 2. Hershko A., Ciechanover A. (1998) The ubiquitin system. Annu. Rev. Biochem. 67, 425–479 [DOI] [PubMed] [Google Scholar]
- 3. Voges D., Zwickl P., Baumeister W. (1999) The 26S proteasome: A molecular machine designed for controlled proteolysis. Annu. Rev. Biochem. 68, 1015–1068 [DOI] [PubMed] [Google Scholar]
- 4. Finley D. (2009) Recognition and processing of ubiquitin-protein conjugates by the proteasome. Annu. Rev. Biochem. 78, 477–513 [DOI] [PMC free article] [PubMed] [Google Scholar]
- 5. Bedford L., Paine S., Sheppard P. W., Mayer R. J., Roelofs J. (2010) Assembly, structure, and function of the 26S proteasome. Trends Cell Biol. 20, 391–401 [DOI] [PMC free article] [PubMed] [Google Scholar]
- 6. Groll M., Ditzel L., Löwe J., Stock D., Bochtler M., Bartunik H. D., Huber R. (1997) Structure of 20S proteasome from yeast at 2.4 A resolution. Nature 386, 463–471 [DOI] [PubMed] [Google Scholar]
- 7. Glickman M. H., Rubin D. M., Fried V. A., Finley D. (1998) The regulatory particle of the Saccharomyces cerevisiae proteasome. Mol. Cell. Biol. 18, 3149–3162 [DOI] [PMC free article] [PubMed] [Google Scholar]
- 8. Schmidt M., Hanna J., Elsasser S., Finley D. (2005) Proteasome-associated proteins: Regulation of a proteolytic machine. Biol. Chem. 386, 725–737 [DOI] [PubMed] [Google Scholar]
- 9. Verma R., Oania R., Graumann J., Deshaies R. J. (2004) Multiubiquitin chain receptors define a layer of substrate selectivity in the ubiquitin-proteasome system. Cell 118, 99–110 [DOI] [PubMed] [Google Scholar]
- 10. Elsasser S., Finley D. (2005) Delivery of ubiquitinated substrates to protein-unfolding machines. Nat. Cell Biol. 7, 742–749 [DOI] [PubMed] [Google Scholar]
- 11. Verma R., Aravind L., Oania R., McDonald W. H., Yates J. R., 3rd, Koonin E. V., Deshaies R. J. (2002) Role of Rpn11 metalloprotease in deubiquitination and degradation by the 26S proteasome. Science 298, 611–615 [DOI] [PubMed] [Google Scholar]
- 12. Pickart C. M., Cohen R. E. (2004) Proteasomes and their kin: Proteases in the machine age. Nat. Rev. Mol. Cell Biol. 5, 177–187 [DOI] [PubMed] [Google Scholar]
- 13. Elsasser S., Gali R. R., Schwickart M., Larsen C. N., Leggett D. S., Müller B., Feng M. T., Tübing F., Dittmar G. A., Finley D. (2002) Proteasome subunit Rpn1 binds ubiquitin-like protein domains. Nat. Cell Biol. 4, 725–730 [DOI] [PubMed] [Google Scholar]
- 14. Tomko R. J., Jr., Hochstrasser M. (2011) Order of the proteasomal ATPases and eukaryotic proteasome assembly. Cell Biochem. Biophys. 60, 13–20 [DOI] [PMC free article] [PubMed] [Google Scholar]
- 15. Bar-Nun S., Glickman M. H. (2012) Proteasomal AAA-ATPases: Structure and function. Biochim Biophys Acta 1823, 67–82 [DOI] [PubMed] [Google Scholar]
- 16. Yao T., Cohen R. E. (2002) A cryptic protease couples deubiquitination and degradation by the proteasome. Nature 419, 403–407 [DOI] [PubMed] [Google Scholar]
- 17. Bohn S., Beck F., Sakata E., Walzthoeni T., Beck M., Aebersold R., Förster F., Baumeister W., Nickell S. (2010) Structure of the 26S proteasome from Schizosaccharomyces pombe at subnanometer resolution. Proc. Natl. Acad. Sci. U.S.A. 107, 20992–20997 [DOI] [PMC free article] [PubMed] [Google Scholar]
- 18. Nickell S., Beck F., Scheres S. H., Korinek A., Förster F., Lasker K., Mihalache O., Sun N., Nagy I., Sali A., Plitzko J. M., Carazo J. M., Mann M., Baumeister W. (2009) Insights into the molecular architecture of the 26S proteasome. Proc. Natl. Acad. Sci. U.S.A. 106, 11943–11947 [DOI] [PMC free article] [PubMed] [Google Scholar]
- 19. Sharon M., Taverner T., Ambroggio X. I., Deshaies R. J., Robinson C. V. (2006) Structural organization of the 19S proteasome lid: Insights from MS of intact complexes. PLoS Biol. 4, e267. [DOI] [PMC free article] [PubMed] [Google Scholar]
- 20. Lander G. C., Estrin E., Matyskiela M. E., Bashore C., Nogales E., Martin A. (2012) Complete subunit architecture of the proteasome regulatory particle. Nature 482, 186–191 [DOI] [PMC free article] [PubMed] [Google Scholar]
- 21. Lasker K., Förster F., Bohn S., Walzthoeni T., Villa E., Unverdorben P., Beck F., Aebersold R., Sali A., Baumeister W. (2012) Molecular architecture of the 26S proteasome holocomplex determined by an integrative approach. Proc. Natl. Acad. Sci. U.S.A. 109, 1380–1387 [DOI] [PMC free article] [PubMed] [Google Scholar]
- 22. Leitner A., Walzthoeni T., Kahraman A., Herzog F., Rinner O., Beck M., Aebersold R. (2010) Probing native protein structures by chemical cross-linking, mass spectrometry, and bioinformatics. Mol. Cell. Proteomics 9, 1634–1649 [DOI] [PMC free article] [PubMed] [Google Scholar]
- 23. Young M. M., Tang N., Hempel J. C., Oshiro C. M., Taylor E. W., Kuntz I. D., Gibson B. W., Dollinger G. (2000) High throughput protein fold identification by using experimental constraints derived from intramolecular cross-links and mass spectrometry. Proc. Natl. Acad. Sci. U.S.A. 97, 5802–5806 [DOI] [PMC free article] [PubMed] [Google Scholar]
- 24. Chen Z. A., Jawhari A., Fischer L., Buchen C., Tahir S., Kamenski T., Rasmussen M., Lariviere L., Bukowski-Wills J. C., Nilges M., Cramer P., Rappsilber J. (2010) Architecture of the RNA polymerase II-TFIIF complex revealed by cross-linking and mass spectrometry. EMBO J. 29, 717–726 [DOI] [PMC free article] [PubMed] [Google Scholar]
- 25. Kao A., Chiu C. L., Vellucci D., Yang Y., Patel V. R., Guan S., Randall A., Baldi P., Rychnovsky S. D., Huang L. (2011) Development of a novel cross-linking strategy for fast and accurate identification of cross-linked peptides of protein complexes. Mol. Cell. Proteomics 10, 10.1074/mcp.M110.002212 [DOI] [PMC free article] [PubMed] [Google Scholar]
- 26. Funakoshi M., Tomko R. J., Jr., Kobayashi H., Hochstrasser M. (2009) Multiple assembly chaperones govern biogenesis of the proteasome regulatory particle base. Cell 137, 887–899 [DOI] [PMC free article] [PubMed] [Google Scholar]
- 27. Park S., Roelofs J., Kim W., Robert J., Schmidt M., Gygi S. P., Finley D. (2009) Hexameric assembly of the proteasomal ATPases is templated through their C termini. Nature 459, 866–870 [DOI] [PMC free article] [PubMed] [Google Scholar]
- 28. Tomko R. J., Jr., Funakoshi M., Schneider K., Wang J., Hochstrasser M. (2010) Heterohexameric ring arrangement of the eukaryotic proteasomal ATPases: Implications for proteasome structure and assembly. Mol. Cell 38, 393–403 [DOI] [PMC free article] [PubMed] [Google Scholar]
- 29. Leggett D. S., Hanna J., Borodovsky A., Crosas B., Schmidt M., Baker R. T., Walz T., Ploegh H., Finley D. (2002) Multiple associated proteins regulate proteasome structure and function. Mol. Cell 10, 495–507 [DOI] [PubMed] [Google Scholar]
- 30. Wang X., Yen J., Kaiser P., Huang L. (2010) Regulation of the 26S proteasome complex during oxidative stress. Sci. Signal. 3, ra88. [DOI] [PMC free article] [PubMed] [Google Scholar]
- 31. Vellucci D., Kao A., Kaake R. M., Rychnovsky S. D., Huang L. (2010) Selective enrichment and identification of azide-tagged cross-linked peptides using chemical ligation and mass spectrometry. J. Am. Soc. Mass Spectrom. 21, 1432–1445 [DOI] [PMC free article] [PubMed] [Google Scholar]
- 32. Kaake R. M., Milenković T., Przulj N., Kaiser P., Huang L. (2010) Characterization of cell cycle specific protein interaction networks of the yeast 26S proteasome complex by the QTAX strategy. J. Proteome Res. 9, 2016–2029 [DOI] [PMC free article] [PubMed] [Google Scholar]
- 33. Chu F., Baker P. R., Burlingame A. L., Chalkley R. J. (2010) Finding chimeras: A bioinformatic strategy for identification of cross-linked peptides. Mol. Cell. Proteomics 9, 25–31 [DOI] [PMC free article] [PubMed] [Google Scholar]
- 34. Schilling B., Row R. H., Gibson B. W., Guo X., Young M. M. (2003) Ms2assign, automated assignment and nomenclature of tandem mass spectra of chemically crosslinked peptides. J. Am. Soc. Mass Spectrom. 14, 834–850 [DOI] [PubMed] [Google Scholar]
- 35. Uetz P., Giot L., Cagney G., Mansfield T. A., Judson R. S., Knight J. R., Lockshon D., Narayan V., Srinivasan M., Pochart P., Qureshi-Emili A., Li Y., Godwin B., Conover D., Kalbfleisch T., Vijayadamodar G., Yang M., Johnston M., Fields S., Rothberg J. M. (2000) A Comprehensive analysis of protein-protein interactions in Saccharomyces cerevisiae. Nature 403, 623–627 [DOI] [PubMed] [Google Scholar]
- 36. Cagney G., Uetz P., Fields S. (2001) Two-hybrid analysis of the Saccharomyces cerevisiae 26S proteasome. Physiol. Genomics 7, 27–34 [DOI] [PubMed] [Google Scholar]
- 37. Davy A., Bello P., Thierry-Mieg N., Vaglio P., Hitti J., Doucette-Stamm L., Thierry-Mieg D., Reboul J., Boulton S., Walhout A. J., Coux O., Vidal M. (2001) A protein-protein interaction map of the Caenorhabditis elegans 26S proteasome. EMBO Rep. 2, 821–828 [DOI] [PMC free article] [PubMed] [Google Scholar]
- 38. Hartmann-Petersen R., Tanaka K., Hendil K. B. (2001) Quaternary structure of the ATPase complex of human 26S proteasomes determined by chemical cross-linking. Arch Biochem. Biophys. 386, 89–94 [DOI] [PubMed] [Google Scholar]
- 39. Fu H., Reis N., Lee Y., Glickman M. H., Vierstra R. D. (2001) Subunit interaction maps for the regulatory particle of the 26S proteasome and the Cop9 signalosome. EMBO J. 20, 7096–7107 [DOI] [PMC free article] [PubMed] [Google Scholar]
- 40. Chu F., Shan S. O., Moustakas D. T., Alber F., Egea P. F., Stroud R. M., Walter P., Burlingame A. L. (2004) Unraveling the interface of signal recognition particle and its receptor by using chemical cross-linking and tandem mass spectrometry. Proc. Natl. Acad. Sci. U.S.A. 101, 16454–16459 [DOI] [PMC free article] [PubMed] [Google Scholar]
- 41. Trnka M. J., Burlingame A. L. (2010) Topographic studies of the Groel-Groes chaperonin complex by chemical cross-linking using diformyl ethynylbenzene: The power of high resolution electron transfer dissociation for determination of both peptide sequences and their attachment sites. Mol. Cell. Proteomics 9, 2306–2317 [DOI] [PMC free article] [PubMed] [Google Scholar]
- 42. Förster F., Lasker K., Beck F., Nickell S., Sali A., Baumeister W. (2009) An atomic model AAA-ATPase/20S core particle sub-complex of the 26S proteasome. Biochem. Biophys. Res. Commun. 388, 228–233 [DOI] [PMC free article] [PubMed] [Google Scholar]
- 43. Zhang F., Hu M., Tian G., Zhang P., Finley D., Jeffrey P. D., Shi Y. (2009) Structural insights into the regulatory particle of the proteasome from Methanocaldococcus jannaschii. Mol. Cell 34, 473–484 [DOI] [PMC free article] [PubMed] [Google Scholar]
- 44. Djuranovic S., Hartmann M. D., Habeck M., Ursinus A., Zwickl P., Martin J., Lupas A. N., Zeth K. (2009) Structure and activity of the N-terminal substrate recognition domains in proteasomal atpases. Mol. Cell 34, 580–590 [DOI] [PubMed] [Google Scholar]
- 45. Kalisman N., Adams C. M., Levitt M. (2012) Subunit order of eukaryotic TRiC/CCT chaperonin by cross-linking, mass spectrometry, and combinatorial homology modeling. Proc. Natl. Acad. Sci. U.S.A. 109, 2884–2889 [DOI] [PMC free article] [PubMed] [Google Scholar]
- 46. Schreiner P., Chen X., Husnjak K., Randles L., Zhang N., Elsasser S., Finley D., Dikic I., Walters K. J., Groll M. (2008) Ubiquitin docking at the proteasome through a novel pleckstrin-homology domain interaction. Nature 453, 548–552 [DOI] [PMC free article] [PubMed] [Google Scholar]
- 47. Husnjak K., Elsasser S., Zhang N., Chen X., Randles L., Shi Y., Hofmann K., Walters K. J., Finley D., Dikic I. (2008) Proteasome subunit Rpn13 is a novel ubiquitin receptor. Nature 453, 481–488 [DOI] [PMC free article] [PubMed] [Google Scholar]
- 48. Hamazaki J., Iemura S., Natsume T., Yashiroda H., Tanaka K., Murata S. (2006) A novel proteasome interacting protein recruits the deubiquitinating enzyme Uch37 to 26S proteasomes. EMBO J. 25, 4524–4536 [DOI] [PMC free article] [PubMed] [Google Scholar]
- 49. Chen X., Lee B. H., Finley D., Walters K. J. (2010) Structure of proteasome ubiquitin receptor hRpn13 and its activation by the scaffolding protein hRpn2. Mol. Cell 38, 404–415 [DOI] [PMC free article] [PubMed] [Google Scholar]
- 50. Xie Y., Varshavsky A. (2000) Physical association of ubiquitin ligases and the 26S proteasome. Proc. Natl. Acad. Sci. U.S.A. 97, 2497–2502 [DOI] [PMC free article] [PubMed] [Google Scholar]
- 51. Xie Y., Varshavsky A. (2001) Rpn4 is a ligand, substrate, and transcriptional regulator of the 26S proteasome: A negative feedback circuit. Proc. Natl. Acad. Sci. U.S.A. 98, 3056–3061 [DOI] [PMC free article] [PubMed] [Google Scholar]
- 52. Seeger M., Hartmann-Petersen R., Wilkinson C. R., Wallace M., Samejima I., Taylor M. S., Gordon C. (2003) Interaction of the anaphase-promoting complex/cyclosome and proteasome protein complexes with multiubiquitin chain-binding proteins. J. Biol. Chem. 278, 16791–16796 [DOI] [PubMed] [Google Scholar]
- 53. Fukunaga K., Kudo T., Toh-e A., Tanaka K., Saeki Y. (2010) Dissection of the assembly pathway of the proteasome lid in Saccharomyces cerevisiae. Biochem. Biophys. Res. Commun. 396, 1048–1053 [DOI] [PubMed] [Google Scholar]
- 54. Funakoshi M., Li X., Velichutina I., Hochstrasser M., Kobayashi H. (2004) Sem1, the yeast ortholog of a human Brca2-binding protein, is a component of the proteasome regulatory particle that enhances proteasome stability. J. Cell Sci. 117, 6447–6454 [DOI] [PubMed] [Google Scholar]
Associated Data
This section collects any data citations, data availability statements, or supplementary materials included in this article.