Abstract
Protein phosphorylations, as well as phosphate metabolite binding, are well characterized posttranslational mechanisms that regulate enzyme activity in the cytosol, but remain poorly defined in mitochondria. Recently extensive matrix protein phosphorylation sites have been discovered but their functional significance is unclear. Herein we describe methods of using 32P labeling of intact mitochondria to determine the dynamic pools of protein phosphorylation as well as phosphate metabolite association. This screening approach may be useful in not only characterizing the dynamics of these pools, but also provide insight into which phosphorylation sites have a functional significance. Using the mitochondrial ATP synthetic capacity under appropriate conditions, inorganic 32P was added to energized mitochondria to generate high specific activity γ-P32-ATP in the matrix. In general, SDS denaturing and gel electrophoresis was used to primarily follow protein phosphorylation, whereas native gel techniques were used to observe weaker metabolite associations since the structure of mitochondrial complexes were minimally affected. The protein phosphorylation and metabolite association within the matrix was found to be extensive using these approaches. 32P labeling in 2D gels was detected in over 40 proteins, including most of the complexes of the cytochrome chain and proteins associated with intermediary metabolism, biosynthetic pathways, membrane transport, and reactive oxygen species metabolism. 32P pulse-chase experiments further revealed the overall dynamics of these processes that included phosphorylation site turnover as well as phosphate-protein pool size alterations. The high sensitivity of 32P resulted in many proteins being intensely labeled, but not identified due to the sensitivity limitations of mass spectrometry. These low concentration proteins may represent signaling proteins within the matrix. These results demonstrate that the mitochondrial matrix phosphoproteome is both extensive and dynamic. The use of this, in situ, labeling approach is extremely valuable in confirming protein phosphorylation sites as well as examining the dynamics of these processes under near physiological conditions.
1. INTRODUCTION
Protein phosphorylation and phosphate containing metabolite association play a critical role in the regulation of mitochondrial function (Bender and Kadenbach, 2000;Denton et al., 1975;Gabriel et al., 1986;Lee et al., 2005;Ludwig et al., 2001;Randle, 1981;Steenaart and Shore, 1997;Walker, 1994). However, the actual enzymatic and non-enzymatic mechanisms and kinetics for most of these interactions are poorly understood. For example, mass spectrometry and dye screening methods have revealed numerous protein phosphorylation sites (Ballif et al., 2004;Hopper et al., 2006;Schulenberg et al., 2003;Schulenberg et al., 2004;Struglics et al., 2000;Villen et al., 2007) (http://www.phosphosite.org) in the matrix, while the kinase/phosphatase system within the matrix is poorly defined. It is also unclear how many of these phosphorylation sites are functionally active in the protein and whether they are simply decorations resulting from ‘non-specific’ kinase interactions or events that occurred early in protein folding processes to statically control structure and are no longer dynamically controlled. With regard to non-specific phosphorylation by kinases, the kinase selectivity is based on both the phosphorylation site sequence (Yaffe et al., 2001) as well as docking region for the kinase on the target protein (Biondi and Nebreda, 2003), but does not result in complete exclusion. Thus, it is likely that some of the mass spectrometry or dye detected protein phosphorylations, especially determined after enhancement of phosphopeptides (Ballif et al., 2004;Villen et al., 2007;Villen and Gygi, 2008), may have no functional significance and may also only represent a small fraction of the total protein pool, resulting in little functional impact.
Phosphate metabolite associations may come in two general classes, covalent interactions, that include ADP ribosylation (Scovassi, 2004), and numerous allosteric and substrate binding sites that are present for GTP and ATP as well as the di- and mono-phosphate metabolites of these molecules along with Pi, NADH/NAD (Berger et al., 2005;Grunicke et al., 1975), NADPH/NADP and FAD/FADH.
One of the gold standards in determining protein phosphorylation is the direct labeling of proteins with 32P from γ-32P-ATP in vitro (Hopper et al., 2006) or intact systems (Edes and Kranias, 1990;Kiss et al., 1997). The advantages of 32P labeling include its high sensitivity, specificity, and the requirement for site turnover. We have developed a 32P labeling strategy for monitoring protein phosphorylation in intact isolated mitochondria. The purpose of this approach was to screen for protein phosphorylation as well as phosphate metabolite associations in matrix proteins.
2. Methods
Mitochondria are essentially impermeable to extramitochondrial ATP with exception of the modest net ATP import via the Mg-ATP transporter (Aprille, 1993). This is due to the fact that the membrane potential drives ATP out of the matrix while ADP is driven into the matrix through the electrogenic adenylate translocase (LaNoue et al., 1978). Thus, γ-32P-ATP cannot be added externally, but must be generated in the matrix to monitor protein phosphorylation. Our strategy to generate matrix γ-32P-ATP is outlined in Figure 1, where mitochondria are directly incubated in 32P inorganic phosphate. In energized mitochondria the labeled Pi is converted to γ32P-ATP, via oxidative phosphorylation as well as succinatc-CoA synthetase (SCS). Exchanging of the 32P label could occur primarily via adenylate kinase (AK) between β and γ ATP phosphates. Though adenosine kinase (ADK) has not been directly associated with the mitochondria matrix, this reaction could also result in the conversion of label at γ to α. Previous studies have demonstrated that 32P incorporation occurs most rapidly in γ-ATP followed by βADP via AK(Tokumitsu and Ui, 1973).
Figure 1.
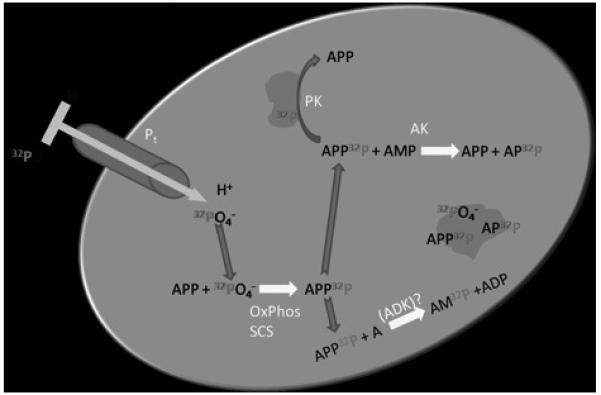
Schematic diagram of mitochondrial matrix generating γ-32P-ATP from extramitochondrial 32P as well as other phosphate labeled metabolites. Pt: phosphate transport protein. ADK: adenosine kinase, it is not clear that this enzyme is present and active in the matrix. AK: adenylate kinase. PK: protein kinase. OxPhos: Oxidative phosphorylation. SCS: Succinate CoA Synthetase. Grey masses represent proteins that have metabolites bound or are phosphorylated.
2.1 Mitochondria Isolation and Phosphate Loading
We conducted these 32P labeling experiments on intact porcine heart mitochondria. Due to unique aspects of preventing Pi depletion in the isolation process we will briefly review our mitochondria isolation methodology. Pig heart mitochondria were isolated from tissue that was cold-perfused in situ to remove blood and extracellular Ca2+ as well as prevent any warm ischemia. Pigs were anesthetized and euthanized using potassium chloride. The heart was removed immediately. The coronaries were flushed retrograde through the aorta with 0.5L cold buffer A (0.28 M sucrose, 10 mM HEPES, 1 mM EDTA, 1 mM EGTA pH 7.1). The atria, right ventricle, fat and connective tissue were meticulously removed. The left ventricle was weighed, chopped and added to 500 ml cold buffer A. After mincing in a food processor (Oskar, Sunbeam), attached to a rheostat set to 30%, for 10 min the mixture was centrifuged at 600g for 10 min at 4°C. The pellet was resuspended in buffer A with 0.5mg trypsin per gram of tissue and incubated for 15 min at 4°C. Trypsin inhibitor (2.6mg per gram of tissue) and BSA (1mg/ml buffer A) were added and the suspension was homogenized 2 times with a loose fitting tissue grinder and 5 times with a tight fitting tissue grinder. The puree was centrifuged at 600g for 10 min at 4°C. The supernatant was immediately centrifuged at 8000g for 10 min at 4°C to yield a pellet of mitochondria. One notable modification was that 1 mM K2PO4 was added to buffer A (0.28M sucrose, 10 mM HEPES, 1 mM EDTA, 1mM EGTA pH 7.1) for the first re-suspension of the mitochondrial pellets to assure that matrix phosphate depletion was not occurring in the isolation process. Mitochondria were then washed two times with buffer A alone, and finally in buffer B (137 mM KCl, 10 mM HEPES, 2.5 mM MgCl2, 0.5 mM K2EDTA) for storage on ice. All experiments were conducted on the same day as isolation.
We had some original concerns that the trypsin treatment used to remove the mitochondria from the heart muscle fibers may be contributing to proteolysis within the sample. However, preparing heart mitochondria in the absence of trypsin did not reveal any change in lower molecular weight proteolytic products, though some differences in proteins were detected likely due to different populations of mitochondria enhanced in the non-trypsin sample (Palmer et al., 1977).
Mitochondria preparations were tested for viability by measuring the respiratory control ratio (RCR) by taking the ratio of the rate of oxygen consumption in the presence and absence of ADP (1 mM) at 37°C. To accept a mitochondrial preparation, the RCR had to exceed 8 at 37°C to assure a well coupled system for generating ATP.
In addition, we also confirmed the generation of matrix ATP with re-energization of the mitochondria using standard ATP assay procedures. ATP assays were conducted after different incubation conditions by taking 1ml of the suspension and placing it into 2ml of 6% perchloric acid (PCA) on ice. After 10 minutes on ice, 4M potassium carbonate (~300 μL) was used to titrate to neutral pH. An alkaline overshoot during titration was avoided by adding a universal pH indicator (20 μL) directly into the extract and monitoring the pH during the neutralization process. After neutralization the sample was centrifuged and the supernatant collected for ATP analysis. The supernatant was stored at −80°C and analyzed within 48 hours. Total ATP content was determined using a luminescence assay with luciferin-luciferase (Invitrogen, Carlsbad, CA), against a standard curve of ATP.
Note that we pre-incubated the mitochondria in phosphate media during the ice-cold isolation procedure. We have found, as have others (Siess et al., 1984), that standard isolation procedures lead to the depletion of matrix Pi. This hampered the ability to energize the mitochondria (Bose et al., 2003) as well as the overall generation of ATP when picomolar amounts of Pi were added to the suspension, simulating a 32P labeling experiment. We have found that this pre-incubation increased matrix Pi of the mitochondria and stabilized the ATP matrix content as well as the 32P labeling patterns that were highly variable in the absence of the Pi pre-incubation. We believe that low matrix Pi hampered ATP synthesis as well as other Pi dependent metabolic reactions (Bose et al., 2003), which resulted in variable 32P labeling. Indeed, others have made similar observations on the maximum velocity of oxidative phosphorylation and other processes with Pi pre-incubations (Siess et al., 1984). We highly recommend that this pre-incubation with cold phosphate be used in all mitochondria preps designed to monitor 32P associations as well as other metabolic studies.
2.2 32P Labeling of Intact Mitochondria
The standard condition for 32P incubation (outlined in Table 1) was to incubate 5 nmol of cytochrome oxidase in 5 ml of oxygenated buffer C (125 mM KCl, 15 mM NaCl, 20 mM HEPES, 1 mM EGTA, 1 mM EDTA, 5 mM MgCl2, 5 mM potassium-glutamate, 5 mM potassium-malate at pH 7.1) at 37°C. 1.25mCi of 32P inorganic phosphate was added to the incubation media. Studies were performed in a 50 ml chamber with 100% O2 passed over the top while rocking in a water bath at 37°C. Glutamate and malate were added to energize the mitochondria to generate a membrane potential and support oxidative phosphorylation. We have also been successful using other substrates, such as pyruvate, αketoglutarate or fatty acids. Free calcium was assumed to be nominally zero under these conditions; calcium was added in some experimental conditions by calculating the free calcium using the known buffering properties of the ions in this media. 32P labeled free inorganic phosphate was used as the label. In general, 32P labeled phosphate was the only exogenous phosphate added to the preparation to optimize the specific activity of 32P in the matrix. This was added directly to the incubation medium under different experimental conditions or incubation times. Samples could be extracted at any time to follow time courses of 32P incorporation.
Table 1.
Standard Incubation Procedure for 32P labeled Intact Mitochondria
| Reagents | Stock | Storage |
|---|---|---|
| Buffer C | 125 mM KCl, 15 mM NaCl, 20 mM HEPES, 1 mM EGTA, 1 mM EDTA, 5mM MgCl2, pH 7.1 at 37°C |
4°C |
| Glutamate/Malate | 0.5M potassium-glutamate/0.5M potassium-malate, pH 7 | −20°C |
| 32-inorganic Phosphorus | Perkin Elmer (NEX053H005MC) 5mCi vial | −20°C |
| TCA | 10% TCA (w/v) in deionized water | 4°C |
| Acetone | 100% Acetone | −20°C |
| Lysis Buffer | 7M Urea, 2M Thiourea, 4% CHAPS | −20°C |
| Bradford Dye | USB #(30098) | Room Temp. |
Procedure for 5mg Mito Prep
Freshly isolated mitochondria should be left on ice in isolation buffer until ready to be used.
Place 20mL of Buffer C in a warm water bath 37°C and oxygenate with 100% O2.
Thaw previously frozen stock Glutamate/Malate solution.
Thaw 32P 5 min. before incubation procedure starts.
In a 50mL tube add 50μL of Glutamate/Malate solution, 250 μCi 32P per nmol cyto a, adjust final volume to 5mL with Buffer C.
Mix gently before adding 5mg of Mitochondria directly into the 50mL tube.
The 50mL tube should be in a water bath rocker set to 37 °C, rocking for 20min.
Stop the reaction by adding 5mL of 10% TCA, place tube on ice for overnight precipitation in 4°C.
Next day, centrifuge 50mL tube at 10,000 x g for 30 min, 4°C.
Decant TCA solution be careful not lose pellet.
Add 5mL of ice cold acetone to the pellet and vortex to disrupt pellet.
Centrifuge 50mL tube at 10,000 x g for 15 min, 4°C
Decant acetone solution.
Repeat steps 11-13 but extend the centrifugation for 30min to get a tighter pellet.
Air dry pellet for 5 min.
Resuspend pellet with 200μL Lysis buffer and transfer to 1.5mL vial.
The pellet needs to be fully resuspended in lysis buffer, and sit on ice for 5 min.
Clarify the sample by centrifuging 10,000 x g for 5 min. at 4°C.
Transfer supernatent to a new tube.
Perform Bradford protein assay, follow manufacturer’s protocol, USB.
2.3 Sample Preparation for Two Dimensional Gel Electrophoresis
In preparation for 2D gel electrophoresis, mitochondrial incubations were stopped by adding an equal sample volume of 10% trichloroacetic acid (TCA) solution and placing the samples on ice overnight at 4°C to achieve maximum protein precipitation. The precipitated proteins were centrifuged at 10,000 x g for 30 min at 4°C, and the supernatant was aspirated. The pellet was washed twice with cold (−20°C) 100% acetone, broken apart using a pipette tip and vortexing, and then centrifuged for 15 min, 10,000 x g 4°C in-between wash steps. After the second wash step with acetone the sample was centrifuged for a longer period 30 min at 4°C to keep the pellet intact. The supernatant was removed with a vacuum tipped probe and the pellet was air dried for 5 min or speed vac for 1 min. If the pellet is dried for longer periods of time it will be very difficult to get it back into suspension, but can be achieved by sonication with a cup-horn sonicator. The pellet was re-suspended in 200 μL of lysis buffer containing 7 M urea, 2 M thiourea, and 4% CHAPS (w/v). Protein concentration was determined by the Bradford protein assay method (USB Quant kit, USB Corp., Cleveland, OH). We have tested the use of phosphatase inhibitors in this protocol and found no increase in detected 32P labeling under these extraction conditions. Most likely the high dilution of the matrix volume (over 1000 fold) and the TCA treatment of our extraction procedure reduced the activity of intrinsic phosphatases without requiring inhibitors.
Three hundred μg of cleaned 32P labeled mitochondrial lysate (10μg/μL concentration) were then mixed with rehydration solution [7 M urea, 2 M thiourea, 4% CHAPS (w/v), 13 mM DTT, 1% (pH 3-10 NL) Pharmalyte (v/v), trace bromophenol blue], to a final volume of 443 μl. The mixture was vortexed, centrifuged at 10,000 x g, 4°C for 1 min and placed on ice for 5 min. Seven μl of Destreak reagent (GE Healthcare) was added to the sample rehydration buffer, vortexed, centrifuged at 10,000 x g, 4°C for 1 min and placed on ice before loading onto a 24 cm Immobiline DryStrip gels (pH 3-10 NL) (GE Healthcare). Isoelectric focusing was achieved by active rehydration for 12 h at 30 V followed by stepwise application of 250V (1 h), 500V (1 h), 1000V (1 h), gradient to 8000V (1 h) and final step at 8000V (8 h) for a total of ~72,000 Vh (Ettan IPGPhor2, GE Healthcare).
Immobiline DryStrip gels were equilibrated in 10 ml of SDS equilibration solution [50 mM Tris-HCl (pH 8.8), 6 M urea, 30% glycerol, and 2% SDS] for 10 min, first containing 100 milligrams of DTT. The strip was then transferred to another tube containing 10ml of SDS equilibration solution with 250 milligrams of iodoacetemide for 10 min. Gel strips were applied to 10-15% Tris-HCl pH 8.8, gradient gels (Nextgen Sciences, Ann Arbor, MI) and sealed with 0.5% agarose containing bromophenol blue. Electrophoresis was performed in an Ettan DALT12 tank (GE Healthcare) in 20°C electrophoresis buffer consisting of 25 mM Tris (pH 8.3), 192 mM glycine, and 0.2% SDS until the dye front advanced completely (~2000 Vh).
In preparation for drying radio-labeled gels, each gel was placed in 400 ml of saturated Coomassie blue stain which consisted of 50% methanol, 3% phosphoric acid and 0.5% colloidal Coomassie G250 (Bio-Rad Laboratories, Hercules, CA), agitating for 2 h. The gels were visually inspected to verify total protein staining. To reduce the background staining they were first destained with 400ml of 50% methanol and 3% phosphoric acid, agitating for 15 min, and then transferred to another destain solution containing 30% methanol and 3% phosphoric acid, agitating for 2 h. The gels were rehydrated for 2 min with deionized water (longer periods of rehydration will cause the gel to swell abnormally) and placed on filter paper backing (cut a little larger then the size of the gel) (#165-0962, Bio-Rad) that had been sprayed with deionized water (spray enough water to give a generous coating of water but not saturated). The gels were then sprayed with deionized water and covered with plastic wrap (Glad™ warp) before placing in a large format dryer (model 583, Bio-Rad) for 2 h set to gradient to slowly reach 70°C under a vacuum. We do not advise using glycerol in the gel rehydration solution due to the sticky nature of the gel after drying. Dried gels were taped in a screen development cassette (GE Healthcare) to prevent the gel from curling or moving in the cassette. A marker solution was made by mixing 1 μl of radioisotope to 49 μl of Coomassie blue stain (50% methanol and 0.1% (w/v) colloidal Coomassie blue G250). One μl of the marker solution was spotted on each corner of the dried Coomassie blue stained gel and let dry at room temperature for 10 min or until spot is completely dried. The fiducial markers were used to serve as points of reference for Coomassie blue and 32P image overlays. A phosphor-screen (GE Healthcare) was placed on top of the dried gels for an exposure time of 72 hours.
2.4 Image Acquisition and Analysis
The phosphor-screens were scanned on a Typhoon 9410 variable mode imager (GE Healthcare) at a resolution of 100 microns. The scanner was set in phosphor mode with the selection of maximum sensitivity. The dried Coomassie blue 2D-gel was placed in the AlphaImager HP imaging station (Alpha Innotech, San Leandro, CA) set to visible white light mode and the image was captured. To achieve proper alignment the image dimensions of both Coomassie blue and 32P images need to be close in size. The phosphor screens allowed us to achieve a dynamic range of 5 orders of magnitude opposed to film. If using film, take an image of the film with the same system used for taking the image of the Coomassie blue stained gel, to achieve proper alignment.
The 2D images from Coomassie blue stain and 32P autoradiograms were aligned using Progenesis SameSpot or PG240 software (Nonlinear Dynamics, Newcastle upon Tyne, U.K.). All four fiducial points seen on the Coomassie blue image were aligned to the fiducial points on the phosphor-screen image only. This is important to prevent any bias aligning to the images. Alternatively, image alignment can be performed using Adobe Photoshop software, but it is not as accurate or flexible as Progenesis SameSpot or PG240 software.
2.5 Mass Spectrometry
Protein identification was performed on a non-radiolabeled preparative pick gel. Using Progenesis Same Spot software we were first able to align the 32P labeled image to total protein Coomassie blue image according to the fiducial markers. In the same Progenesis image analysis experiment the preparative pick gel (stained with Coomassie blue) was added to the analysis. The preparative pick gel was then aligned to the Coomassie blue total protein image. The group of spots that was selected on the 32P alignment was also selected on the preparative pick gel. The selected spots were picked using an automated spot picking system that also digested each protein with trypsin and spotted onto a MALDI TOF/TOF mass spectrometer plate for further analysis.
3. RESULTS
3.1 32P Dose and Time Course
Dose and time course studies for 32P labeling were conducted on porcine heart mitochondria. The 32P dosing studies at 1, 25, 50, and 250 μCi 32P per nmol cytochrome oxidase protein revealed that the 250 μCi 32P dose provided the best overall labeling pattern for a majority of proteins (Figure 2). Based on these studies we used the 250 μCi 32P dose for the majority of experiments. We did not use higher levels of 32P since we seemed to be approaching the limit of the dynamic range and resolution of the 2D-gel autoradiogram system at that concentration.
Figure 2.
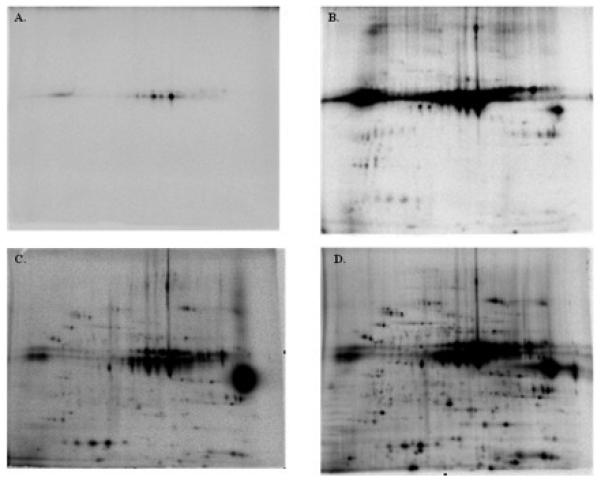
32P Dose Response in Heart Mitochondria. Porcine heart mitochondria were incubated in standard conditions for 20 min where A) 1μCi B) 25μCi, C) 50μCi and D) 250μCi of 32P was added. Proteins were separated in the horizontal direction by isoelectric focusing point (pI), from pH ~4 to 10, and vertically by molecular weight, from ~150 to 10 kDa. The relative amplitude for each image was arbitrarily set.
In the time course studies, samples were collected at different times from the same agitating sample chamber, after initiating the 32P labeling. These studies revealed that most associations reached a maximum at 20 minutes at 37°C. Based on this data we used 20 minutes as our standard incubation time.
3.2 32P Assignments
Figure 3 presents a partially identified 32P labeling pattern in a 2D-gel. Assignments are in the figure legend. Assignments were made using the procedures outlined in the Mass Spectrometry methods section above. Note that many labeled proteins are not assigned; these are primarily the result of low protein content or poor dispersion of the protein preventing a unique identification.
Figure 3.
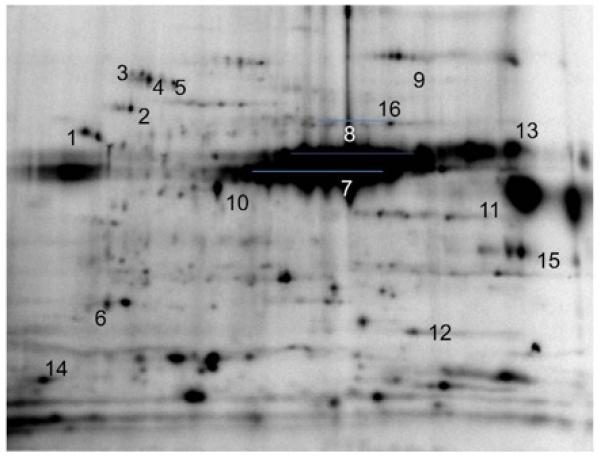
32P labeling assignments in isolated heart mitochondria. Mitochondria were incubated for 20 minutes with 250 uCi of 32P. Chromatography is the same at in Figure 2. Protein assignments: 1 ATP synthase, mitochondrial F1 complex, β subunit. 2) 60 kDa heat shock protein, mitochondrial precursor. 3) NADH dehydrogenase (ubiquinone) Fe-S protein 1 (75kDa). 4) 70kDa heat shock protein, mitochondrial precursor. 5) Pyruvate dehydrogenase complex, E2 subunit. 6) ATP synthase d-chain, mitochondrial precursor. 7) Pyruvate dehydrogenase complex, E1 subunit. 8) Elongation factor Tu, mitochondrial precursor. 9) Aconitase hydratase, mitochondrial precursor. 10) Isocitrate dehydrogenase (NAD) subunit alpha, mitochondrial precursor 11) Succinyl-CoA ligase (GDPforming) alpha-chain, mitochondrial precursor. 12) Mn superoxide dismutase. 13) Creatine kinase, sarcomeric mitochondrial precursor. 14) Cytochrome c oxidase polypeptide Va, mitochondrial precursor. 15) Voltage-dependent anion channel 1. 16) ATP synthase, mitochondrial F1 complex, α subunit.
3.3 Chase experiments with cold phosphate
The extent of 32P incorporation is a function of both the turnover of existing phosphoproteins and the generation of new phosphorylated proteins in the presence of 32P. The initial pool of phosphorylated protein (PEi), of the total protein E, will increase 32P labeling by enzymatic turnover that could be modeled PEt=PEi(1-e−kt) where t is time while k is the exchange rate for turnover. This assumes that all of the free matrix phosphate is 32P labeled. While the generation of new pools of phosphorylated protein with 32P can be modeled in the extreme case where all protein will be phosphorylated as Pen = (E-PEi)(1-e−gt) where g is the rate constant of generating, or regenerating, the phospho-protein pool. Using these models the total 32P protein signal will equal PEi(1-ekt) (i.e. the turnover component) + (E-PEi)(1-e−gt) (i.e. the newly synthesized pool). Depending on the pool sizes and the relative rate constants, either of these processes could dominate the 32P labeling process in the matrix.
As discussed above, 32P labeling alone cannot distinguish turnover of sites from the creation of newly labeled protein. For example, it has been previously established that pyruvate dehydrogenase (PDH) dephosphorylates under standard isolation conditions and rapidly rephosphorylates upon warming and reenergization (Kerbey et al., 1976). To estimate the relative role of phosphoprotein pool building versus pure exchange in our incubation conditions, we performed a series of pulse chase experiments with cold phosphate. An example of these studies is presented in Figure 4. It is clear that the majority of 32P is not competed off of its sites if cold phosphate is added after 32P, while the initial addition of cold phosphate eliminates most of the 32P labeling. This was clearly the case for PDH labeling, as predicted by the previous work. These results imply that many of the proteins were phospho-depleted during the deenergization associated with mitochondria isolation, likely reflecting a decrease in matrix ATP, followed by an increase in phosphorylation associated with the warming and re-energization of the mitochondria. This may be fortuitous since the building of the phosphor-protein pools upon re-enegerzation will enhance the overall 32P incorporation into the proteins. However, the rates of incorporation cannot be interpreted as turnover, due to the non-steady state condition of the phosphor-protein levels and phosphoprotein pool building seems to dominate the labeling patterns detected in our standard protocol. To avoid these non-steady state complications, a 20 min incubation with low cold Pi to achieve steady state before adding 32P may enhance the turnover contribution to the 32P labeling. We have not explored this possibility extensively, since we have been focusing on phosphorylation site identification relying on both terms to generate the largest 32P labeled pool.
Figure 4.
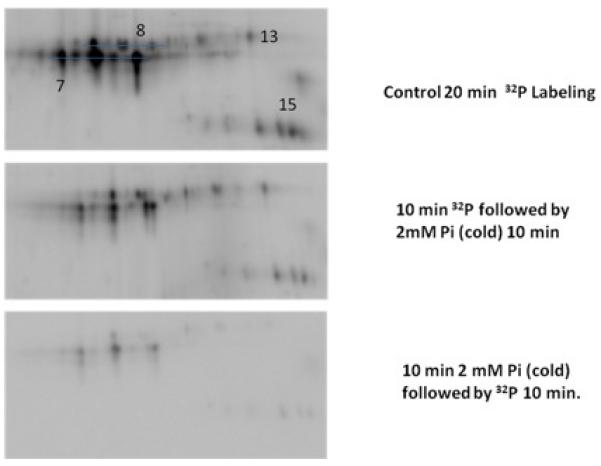
32P Pulse-Chase Experiments. Control, 32P was added to porcine heart mitochondria and incubated for 20 min 32P was added to heart mitochondria and incubated for 10 min then cold inorganic phosphate was added to the incubation media for an additional 10 min. Heart mitochondria incubated with cold inorganic phosphate for 10 min then 32P was added to the incubation media for an additional 10 min. Proteins were separated in the horizontal direction by isoelectric focusing point (pI), from pH ~4 to 10, and vertically by molecular weight, from ~150 to 10 kDa. All exposures were identical along with window level values in the display.
3.4 Suppression of PDH
There are a few mitochondrial proteins that have strong 32P incorporation such as PDH, which limits the dynamic range of the autoradiogram. We believe that this large incorporation is more due to the re-generation of PDH during the re-energization process rather than simply a high turnover, as demonstrated by the pulse chase experiments. In mammalian tissue, PDH exists in two forms: active (dephosphorylated) or inactive (phosphorylated) and is regulated by its own kinase/phosphatase system. An approach to selectively suppress PDH rephosphorylation would be to inhibit the kinase by using the halogenated organic acid dichloroacetic acid (DCA) (Whitehouse et al., 1974) and/or pyruvate (Denton et al., 1975). To test this concept, heart mitochondria were incubated for 1h on ice with 0.1 mM DCA and 5 mM pyruvate before the standard 20 min 32P incubation at 37°C in the presence of glutamate and malate, substrates not dependent on PDH for oxidation. These inhibitors decreased the labeling of PDH as shown in Figure 5, as predicted from the inhibition of PDHK. Similar results were obtained with DCA or pyruvate alone. However, we noted that 32P labeling was surprising suppressed in many other proteins. We speculated that this global effect of DCA and pyruvate may be due to a suppression of ATP production even though these mitochondria were provided glutamate and malate as alternative substrates. We assayed mitochondria matrix ATP content in the presence of DCA and pyruvate. A dose dependent decrease in matrix ATP content with both DCA and pyruvate was observed. The mechanism for this global inhibition of ATP generation by DCA and pyruvate is unknown, but this inhibition could explain the global decrease in 32P labeling with these agents
Figure 5.
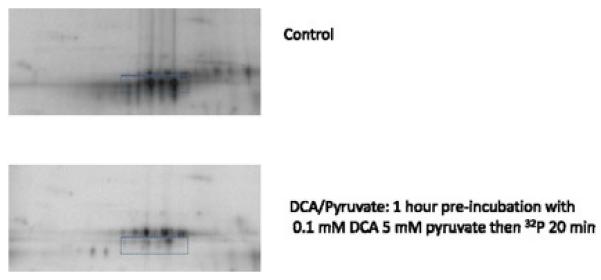
The Effects of Dichloroacetate (DCA) and Pyruvate on 32P Labeled Heart Mitochondria. Control: Heart mitochondria incubated in standard conditions for 20 min with 32P. DCA/Pyruvate: Heart mitochondria treated with 0.1 mM DCA and 5 mM pyruvate for 1 h on ice then 32P was added during the standard 20 min incubation at 37°C. Box indicates region of the phosphorylated pyruvate dehydrogenase E1 protein.
3.5 Purified 32P labeled proteins and complexes
To further validate the assignment of 32P labeling sites, we have found that purifying proteins after in situ 32P labeling is a useful approach. After incubating intact mitochondria, as described in the 32P labeling section, Complex V was isolated with an immunocapture kit (Mitosciences, Eugene, OR) according to the manufacturer’s instructions. Briefly, after incubation, mitochondria were pelleted and solubilized to a final concentration of 5mg/ml in 1x PBS with 1% lauryl maltoside detergent. Mitochondria were then mixed with a pipette and placed on ice for 30 min, before centrifuging at 10,000 rpm for 30 min at 4°C. One ml aliquots of solubilized mitochondrial supernatant were transferred to fresh 1.5 ml vials containing the following mixture: 5 mM potassium-fluoride, 10 μl of protease inhibitor cocktail (Sigma-Aldrich, St. Louis, MO), and 50 μl of antibody loaded G-agarose beads. This mixture was allowed to mix overnight at 4°C using a vial rotator. Beads were then washed 3-times in 1x PBS with 0.05% lauryl maltoside, and Complex V was eluted by re-suspending in 2 volumes of 4M urea, pH 7.5.
Isolating Complex V provided confirmation for the 32P labeled subunits seen in the total mitochondria labeled gels as well as revealed sites that were masked by other phosphorylated proteins. Complex V isolation demonstrated 32P labeling of the β, α, γ, and d-chain subunits, with some residual contamination from the intensely labeled PDH (Figure 6). It should be noted that the location of the β subunit labeling was slightly above the Commassie stained gel. This implied that other post-translational modifications may be involved.
Figure. 6.
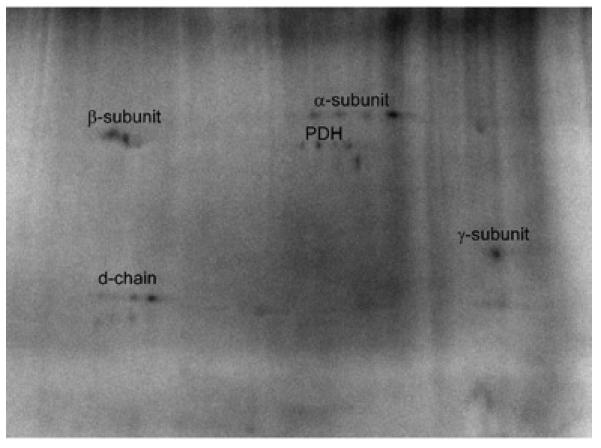
Purified Labeled Complex V from Porcine Heart Mitochondria. Subunit identifications were obtained by mass spectrometry. Purified proteins were separated by two-dimensional gel electrophoresis, first in the horizontal direction by isoelectric focusing point (pI), from pH ~4 to 10, and then vertically by molecular weight, from ~150 to 10 kDa.
We have also been successful in studies of isolated individual complexes using Blue native approaches (Schagger and von, 1991) (see below). Blue native revealed better maintained subunit stoichiometry than immuncapture methods, likely due to partial dissociation of the complexes prior to or during the immunecapture procedure, while only complete complexes properly migrate in the Blue Native gels.
3.6 Blue Native Gel Electrophoresis (BN-PAGE)
Native electrophoresis was used to maintain mitochondrial protein complexes in their intact form (Schagger and von Jagow, 1991) and permit the detection of weak 32P metabolite association with mitochondrial proteins as well as covalent protein phosphorylation events within complete protein complexes. BN-PAGE was performed according to an Invitrogen protocol for NativePAGE Novex Bis-Tris Gel System, except for the destaining step where cold water was used to destain and detect metabolite association. Four-16% 1 mm bis-tris gels were used for BN-PAGE and electrophoresis was performed at 4°C for 1 h at 150V then for 1.2 h at 250 V. The BN-PAGE gels were dried the same way as the 2D-gels except the total drying time was 45 min on a gradient cycle. Using only cold water to destain the BN-PAGE gels, a large number of 32P associations were detected that did not quantitatively correlate with the 2D-gels. These weak metabolite associations were removed when more standard organic solvents and acids were used to fix/destain the BN-PAGE gels. When fixed for 15 min in hot fixative solution (40% methanol, 10% acetic acid) and destained in hot 8% acetic acid solution many of the non-covalent metabolite associations to proteins were lost, especially in complexes I and V (Figure 7). These results demonstrate a new property of the Blue Native approach in monitoring the association of metabolites to individual enzyme complexes as well as protein phosphorylation. This approach, in combination with in-gel assay approaches, should provide a useful tool in analyzing the effect of metabolite association and protein phosphorylation on enzyme complex activity. The specific metabolites weakly associated with the proteins in the BN-PAGE gels have not been fully characterized. However, preliminary studies suggest that ATP is the dominate metabolite in these weak interactions.
Figure 7.
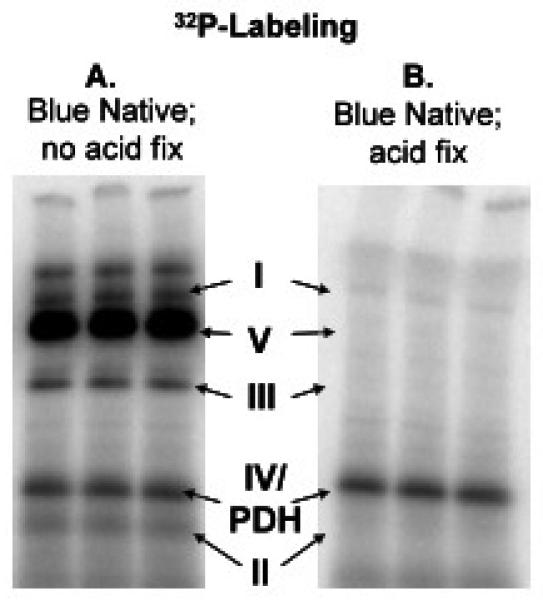
Native PAGE of 32P labeled porcine heart mitochondrial complexes. A) cold water destain, no acid for 2 min B) BN-PAGE gel was fixed in an hot fixative followed by hot acid destain for additional 15 min.
4. SUMMARY
The methodology for performing in situ 32P labeling of matrix proteins in mitochondria was described. This approach reveals a large number of dynamic protein phosphorylations and metabolite associations that are only just beginning to be understood and characterized. The approach was validated by confirming many of the classical observations on PDH, while providing new insights on numerous other protein systems. This approach may provide an excellent screening tool to select the numerous protein phosphorylation sites detected by mass spectrometry that may be linked to dynamic modulation of enzyme or protein function in the matrix. Many of the phosphorylations detected were expressed at levels, below mass spectrometry identification limits, suggesting many more new discoveries of protein phosphorylation sites are still to be made on proteins that may play a significant role in matrix signaling networks.
Contributor Information
Angel M. Aponte, Laboratory of Cardiac Energetics, National Heart Lung and Blood Institute.
Darci Phillips, Laboratory of Cardiac Energetics, National Heart Lung and Blood Institute.
Robert A. Harris, University of Indiana School of Medicine, Department of Biochemistry and Molecular Biology
Ksenia Blinova, Laboratory of Cardiac Energetics, National Heart Lung and Blood Institute.
Stephanie French, Laboratory of Cardiac Energetics, National Heart Lung and Blood Institute.
D. Thor Johnson, University of Indiana School of Medicine, Department of Biochemistry and Molecular Biology.
Robert S. Balaban, Laboratory of Cardiac Energetics, National Heart Lung and Blood Institute.
References
- Aprille JR. Mechanism and regulation of the mitochondrial ATP-Mg/P(i) carrier. J. Bioenerg. Biomembr. 1993;25:473–481. doi: 10.1007/BF01108404. [DOI] [PubMed] [Google Scholar]
- Ballif BA, Villen J, Beausoleil SA, Schwartz D, Gygi SP. Phosphoproteomic analysis of the developing mouse brain. Mol. Cell Proteomics. 2004;3:1093–1101. doi: 10.1074/mcp.M400085-MCP200. [DOI] [PubMed] [Google Scholar]
- Bender E, Kadenbach B. The allosteric ATP-inhibition of cytochrome c oxidase activity is reversibly switched on by cAMP-dependent phosphorylation. FEBS Lett. 2000;466:130–134. doi: 10.1016/s0014-5793(99)01773-1. [DOI] [PubMed] [Google Scholar]
- Berger F, Lau C, Dahlmann M, Ziegler M. Subcellular compartmentation and differential catalytic properties of the three human nicotinamide mononucleotide adenylyltransferase isoforms. J. Biol. Chem. 2005;280:36334–36341. doi: 10.1074/jbc.M508660200. [DOI] [PubMed] [Google Scholar]
- Biondi RM, Nebreda AR. Signalling specificity of Ser/Thr protein kinases through docking-site-mediated interactions. Biochem. J. 2003;372:1–13. doi: 10.1042/BJ20021641. [DOI] [PMC free article] [PubMed] [Google Scholar]
- Bose S, French S, Evans FJ, Joubert F, Balaban RS. Metabolic network control of oxidative phosphorylation: multiple roles of inorganic phosphate. J. Biol. Chem. 2003;278:39155–39165. doi: 10.1074/jbc.M306409200. [DOI] [PubMed] [Google Scholar]
- Denton RM, Randle PJ, Bridges BJ, Cooper RH, Kerbey AL, Pask HT, Severson DL, Stansbie D, Whitehouse S. Regulation of mammalian pyruvate dehydrogenase. Mol. Cell Biochem. 1975;9:27–53. doi: 10.1007/BF01731731. [DOI] [PubMed] [Google Scholar]
- Edes I, Kranias EG. Phospholamban and troponin I are substrates for protein kinase C in vitro but not in intact beating guinea pig hearts. Circ. Res. 1990;67:394–400. doi: 10.1161/01.res.67.2.394. [DOI] [PubMed] [Google Scholar]
- Gabriel JL, Zervos PR, Plaut GW. Activity of purified NAD-specific isocitrate dehydrogenase at modulator and substrate concentrations approximating conditions in mitochondria. Metabolism. 1986;35:661–667. doi: 10.1016/0026-0495(86)90175-7. [DOI] [PubMed] [Google Scholar]
- Grunicke H, Keller HJ, Puschendorf B, Benaguid A. Biosynthesis of Nicotinamide Adenine Dinucleotide in Mitochondria. Eur. J. Biochem. 1975;53:41–45. [Google Scholar]
- Hopper RK, Carroll S, Aponte AM, Johnson DT, French S, Shen RF, Witzmann FA, Harris RA, Balaban RS. Mitochondrial matrix phosphoproteome: effect of extra mitochondrial calcium. Biochemistry. 2006;45:2524–2536. doi: 10.1021/bi052475e. [DOI] [PMC free article] [PubMed] [Google Scholar]
- Kerbey AL, Randle PJ, Cooper RH, Whitehouse S, Pask HT, Denton RM. Regulation of pyruvate dehydrogenase in rat heart. Mechanism of regulation of proportions of dephosphorylated and phosphorylated enzyme by oxidation of fatty acids and ketone bodies and of effects of diabetes: role of coenzyme A, acetyl-coenzyme A and reduced and oxidized nicotinamide-adenine dinucleotide. Biochem. J. 1976;154:327–348. doi: 10.1042/bj1540327. [DOI] [PMC free article] [PubMed] [Google Scholar]
- Kiss E, Edes I, Sato Y, Luo W, Liggett SB, Kranias EG. beta-Adrenergic regulation of cAMP and protein phosphorylation in phospholamban-knockout mouse hearts. Am. J. Physiol. 1997;272:H785H790. doi: 10.1152/ajpheart.1997.272.2.H785. [DOI] [PubMed] [Google Scholar]
- LaNoue KF, Mizani SM, Klingenberg M. Electrical unbalance of adenosine nucelotide transport across the mitochondrial membrane. J. Biol. Chem. 1978;253:191–198. [PubMed] [Google Scholar]
- Lee I, Salomon AR, Ficarro S, Mathes I, Lottspeich F, Grossman LI, Huttemann M. cAMP-dependent tyrosine phosphorylation of subunit I inhibits cytochrome c oxidase activity. J. Biol. Chem. 2005;280:6094–6100. doi: 10.1074/jbc.M411335200. [DOI] [PubMed] [Google Scholar]
- Ludwig B, Bender E, Arnold S, Huttemann M, Lee I, Kadenbach B. Cytochrome C oxidase and the regulation of oxidative phosphorylation. Chembiochem. 2001;2:392–403. doi: 10.1002/1439-7633(20010601)2:6<392::AID-CBIC392>3.0.CO;2-N. [DOI] [PubMed] [Google Scholar]
- Palmer JW, Tandler B, Hoppel CL. Biochemical properties of subsarcolemmal and interfibrillar mitochondria isolated from rat cardiac muscle. J. Biol. Chem. 1977;252:8731–8739. [PubMed] [Google Scholar]
- Randle PJ. Phosphorylation-dephosphorylation cycles and the regulation of fuel selection in mammals. Curr. Top. Cell Regul. 1981;18:107–129. doi: 10.1016/b978-0-12-152818-8.50013-x. [DOI] [PubMed] [Google Scholar]
- Schagger H, von Jagow G. Blue native electrophoresis for isolation of membrane protein complexes in enzymatically active form. Anal. Biochem. 1991;199:223–231. doi: 10.1016/0003-2697(91)90094-a. [DOI] [PubMed] [Google Scholar]
- Schulenberg B, Aggeler R, Beechem JM, Capaldi RA, Patton WF. Analysis of steady-state protein phosphorylation in mitochondria using a novel fluorescent phosphosensor dye. J. Biol. Chem. 2003;278:27251–27255. doi: 10.1074/jbc.C300189200. [DOI] [PubMed] [Google Scholar]
- Schulenberg B, Goodman TN, Aggeler R, Capaldi RA, Patton WF. Characterization of dynamic and steady-state protein phosphorylation using a fluorescent phosphoprotein gel stain and mass spectrometry. Electrophoresis. 2004;25:2526–2532. doi: 10.1002/elps.200406007. [DOI] [PubMed] [Google Scholar]
- Scovassi AI. Mitochondrial poly(ADP-ribosylation): from old data to new perspectives. FASEB J. 2004;18:1487–1488. doi: 10.1096/fj.04-1841rev. [DOI] [PubMed] [Google Scholar]
- Siess EA, Kientsch-Engel RI, Fahimi FM, Wieland OH. Possible role of Pi supply in mitochondrial actions of glucagon. Eur. J. Biochem. 1984;141:543–548. doi: 10.1111/j.1432-1033.1984.tb08227.x. [DOI] [PubMed] [Google Scholar]
- Steenaart NA, Shore GC. Mitochondrial cytochrome c oxidase subunit IV is phosphorylated by an endogenous kinase. FEBS Lett. 1997;415:294–298. doi: 10.1016/s0014-5793(97)01145-9. [DOI] [PubMed] [Google Scholar]
- Struglics A, Fredlund KM, Konstantinov YM, Allen JF, Moller IM. Protein phosphorylation/dephosphorylation in the inner membrane of potato tuber mitochondria. FEBS Letters. 2000;475:213–217. doi: 10.1016/s0014-5793(00)01680-x. [DOI] [PubMed] [Google Scholar]
- Tokumitsu Y, Ui M. The incorporation of 32 P i into intramitochondrial ADP fraction dependent on the substrate-level phosphorylation. Biochim. Biophys. Acta. 1973;292:310–324. doi: 10.1016/0005-2728(73)90038-8. [DOI] [PubMed] [Google Scholar]
- Villen J, Beausoleil SA, Gerber SA, Gygi SP. Large-scale phosphorylation analysis of mouse liver. Proc. Natl. Acad. Sci. U. S. A. 2007;104:1488–1493. doi: 10.1073/pnas.0609836104. [DOI] [PMC free article] [PubMed] [Google Scholar]
- Villen J, Gygi SP. The SCX/IMAC enrichment approach for global phosphorylation analysis by mass spectrometry. Nat. Protoc. 2008;3:1630–1638. doi: 10.1038/nprot.2008.150. [DOI] [PMC free article] [PubMed] [Google Scholar]
- Walker JE. The regulation of catalysis in ATP synthase. Curr. Opin. Struct. Biol. 1994;4:912–918. doi: 10.1016/0959-440x(94)90274-7. [DOI] [PubMed] [Google Scholar]
- Whitehouse S, Cooper RH, Randle PJ. Mechanism of activation of pyruvate dehydrogenase by dichloroacetate and other halogenated carboxylic acids. Biochem. J. 1974;141:761–774. doi: 10.1042/bj1410761. [DOI] [PMC free article] [PubMed] [Google Scholar]
- Yaffe MB, Leparc GG, Lai J, Obata T, Volinia S, Cantley LC. A motif-based profile scanning approach for genome-wide prediction of signaling pathways. Nat. Biotechnol. 2001;19:348–353. doi: 10.1038/86737. [DOI] [PubMed] [Google Scholar]


