

Abstract
Mitochondrial oxidative stress and damage have been implicated in the etiology of temporal lobe epilepsy, but whether or not they have a functional impact on mitochondrial processes during epilepsy development (epileptogenesis) is unknown. One consequence of increased steady-state mitochondrial reactive oxygen species levels is protein post-translational modification (PTM). We hypothesize that complex I (CI), a protein complex of the mitochondrial electron transport chain, is a target for oxidant-induced PTMs, such as carbonylation, leading to impaired function during epileptogenesis. The goal of this study was to determine whether oxidative modifications occur and what impact they have on CI enzymatic activity in the rat hippocampus in response to kainate (KA)-induced epileptogenesis. Rats were injected with a single high dose of KA or vehicle and evidence for CI modifications was measured during the acute, latent, and chronic stages of epilepsy. Mitochondrial-specific carbonylation was increased acutely (48 h) and chronically (6 week), coincident with decreased CI activity. Mass spectrometry analysis of immunocaptured CI identified specific metal catalyzed carbonylation to Arg76 within the 75 kDa subunit concomitant with inhibition of CI activity during epileptogenesis. Computational-based molecular modeling studies revealed that Arg76 is in close proximity to the active site of CI and carbonylation of the residue is predicted to induce substantial structural alterations to the protein complex. These data provide evidence for the occurrence of a specific and irreversible oxidative modification of an important mitochondrial enzyme complex critical for cellular bioenergetics during the process of epileptogenesis.
Introduction
Mitochondrial oxidative stress and resultant dysfunction has been implicated as a contributing factor in diverse acute and age-related chronic neurodegenerative disorders, including amyotrophic lateral sclerosis, Parkinson's disease (PD), Huntington's disease, and Alzheimer's disease (Schapira, 1999; Beal, 2005). However, the role of mitochondrial oxidative stress in the etiology of epilepsies is unknown. Mitochondria execute crucial functions that can impact neuronal excitability. While a small percentage of inherited epilepsies are associated with mitochondrial dysfunction, less is known about its role in acquired epilepsies such as temporal lobe epilepsy (TLE), which is characterized by initial trauma triggering complex molecular, biochemical, physiological, and structural changes in the brain culminating in spontaneous and recurrent seizures via a process termed epileptogenesis. Several key features of TLE, such as its progressive nature and metabolic demands, suggest mitochondrial decline in its etiology. Recent work from our laboratory has demonstrated increased production of mitochondrial reactive oxygen species (ROS) during epileptogenesis in two distinct animal models (Jarrett et al., 2008; Waldbaum et al., 2010).
An important mechanism by which ROS can alter macromolecule function is via reversible or irreversible post-translational modification (PTM) of critical proteins that can result in loss of function (Andersen, 2004; Dalle-Donne et al., 2006; Danielson and Andersen, 2008). The goal of the current study was to (1) determine whether increased ROS production observed during epileptogenesis results in PTMs of critical mitochondrial proteins and (2) if so, identify the functional consequence of the modification(s) using an in vivo rat model of TLE. Explicitly, we determined whether mitochondrial-specific oxidant-induced PTMs could be observed and if specific protein targets could be identified during the process of epileptogenesis.
Our results indicate that the 75 kDa subunit of the mitochondrial electron transport chain (ETC) complex I (CI) is a target for oxidant-induced carbonylation during epileptogenesis. Arg76 of the 75 kDa subunit was converted to a reactive glutamic semialdehyde (GSA) product through metal catalyzed oxidation (MCO), which coincided with decreased CI activity at acute and chronic stages of epileptogenesis. Computational-based molecular modeling simulations revealed that Arg76 is located proximal to the active site of CI and its carbonylation leads to conformational changes in both the adjacent subunits compromising the active site and iron-sulfur (Fe-S) centers involved in electron transport, which have the potential to negatively impact protein function.
Materials and Methods
All materials were obtained from Sigma Aldrich or Fisher Scientific unless otherwise noted.
Induction of epileptogenesis.
Animal housing was conducted in compliance with the University of Colorado Anschutz Medical Campus. Male Sprague Dawley rats (∼300–350 g) were subcutaneously administered saline (vehicle) or 11 mg/kg kainate (KA) (Nanocs KA-0002) dissolved in sterile buffered saline, pH 7.4. Animals were observed for status epilepticus (SE) and given moistened chow with subcutaneous saline injections 24 h later to decrease mortality, which was 10–15%. Rats were killed by CO2 inhalation followed by a secondary method, i.e., immediate decapitation with a guillotine suitable for adult rats at 48 h, 1 week, and 6 weeks after injection to encompass the acute, latent, and chronic phases of epileptogenesis. Hippocampi, cortex, and cerebellum were recovered from these animals, immediately frozen, and stored at −80°C or crude mitochondria were isolated and immediately prepared for biochemical and mass spectrometry (MS) analysis.
Monitoring of convulsive seizures.
Behavioral seizures during SE were evaluated by direct observation for 6 h after KA injection and scored based on a modified Racine scale (Racine, 1972) with only motor seizures being considered (Class I and II seizures were not scored). Briefly, motor seizure severity was characterized as follows: Class III animals displayed forelimb clonus with a lordotic posture, Class IV animals reared with concomitant forelimb clonus, and Class V animals had a Class IV seizure and loss of balance. All animals having at least three Class III convulsive seizures each hour for at least 3 h are included in the study. If KA-injected animals did not meet the criteria for SE (i.e., <Class III seizures), they were labeled as nonresponders. Direct observation confirmed that animals were not having convulsive seizure activity 48 h and 1 week post-KA treatment (data not shown). Rats were monitored by 24/7 video in the University of Colorado In Vivo Neurophysiology Core for seizure number, duration, and severity during the 6 week time point to confirm epilepsy. Rats observed to have ≥2 spontaneous and convulsive seizures during the 6 week time point were considered epileptic.
Isolation of brain mitochondria and synaptosomes.
Crude hippocampal, cortical, and cerebellar mitochondria were isolated from 50 mg tissue according to our previous methods (Liang and Patel, 2006). The remaining pellet (crude mitochondria) was collected and used immediately for CI immunoprecipitation. Also, crude mitochondria were frozen at −80°C for CI activity measurements or Western blot analysis. For all studies, one hippocampus was used for each experiment with the exception of immunoprecipitation of CI subunits, in which both hippocampi from each rat were used. Synaptosomes were isolated according to our previous method (Liang et al., 2012). Synaptosomes were resuspended in 25 mm potassium phosphate buffer + 5 mm MgCl2, pH 7.0, for measurement of CI activity.
Biotin-hydrazide detection of carbonylated proteins.
Isolated crude mitochondria or immunoprecipitated CI proteins from saline and KA-treated rats were cleared for 1 h with NeutrAvidin beads (Pierce) before treatment with 5 mm biotin-hydrazide (Pierce) for 2 h rotating in the dark (Codreanu et al., 2009; Galligan et al., 2012). Samples were then reduced with 10 mm NaBH4 for 1 h in the dark before separation by SDS-PAGE. For crude mitochondria, 30 μg protein (Bradford assay) from three separate animals per time point was loaded onto a 10% Tris-HCl Ready gel (Bio-Rad). Samples were separated and transferred to a polyvinylidene difluoride membrane with a 0.45 μm pore size (Millipore). After blocking the membrane in 5% nonfat dry milk (Bio-Rad), carbonylation was detected by membrane incubation with a biotin-linked horseradish peroxidase primary antibody for 1 h (GeneTex) at 1:7500 and developed with Enhanced Chemiluminesence Plus reagents (GE Healthcare Biosciences). Bands were visualized with a Storm Optical Scanner (Molecular Dynamics) and band densitometry was quantified with National Institutes of Health (NIH) ImageJ 1.44 software and values were calculated as percentage to control (% Control). For samples of immunoprecipitated CI subunits (see below, CI immunocapture method), 10–20 μg of protein was derivitized with 5 mm biotin-hydrazide for 2 h rotating in the dark and then reduced with 10 mm NaBH4 for 1 h in the dark before separation by SDS-PAGE. Rats that did not meet criteria for KA-induced SE (see criteria above for nonresponders) were also prepared for carbonylation assessment in an identical manner.
CI and CIV activity.
NADH dehydrogenase (CI) and cytochrome c oxidase (CIV) activity was measured as described previously (Birch-Machin and Turnbull, 2001; Tieu et al., 2003). CI activity was measured in 1 ml reactions with 100 μg of crude hippocampal mitochondria by the oxidation of NADH at 340 nm for 2 min at 30°C with a Shimatzu UV2401PC spectrophotometer. The average CI activity for Ctl samples was calculated to be 148.1 ± 4.421 U/min/mg protein. Ctl values were normalized to 100 and data are represented as percentage control (% Control). CIV activity was measured in 1 ml reactions with 25 μg crude hippocampal mitochondria by the oxidation of cytochrome c (reduced with ascorbic acid) at 550 nm for 45 s at 30°C.
CI immunocapture.
CI was isolated according to Schilling et al. (2005) to assess PTMs after KA treatment. Briefly, 300 μg of crude hippocampal mitochondria from saline or KA-treated rats was solubilized in cold PBS containing 1% N-dodecyl-β-d-maltoside (DDM) for 30 min on ice for isolation of membrane proteins. Samples were then centrifuged at 20,000 g for 30 min, 4°C and supernatants were incubated overnight with agarose beads irreversibly cross-linked to specific monoclonal antibodies for CI proteins (Mitosciences). CI proteins were eluted from the beads with 30 μl 0.1 m glycine, pH 2.5, supplemented with 0.05% DDM. For biotin-hydrazide derivatization experiments, proteins were eluted with 30 μl 1% SDS. Protein concentration was determined on a NanoDrop 2000 before the addition of 30 μl 2× SDS-PAGE loading buffer (Bio-Rad) and 5 μl 1 M Tris, pH 8.0, neutralization buffer. CI proteins were resolved by SDS-PAGE on a 4–20% Tris-HCl Ready gel. Gels were then stained for band excision (described below) and trypsin digest.
Protein band excision and protein identification peptide mass fingerprinting.
Following SDS-PAGE, CI protein bands were identified with Imperial Protein Stain (Pierce) according to manufacturers' instructions and were excised with sterile razor blades. Gel bands were transferred to a 0.5 ml tube and were digested by “in-gel” cleavage with a modified protocol (Shevchenko et al., 2006). Briefly, gel slices were reduced with 10 mm dithiothreitol, alkylated with 25 mm iodoacetamide, and finally digested overnight in 0.3 μg trypsin (Promega V5111) at 37°C. Peptides were extracted from gel pieces in a sonicating waterbath first with 1:1 acetonitrile:50 mm NH4HCO3 then 0.1% formic acid before drying completely in a SpeedVac (Savant AES1000) at 37°C for 40 min. Peptides were then resolubilized in 100 mm acetic acid. For protein identification via peptide mass fingerprinting (PMF) the peptides were extracted, desalted using C18 Ziptips (Millipore), and mixed with matrix (10 mg/ml α-cyano-4-hydroxycinnamic acid in 60% acetonitrile/0.1% trifluoroacetic acid) at a ratio of 1:1 and then spotted in 1 μl aliquots onto a target plate and analyzed by MALDI-TOF MS on a Bruker Omniflex with Flex Control Software 2.0. Obtained mass spectra were externally calibrated with an equimolar mixture of bradykinin fragment, angiotensin II, P14R, ACTH 18–39, and insulin oxidized B chain (ProteoMass Kit; MSCAL1-Sigma). Spectra were analyzed with Flex Analysis Software 2.0 and database searches were conducted with BioTools 2.2 using Mascot 2.2 (Matrix Science; http://www.matrixscience.com). Protein identification (ID) parameters included optional modifications to methionine (oxidized) and cysteine (carbamidomethyl), SwissProt database, and Rattus taxonomy. Mascot scores were used to determine significant protein identification. Five or more peptides identified per protein were necessary for significant IDs. Samples were run and data analysis performed at the Skaggs Colorado School of Pharmacy and Pharmaceutical Sciences Mass Spectrometry Core at the University of Colorado Anschutz Medical Campus.
Detection of protein carbonylation by quantitative time-of-flight MS.
Once the 75 kDa subunit of CI was accurately identified by PMF, we assessed samples for protein carbonylation modifications. Peptides were resolubilized in 3% acetonitrile/0.1% formic acid and directly analyzed on an Agilent 6340 Ion Trap with LC chip cube. MS/MS data were analyzed in SpectraMill (Rev A.03.03.084 SR4). Protein identification parameters included optional modifications to methionine (oxidized; +16 Da mass shift), cysteine (carbamidomethyl; +57 Da mass shift), and arginine (GSA; −43 Da mass shift). The SwissProt database was searched with Rattus taxonomy and allowance of two missed cleavages. MS/MS spectral features were set at MH+ = 200–4000 Da, the minimum M/S signal-to-noise was set to 10 and the maximum at z = 4, and the precursor mass tolerance for the quantitative time-of-flight (QTOF) was 20 ppm while the product mass tolerance was 50 ppm. Filters were placed to include proteins with scores >11 and peptides >6. Additionally, the spectral peak intensity (SPI) was required to be 60% or greater. Sample run and data analysis were completed at the National Jewish Proteomics Core Facility in Denver, Colorado.
In silico protein homology and interaction modeling of CI.
All bioinformatic analyses and molecular modeling simulations were performed using Accelrys Discovery Studio 3.1 (Accelrys Software; http://accelrys.com). The crystal structure coordinates of the hydrophilic domain of CI from Thermus thermophilus (PDB: 3IAM) was obtained from the protein data bank (http://www.pdb.org). The homology model of the rat CI protein sequence was constructed using the crystal structure coordinates as a template (Eswar et al., 2006). Forty-eight percent similarity was identified between the T. thermophilus and rat sequences. Modified protein structures were made by altering the side chain of wild-type (WT) residue (Arg44) to the modified form (as determined by MS). Predicted modification-induced changes in protein conformation and surface charge were determined by subjecting the WT and modified structures to the conjugate gradient minimization protocol using a CHARMM force field and the Generalized Born implicit solvent model (Feig et al., 2004). Predicted changes in the interaction between the 51 kDa subunit and the WT or modified 75 kDa subunit were calculated using the ZDock algorithm (Chen and Weng, 2002). The ZRank scoring function was used to calculate the interaction energies of the resulting predicted protein complexes and represents a combination of van der Waals attractive and repulsive energies, short- and long-range repulsive and attractive energies, and desolvation (Pierce and Weng, 2007). Similarity of the predicted protein complexes to the crystal structure (3IAM) was determined by calculating and the root mean square deviation (RMSD) using the crystal structure as the reference. The four predicted protein complexes with the lowest RMSD values (i.e., the highest similarity to the crystal structure) were selected from each group for comparison.
Results
To establish the temporal relationship between seizure activity and the occurrence of mitochondrial oxidative stress during the process of epileptogenesis, we monitored rats for behavioral seizures by continuous video recordings. Biochemical assessment of mitochondrial oxidative stress and enzyme activities was conducted at three time points, i.e., 48 h, 1 week, and 6 weeks, which are associated with distinct phases of epileptogenesis, i.e., the acute, latent, and chronic periods, respectively. After injection of a single large dose of KA, severe, continuous seizure activity (SE) lasting ∼6 h was observed in rats followed by recovery. One week after KA injection, rats resumed normal behavior and showed no overt seizure activity consistent with a latent period (Dudek et al., 2002). Only rats observed to experience multiple, spontaneous convulsive seizures during the 6 week time point (chronic period), as characterized by bilateral clonus and/or loss of balance [Class IV and V seizures based on a modified Racine scale (Racine, 1972)], were considered epileptic and included in subsequent studies. Nonresponders, i.e., KA-treated rats that did not experience SE, were analyzed for evaluation of seizure-dependent effects. Saline-treated controls did not show any acute or spontaneous seizure activity. The results are consistent with our previous observations (Jarrett et al., 2008) and have allowed us to assess the consequences of mitochondrial oxidative stress during the acute, latent, and chronic stages of epileptogenesis.
Carbonylation of mitochondrial proteins and specific subunits of CI during epileptogenesis
One important mechanism by which ROS may alter cellular functions is via oxidative modifications of important proteins. Protein carbonylation is typical, as a result of aging or exposure to oxidative stress. It can inhibit protein function or induce degradation and is thus considered a biomarker for oxidant-induced cellular damage (Levine and Stadtman, 2001; Dalle-Donne et al., 2003). Using a biotin-hydrazide method to detect carbonylated proteins by Western blot analysis, we determined whether carbonylation of mitochondrial proteins occurred during epileptogenesis. We observed a significant increase in total carbonylated proteins within crude mitochondria at acute and chronic time points after KA administration (Fig. 1A), which is a marker for mitochondrial oxidative stress. Carbonylation was significantly increased, as evidenced by elevated biotin immunoreactivity after derivatization of carbonyl moieties with biotin-hydrazide, by 469.4% at 48 h (p < 0.001) and 842.2% at 6 week (p < 0.001) but not at 1 week (p > 0.05) in KA-treated rats compared with controls (Fig. 1B). In a separate study comparing rats that did not have seizures following KA treatment, i.e., nonresponders, carbonylation of mitochondrial proteins was not increased (Fig. 1C,D) when compared with Ctl, demonstrating that carbonylation was not due to exposure to KA per se but a consequence of seizure activity. Furthermore, protein carbonylation was examined in mitochondria isolated from cortex and cerebellum to determine the specificity of seizure-induced oxidative stress in the KA model. Again, compared with control (saline-treated rats), marked increases in protein carbonylation were observed in the hippocampus but not cortex or cerebellum of rats treated with KA for 48 h (n = 3/group data not shown). An additional study was conducted to assess specific changes in carbonylation to CI. Upon isolation of CI subunits, several proteins displayed elevated levels of carbonyl adducts at the 48 h and 6 week time points after KA (n = 3; data not shown). Interestingly, elevated carbonylation was observed at the 48 h and 6 week time points in a band corresponding to the 75 kDa subunit (Fig. 2A). The biphasic pattern of mitochondrial protein carbonylation observed here corresponded with levels of H2O2 production during epileptogenesis reported in our previous study (Jarrett et al., 2008).
Figure 1.

Elevation of carbonylated mitochondrial proteins observed in KA-treated rats at 48 h and 6 week time points during epileptogenesis. A, Thirty micrograms of protein from saline (Ctl), 48 h, 1 week, and 6 week KA-treated rats were assessed for carbonylation via the biotin-hydrazide method and detected by Western blot analysis; n = 3. Band intensity correlates with carbonylated proteins in isolated crude mitochondria. B, Quantification of carbonylated proteins using NIH ImageJ 1.44 analysis software. ***p < 0.001, one-way ANOVA with Dunnett's post hoc test. C, In a separate study, 10 μg protein from saline (Ctl), 48 h KA-treated, and 48 h KA-treated NS rats that did not meet criteria for SE (designated as no-status or NS) were assessed for carbonylation via the biotin-hydrazide method and detected by Western blot analysis; n = 3. D, Quantification of carbonylated proteins using NIH ImageJ 1.44 analysis software. ***p < 0.001, one-way ANOVA with Dunnett's post hoc test.
Figure 2.

Increased carbonylated protein in CI subunits and concomitant decreases in activity at 48 h and 6 week time points during epileptogenesis. A, Representative blot (focusing on the 75 kDa region of CI) of 20 μg CI protein immunoprecipitated from saline (Ctl), 48 h, 1 week, and 6 week KA-treated rats was assessed for carbonylation via the biotin-hydrazide method and detected by Western blot analysis; n = 3. B, CI activity measured spectrophotometrically in 100 μg mitochondria isolated from rat hippocampus, n = 6–10. *p ≤ 0.05; **p ≤ 0.01, one-way ANOVA with Dunnett's post hoc test.
Inhibition of mitochondrial CI activity during epileptogenesis
Oxidative modification and inhibition of CI have been observed in neurodegenerative and psychiatric disorders, such as PD and bipolar disorder (Keeney et al., 2006; Andreazza et al., 2010). Since CI deficiency has also been observed in the seizure foci and surviving CA3 cell layer in tissue from TLE patients (Kunz et al., 2000; Lee et al., 2008), we asked whether inhibition of CI activity occurred during KA-induced epileptogenesis. An inverse correlation was observed between total mitochondrial carbonylation and CI activity (Fig. 2B). Significant decreases of 24 and 23% in CI activity occurred at the acute (48 h) and chronic (6 week) phases of epileptogenesis but not during the latent phase (1 week; Fig. 2B). To determine whether CI activity is inhibited within neuron-enriched synaptic region of the hippocampus, synaptosomes were isolated from saline- and KA-treated rats after 48 h. Results indicated that CI activity was significantly decreased in synaptosomes after KA treatment (Ctl = 203 ± 6.804 and KA = 168.0 ± 4.429 U/min/mg protein, n = 4–5, p = 0.0037, Student's t test). A separate study was conducted to determine whether CI activity was altered in cortex and cerebellum in addition to the hippocampus so as to determine regional specificity of seizure-induced oxidative damage in the KA model. Comparison of hippocampus, cortex, and cerebellum revealed statistically significant decrease of CI activity in the hippocampus, but not cortex or cerebellum of rats treated with KA for 48 h (Cortex Ctl = 79.03 ± 9.474 and KA = 96.07 ± 12.32; Cerebellum Ctl = 144.9 ± 4.542 and KA = 160.8 ± 19.24 U/min/mg protein, n = 3). Previous work in our laboratory showed that mitochondrial complex II and III activities do not significantly change in the KA model of epileptogenesis (S. Jarrett and M. Patel, unpublished observations). Additionally, analysis of complex IV activity 48 h, 1 week, and 6 weeks indicated no significant change in response to KA-induced epileptogenesis (Ctl = 74.38 ± 4.636, 48 h; KA = 65.76 ± 4.414, 1 week KA = 70.4 ± 2.849, 6 week KA = 63.64 ± 7.9 U/min/mg protein; p > 0.05, n = 3–5/group). This suggests that neuronal loss per se does not contribute to CI inhibition. Thus, specific decreases of CI activity occur during periods of carbonyl adduct formation in hippocampal mitochondria during epileptogenesis.
Isolation and identification of the 75 kDa subunit of CI
The 75 kDa subunit of CI was chosen as a potential site of carbonylation, since it is the largest subunit within the hydrophilic domain of CI and has previously been shown to be carbonylated in resected brain tissue from PD patients with CI deficiency (Keeney et al., 2006). Before focusing on the 75 kDa subunit, we first sought to improve CI subunit isolation and separation methods from crude mitochondrial preparations in saline and KA-treated rats. We were able to reliably immunoprecipitate 30 μg of total CI protein and separate the subunits by SDS-PAGE. Evaluation of Coomassie-stained bands revealed no overt decreases in CI protein subunits between control and experimental groups (Fig. 3A). Initially, our goal was to identify as many CI subunits with a PMF strategy by MALDI TOF MS. Fifty percent of CI subunits were consistently identified using this technique, including the 75 kDa subunit which corresponds to Band 1 in Figure 3B.
Figure 3.

Isolation and identification of CI subunits by MS. A, Representative Coomassie stained gel of CI subunits isolated from saline (Ctl) and KA-treated rats 48 h, 1 week, and 6 week post-KA injection; n = 4. Numbers 1–14 indicate band removal for PMF protein identification with MALDI TOF MS. B, Fifty percent of CI subunits were identified including the 75 kDa subunit (75) corresponding to Band 1. Additional CI subunits identified by molecular weight correspond to Bands 2–14.
Carbonylation (MCO) of Arg76 to GSA76 on the 75 kDa subunit during epileptogenesis
QTOF MS with electrospray ionization was used to increase total sequence coverage of the 75 kDa subunit from 45%, with MALDI TOF MS, to 62%, which provided enhanced ability to measure oxidative modifications of peptides in KA-treated rats. Analysis of the MS data for the oxidation of the 75 kDa subunit in hippocampi of saline or KA-treated rats during acute, latent, and chronic phases of epileptogenesis revealed a specific type of carbonylation classified as MCO. MCO is typically generated in the presence of oxidative stress and increased chelatable metals such as iron. MCO primarily occurs on lysine (K) and arginine (R) protein residues, converting them to aminoadipic semialdehyde and GSA chemical modification products (Amici et al., 1989). Our data indicate that Arg76 is converted to GSA76 within the 75 kDa subunit 100% of the time at acute and chronic stages of epileptogenesis. This specific modification and location was observed on the peptide, (R)LSVAGNCRMCLVEIEK(A), as shown in Table 1. Criteria for validating MS data with SpectraMill analysis software included amino acid percentage coverage >30%, SPI >60%, a quantitative match between mass to charge ratio (m/z), and the expected mass based on singly protonated ions (MH+), all of which are shown in Table 1. In addition, a visual inspection of MS and MS/MS spectra was conducted (data not shown). GSA76 was observed only 25% of the time during the latent period, which is consistent with slight increases in mitochondrial carbonylation at 1 week (Fig. 1). Control animals did not have the GSA76 modification although the peptide was present. It should be noted that protein sequence coverage was similar between saline and experimental groups (data not shown). These data parallel mitochondrial carbonylation and CI inhibition data, indicating that MCO of Arg76 to GSA76 may have a functional impact on CI during epileptogenesis.
Table 1.
Mass spectrometry identification of carbonylation on the 75 kDa subunit
| AA# | AA % coverage | SPI % | Peptide sequence | Modification | m/z (Da) measured | MH+ (Da) matched | |
|---|---|---|---|---|---|---|---|
| Control | 69 | 48 | 83.1 | (R)LSVAGNCRmCLVEIEK(A) [100%] | m-Oxidized methionine | 594.2989 | 1780.8803 |
| 48 h KA | 69 | 55 | 77.2 | (R)LSVAGNcrMCLVEIEK(A) [100%] | c-Carbamidomethyl; r-GSA | 593.6242 | 1778.8673 |
| 1 week KA | 69 | 48 | 83.1 | (R)LSVAGNCRmCLVEIEK(A) [75%] | m-Oxidized methionine | 594.2989 | 1780.8803 |
| 1 week KA | 69 | 38 | 64.3 | (R)LSVAGNcrMCLVEIEK(A) [25%] | c-Carbamidomethyl; r-GSA | 593.623 | 1778.8682 |
| 6 week KA | 69 | 62 | 84 | (R)LSVAGNcrMCLVEIEK(A) [100%] | c-Carbamidomethyl; r-GSA | 593.6244 | 1778.8674 |
A GSA (carbonylation) PTM was identified by QTOF MS analysis on a single peptide, (R)LSVAGNCRMCLVEIEK(A), at arginine (r) 76. This modification occurred 100% of the time at 48 h, 25% at 1 week, and 100% at 6 week during epileptogenesis; n = 4 rats/group. AA = amino acid; Da, Dalton; KA, kainate; MH+ = expected protonated ions; m/z = mass to charge ratio; SPI = spectral peak intensity.
Functional consequences of carbonylation on the 75 kDa subunit during epileptogenesis
To determine the role of Arg76 in normal CI function we first examined the evolutionary conservation of this residue via a multiple sequence alignment between the 75 kDa subunit amino acid sequences of bacteria (T. thermophilus), mouse (Mus musculus), rat (Rattus norvegicus), cow (Bos taurus), and human (Homo sapiens) (Fig. 4A). Arg76, which corresponds to Arg44 in the bacterial sequence, is 100% conserved across all species examined, suggesting the importance of this residue to the proper function of CI. To assess functional consequences of formation of a GSA at this position during epileptogenesis we constructed homology models of the individual subunits comprising the rat CI hydrophilic domain based on the bacterial crystal structure template from T. thermophilus (Fig. 4B). The individual homology models of the rat CI hydrophilic subunits were assembled into their tertiary form by molecular overlay with the bacterial crystal structure (Fig. 4C). Sequence alignments of the hydrophilic subunits of CI between bacterial and rat species revealed an overall 48% sequence similarity among the entire hydrophilic domain of CI, while the 75 kDa subunit alone exhibited a 43% similarity between the two species. The alignment between the bacterial and rat CI indicated that Arg44 is the bacterial ortholog of Arg76 in the rat 75 kDa sequence. Both Arg44 in the crystal structure and Arg76 in our homology model are solvent-accessible residues located at the interaction interface between the 75 and 51 kDa subunits, in close proximity to the NADH binding site and the first Fe-S center involved in electron transfer (Fig. 4B,C). To examine the predicted alterations in the protein conformation of the complex in response to the GSA modification, the WT- and GSA-modified crystal structures of CI from T. thermophilus (3IAM) were subjected to energy minimization using the generalized Born implicit solvent model. The modification induced little change in the conformation of the 75 kDa subunit within the complex but resulted in substantial predicted shifts in the positions of residues Ile394-Ala405 and His350-Arg360 of the 51 kDa subunit (Fig. 4D). Additionally, the proximal Fe-S center was observed to shift position away from the NADH binding site (Fig. 4D). The modification-induced changes in protein conformation of the 51 kDa subunit were sufficient to significantly impair the predicted interaction between the 75 and 51 kDa subunits by 15% (p = 0.047) (Fig. 4E). Compared with the WT structure (Fig. 5A), the interface of the GSA-modified 75 kDa subunit involved in the interaction with the 51 kDa subunit also exhibited substantial predicted changes in molecular surface topology, as well as interpolated surface charge at the Arg site from positive (blue) to negative (red) (Fig. 5B).Together, these data demonstrate that specific MCO-induced carbonylation of Arg76 has the capacity to alter CI protein structure and function during acute and chronic stages of epileptogenesis.
Figure 4.
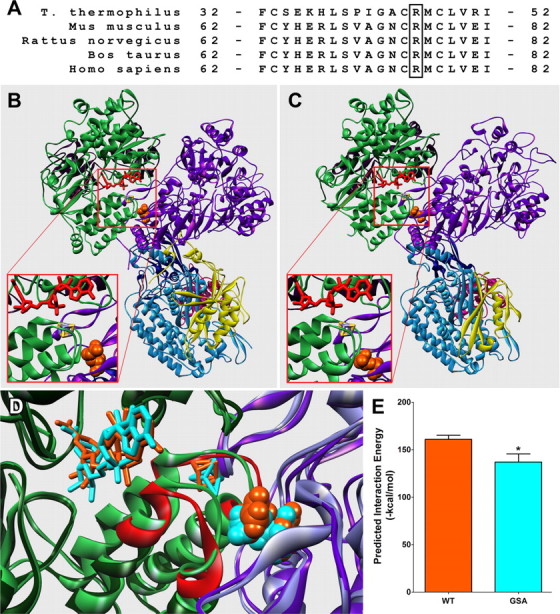
Location of the GSA-modified residue and the predicted modification-induced alterations in protein conformation and interaction energy. A, Multiple sequence alignment between bacteria (T. thermophilus), mouse (M. musculus), rat (R. norvegicus), cow (B. taurus), and human (H. sapiens) to show 100% conservation of arginine across multiple species. B, Crystal structure of the hydrophilic domain of CI from T. thermophilus (PDB ID: 3IAM). C, Protein homology model of the rat ortholog constructed using 3IAM as a template. The modified residue is depicted as orange spheres with bound NADH in red and the individual CI subunits colored as follows: 75 kDa, purple; 51 kDa, green; 24 kDa, maroon; 49 kDa, light blue; 30 kDa, dark blue; TYKY, pink; and PSST, yellow. Insets, Close-ups of the NADH binding site, the initial Fe-S center involved in electron transfer (purple and yellow sticks), and Arg44/Arg76 (orange spheres). D, Overlay of minimized WT and GSA-modified 3IAM structures. WT 51 and 75 kDa subunits are light green and light purple; the structures of the modified 51 and 75 kDa subunits are dark green and dark purple. NADH, the first Fe-S center, and the GSA-modified residue are colored orange for the WT structure and cyan for the modified. Predicted conformational changes observed in the 51 kDa subunit in response to the modification are colored red. E, Predicted energy of interaction between the 51 and 75 kDa subunits of the WT and the modified (GSA) structures. *p < 0.05 with Student's t test.
Figure 5.
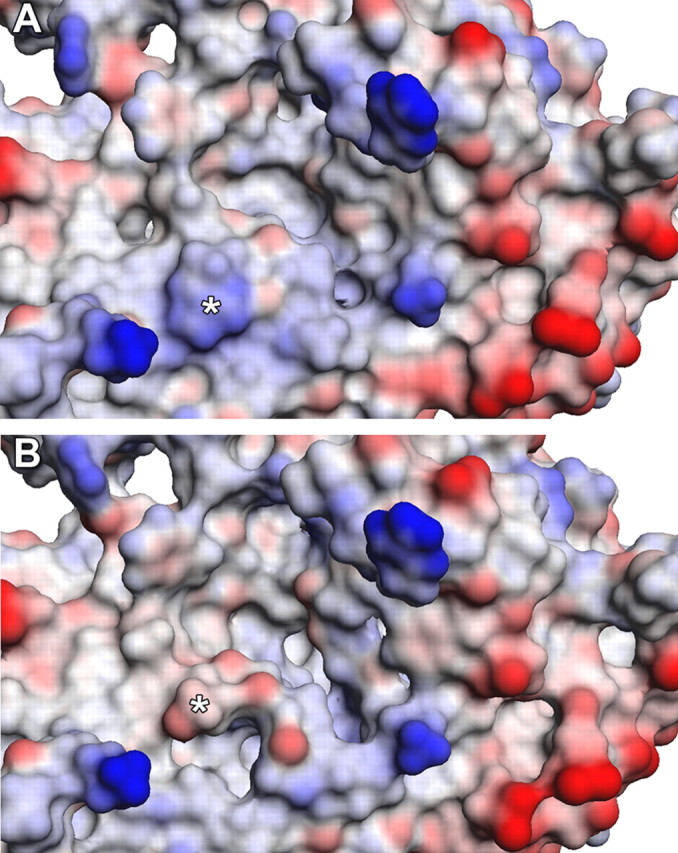
Predicted structural and surface charge alterations to the interaction interface of the 75 kDa subunit in response to carbonylation of Arg44. A, B, Molecular surface representation of the interaction interface of the 75 kDa subunit from the energy minimized crystal structure of T. thermophilus of the WT (A) and GSA-modified form (B). Interpolated surface charge is indicated as a range from positive (blue) to neutral (white) to negative (red). The asterisks denote the positions of Arg44 and the GSA-modified form.
Discussion
This study demonstrates for the first time an oxidative PTM of CI, an important component of the mitochondrial ETC complex, in epileptogenesis. The data support the conclusion that oxidative modification via carbonylation of the 75 kDa subunit of CI occurs in a biphasic manner during epileptogenesis, coincident with carbonylation of mitochondrial proteins and inhibition of CI activity. The nature of the post-translational oxidative modification was identified as a specific metal catalyzed carbonylation of the 75 kDa subunit, converting Arg76 to GSA76. Our molecular modeling studies indicate that carbonylation of the 75 kDa is predicted to alter its surface structure and charge at the interaction interface within the CI active site, its interaction with the 51 kDa subunit of CI, and the position of nearby Fe-S centers proximal to the CI active site, which can impair electron transfer from NADH to the proximal Fe-S center, and thus CI function. Collectively these data identify a post-translational oxidative lesion on Arg76 in an important subunit of mitochondrial CI during epileptogenesis.
Previous work has demonstrated increased mitochondrial ROS production during the acute and chronic phases of epileptogenesis (Jarrett et al., 2008; Waldbaum et al., 2010). Here we demonstrate a specific ROS-mediated oxidative PTM in the 75 kDa subunit of CI during the acute and chronic phases of epilepsy development, which can impair mitochondrial function during epileptogenesis. The significance of carbonylation and inhibition of CI is twofold. First, CI is not only a target of oxidative stress via PTMs, but it is also a source of superoxide production when inhibited, generating excess reactive species and further mitochondrial and cellular damage (Kudin et al., 2004; Fato et al., 2008; Hirst, 2010; Murphy, 2009). Therefore, CI may be both a source and target of ROS creating a vicious cycle in which seizures result in ROS production leading to oxidative inactivation of CI, which in turn results in increased superoxide formation. Second, specific CI deficiency has been observed in tissue resected from TLE patients (Kunz et al., 2000), but the mechanism by which CI inhibition occurred was unknown. In the latter study, reduction in CI activity was postulated to occur due to decreases in mitochondrial DNA copy number and a concomitant downregulation of oxidative phosphorylation enzymes encoded by mitochondrial DNA. Our data in the KA model of TLE provides a potential mechanism for the loss of CI activity through PTM of the enzyme by ROS. The biphasic occurrence of CI modification during the acute and chronic phases of KA-induced epileptogenesis, but not the latent period, is consistent with the time course of increased mitochondrial H2O2 production observed previously (Jarrett et al., 2008; Waldbaum et al., 2010) and with carbonylation of mitochondrial proteins (Fig. 1) in the hippocampus. The absence of mitochondrial carbonylation in rats unresponsive to KA indicates that mitochondrial oxidative damage is a consequence of seizure activity rather than KA exposure per se. To date, CI modification by glutathionylation, nitrosylation, and carbonylation has been suggested to inhibit function of the enzyme (Taylor et al., 2003; Dahm et al., 2006; Andreazza et al., 2010). In this study, we report the evidence that carbonylation is the cause of CI inhibition during epileptogenesis. In contrast with glutathionylation and nitrosylation, which are reversible modifications, carbonylation is a covalent oxidative modification and is therefore capable of permanently damaging the protein. As previously noted, CI carbonylation has been observed in tissue resected from PD patients (Keeney et al., 2006) and the pattern of subunit oxidation was similar to studies using rotenone to pharmacologically block CI function. The latter study suggested that only ROS generated from internal CI inhibition could create this pattern of CI carbonylation and proposed the significance of CI modifications during disease states. However, the specific location and type of carbonylation was not identified. Protein-specific carbonyl adducts are difficult to detect in vivo due to their low abundance, turnover, and loss during sample preparation and analysis (Berlett and Stadtman, 1997; Fritz and Petersen, 2011; Møller et al., 2011). Furthermore, endogenous carbonylation to mitochondrial ETC complexes has been reported and highlights the importance of distinguishing between disease-state modifications versus those resulting from normal ROS production (Choksi et al., 2004).
This study suggests that the mechanism for CI dysfunction is potentially due to specific MCO of Arg76 to a GSA76 in the 75 kDa subunit. MCO is a major route for protein carbonyl formation in biological samples and can yield highly reactive carbonyl derivatives (i.e., GSA products), which can negatively impact protein function, turnover, or DNA binding (Requena et al., 2001). Although MCO may not be the most common type of carbonyl addition in vivo, the probability of its identification in this study is elevated due to our previous reports that mitochondrial Fenton reactants, H2O2 and Fe2+, are increased in the KA model (Jarrett et al., 2008; Liang et al., 2008). These data suggest that MCO products may exist in other neurological conditions with increased mitochondrial oxidative stress and elevated redox active chelatable metals such as PD (Gerlach et al., 1994; Liang and Patel, 2004; Lee and Andersen, 2010).
The location of GSA76 is also a critical component for understanding the mechanism of CI inhibition by MCO. The structure of CI implies that the catalytic center is relatively shielded from ROS and the majority of PTMs occur on exposed surfaces of subunits within the hydrophilic arm of the complex (Murphy, 2009). Molecular modeling of the hydrophilic arm of CI in rat shows that Arg76 (or GSA76) is uniquely situated near the N terminus of the 75 kDa subunit; this location is not only close to the active site, it is also surface exposed, increasing the probability for its modification. Sequence alignments of the 75 kDa subunit between bacteria, mouse, rat, cow, and human species show that this arginine and its flanking amino acids are 100% conserved, indicating both the importance of this region to CI function and its potential to be modified in multiple species during oxidative stress. A reactive GSA product near the active site of CI (1) changed the spatial orientation of the adjacent 51 kDa subunit containing the NADH binding site and (2) changed the position of the proximal Fe-S, which may impact electron transfer. The modified Arg76 residue is located in close proximity to the NADH binding site; however, the modification had no effect on the predicted binding of NADH (data not shown), suggesting that the observed decrease in in vivo activity is not due to altered affinity for NADH. Given the substantial predicted changes to the protein surface topology and charge in response to formation of the GSA modification, it is not surprising that the modification is also predicted to significantly impair the interaction between the 51 and 75 kDa subunits. While this does not necessarily suggest that the two subunits are dissociated as a result of modification, results may indicate a decrease in the cohesiveness of the active site that may lower CI activity without altering the affinity for NADH per se. Interestingly, the modification induced a predicted shift in the position of the Fe-S center involved in the initial electron transfer from NADH that resulted in an increase in the distance between the two molecules. This suggests the possibility that the changes in activity in response to the modification may be due to impairment of the initial transfer of electrons from NADH to the Fe-S center.
While we chose to focus our efforts on the 75 kDa subunit due to its location within the mitochondrial matrix (i.e., close proximity to reactive species), its well documented capacity for PTM, and its critical role in the CI active site (Hirst et al., 2003), it is likely that additional CI subunits are carbonylated. In addition, our increased detection of total carbonylated mitochondrial proteins does not indicate that all modifications are necessarily the result of MCO. Biotin-hydrazide, which was used to detect carbonylated proteins, can label various aldehyde and ketone carbonyl groups that may be the products of diverse oxidative reactions. We recognize that the discovery of adducts can be difficult in vivo and determination of all PTMs of the CI subunits during epileptogenesis may require more sophisticated detection techniques.
In summary, we have shown that MCO within the CI active site is occurring during epileptogenesis. Persistent CI inhibition during the chronic phase of epileptogenesis can ultimately inhibit mitochondrial ATP production leading to a bioenergetic crisis. Multiple studies have shown sensitivity of ETC complexes to oxidative stress (Zhang et al., 1990; Cadenas and Davies, 2000). ATP depletion can affect various cellular functions, including neuronal excitability, by interfering with ATP-dependent ion channels that maintain neuronal membrane potential leading to chronic mitochondrial dysfunction (Jamme et al., 1995; Nicholls and Ward, 2000; Fighera et al., 2006). These observations suggest that oxidative damage and CI carbonylation may have a mechanistic role in epileptogenesis be a future therapeutic target for the prevention of acquired epilepsies.
Footnotes
This work is supported by National Institutes of Health Grant RO1NS039587. We thank Dr. Yogendra Raol and the University of Colorado Anschutz Medical Campus (UCAMC) In Vivo Neurophysiology Core facility, Mr. Joe Gomez and the UCAMC Mass Spectrometry Core facility, and the Computational Chemistry and Biology Core facility at the UCAMC School of Pharmacy, as well as the Proteomics Core at National Jewish Health in Denver, Colorado, for their technical assistance.
References
- Amici A, Levine RL, Tsai L, Stadtman ER. Conversion of amino acid residues in proteins and amino acid homopolymers to carbonyl derivatives by metal-catalyzed oxidation reactions. J Biol Chem. 1989;264:3341–3346. [PubMed] [Google Scholar]
- Andersen JK. Oxidative stress in neurodegeneration: cause or consequence? Nat Med. 2004;10(Suppl):S18–S25. doi: 10.1038/nrn1434. [DOI] [PubMed] [Google Scholar]
- Andreazza AC, Shao L, Wang JF, Young LT. Mitochondrial complex I activity and oxidative damage to mitochondrial proteins in the prefrontal cortex of patients with bipolar disorder. Arch Gen Psychiatry. 2010;67:360–368. doi: 10.1001/archgenpsychiatry.2010.22. [DOI] [PubMed] [Google Scholar]
- Beal MF. Mitochondria take center stage in aging and neurodegeneration. Ann Neurol. 2005;58:495–505. doi: 10.1002/ana.20624. [DOI] [PubMed] [Google Scholar]
- Berlett BS, Stadtman ER. Protein oxidation in aging, disease, and oxidative stress. J Biol Chem. 1997;272:20313–20316. doi: 10.1074/jbc.272.33.20313. [DOI] [PubMed] [Google Scholar]
- Birch-Machin MA, Turnbull DM. Assaying mitochondrial respiratory complex activity in mitochondria isolated from human cells and tissues. Methods Cell Biol. 2001;65:97–117. doi: 10.1016/s0091-679x(01)65006-4. [DOI] [PubMed] [Google Scholar]
- Cadenas E, Davies KJ. Mitochondrial free radical generation, oxidative stress, and aging. Free Radic Biol Med. 2000;29:222–230. doi: 10.1016/s0891-5849(00)00317-8. [DOI] [PubMed] [Google Scholar]
- Chen R, Weng Z. Docking unbound proteins using shape complementarity, desolvation, and electrostatics. Proteins. 2002;47:281–294. doi: 10.1002/prot.10092. [DOI] [PubMed] [Google Scholar]
- Choksi KB, Boylston WH, Rabek JP, Widger WR, Papaconstantinou J. Oxidatively damaged proteins of heart mitochondrial electron transport complexes. Biochim Biophys Acta. 2004;1688:95–101. doi: 10.1016/j.bbadis.2003.11.007. [DOI] [PubMed] [Google Scholar]
- Codreanu SG, Zhang B, Sobecki SM, Billheimer DD, Liebler DC. Global analysis of protein damage by the lipid electrophile 4-hydroxy-2-nonenal. Mol Cell Proteomics. 2009;8:670–680. doi: 10.1074/mcp.M800070-MCP200. [DOI] [PMC free article] [PubMed] [Google Scholar]
- Dahm CC, Moore K, Murphy MP. Persistent S-nitrosation of complex I and other mitochondrial membrane proteins by S-nitrosothiols but not nitric oxide or peroxynitrite: implications for the interaction of nitric oxide with mitochondria. J Biol Chem. 2006;281:10056–10065. doi: 10.1074/jbc.M512203200. [DOI] [PubMed] [Google Scholar]
- Dalle-Donne I, Giustarini D, Colombo R, Rossi R, Milzani A. Protein carbonylation in human diseases. Trends Mol Med. 2003;9:169–176. doi: 10.1016/s1471-4914(03)00031-5. [DOI] [PubMed] [Google Scholar]
- Dalle-Donne I, Aldini G, Carini M, Colombo R, Rossi R, Milzani A. Protein carbonylation, cellular dysfunction, and disease progression. J Cell Mol Med. 2006;10:389–406. doi: 10.1111/j.1582-4934.2006.tb00407.x. [DOI] [PMC free article] [PubMed] [Google Scholar]
- Danielson SR, Andersen JK. Oxidative and nitrative protein modifications in Parkinson's disease. Free Radic Biol Med. 2008;44:1787–1794. doi: 10.1016/j.freeradbiomed.2008.03.005. [DOI] [PMC free article] [PubMed] [Google Scholar]
- Dudek FE, Hellier JL, Williams PA, Ferraro DJ, Staley KJ. The course of cellular alterations associated with the development of spontaneous seizures after status epilepticus. Prog Brain Res. 2002;135:53–65. doi: 10.1016/S0079-6123(02)35007-6. [DOI] [PubMed] [Google Scholar]
- Eswar N, Webb B, Marti-Renom MA, Madhusudhan MS, Eramian D, Shen MY, Pieper U, Sali A. Comparative protein structure modeling using Modeller. Curr Protoc Bioinformatics Chapter. 2006;5 doi: 10.1002/0471250953.bi0506s15. Unit 5.6. [DOI] [PMC free article] [PubMed] [Google Scholar]
- Fato R, Bergamini C, Leoni S, Lenaz G. Mitochondrial production of reactive oxygen species: role of complex I and quinone analogues. Biofactors. 2008;32:31–39. doi: 10.1002/biof.5520320105. [DOI] [PubMed] [Google Scholar]
- Feig M, Onufriev A, Lee MS, Im W, Case DA, Brooks CL., 3rd Performance comparison of generalized born and Poisson methods in the calculation of electrostatic solvation energies for protein structures. J Comput Chem. 2004;25:265–284. doi: 10.1002/jcc.10378. [DOI] [PubMed] [Google Scholar]
- Fighera MR, Royes LF, Furian AF, Oliveira MS, Fiorenza NG, Frussa-Filho R, Petry JC, Coelho RC, Mello CF. GM1 ganglioside prevents seizures, Na+,K+-ATPase activity inhibition and oxidative stress induced by glutaric acid and pentylenetetrazole. Neurobiol Dis. 2006;22:611–623. doi: 10.1016/j.nbd.2006.01.002. [DOI] [PubMed] [Google Scholar]
- Fritz KS, Petersen DR. Exploring the biology of lipid peroxidation-derived protein carbonylation. Chem Res Toxicol. 2011;24:1411–1419. doi: 10.1021/tx200169n. [DOI] [PMC free article] [PubMed] [Google Scholar]
- Galligan JJ, Smathers RL, Fritz KS, Epperson LE, Hunter LE, Petersen DR. Protein carbonylation in a murine model for early alcoholic liver disease. Chem Res Toxicol. 2012;25:1012–1021. doi: 10.1021/tx300002q. [DOI] [PMC free article] [PubMed] [Google Scholar]
- Gerlach M, Ben-Shachar D, Riederer P, Youdim MB. Altered brain metabolism of iron as a cause of neurodegenerative diseases? J Neurochem. 1994;63:793–807. doi: 10.1046/j.1471-4159.1994.63030793.x. [DOI] [PubMed] [Google Scholar]
- Hirst J. Towards the molecular mechanism of respiratory complex I. Biochem J. 2010;425:327–339. doi: 10.1042/BJ20091382. [DOI] [PubMed] [Google Scholar]
- Hirst J, Carroll J, Fearnley IM, Shannon RJ, Walker JE. The nuclear encoded subunits of complex I from bovine heart mitochondria. Biochim Biophys Acta. 2003;1604:135–150. doi: 10.1016/s0005-2728(03)00059-8. [DOI] [PubMed] [Google Scholar]
- Jamme I, Petit E, Divoux D, Gerbi A, Maixent JM, Nouvelot A. Modulation of mouse cerebral Na+,K(+)-ATPase activity by oxygen free radicals. Neuroreport. 1995;7:333–337. [PubMed] [Google Scholar]
- Jarrett SG, Liang LP, Hellier JL, Staley KJ, Patel M. Mitochondrial DNA damage and impaired base excision repair during epileptogenesis. Neurobiol Dis. 2008;30:130–138. doi: 10.1016/j.nbd.2007.12.009. [DOI] [PMC free article] [PubMed] [Google Scholar]
- Keeney PM, Xie J, Capaldi RA, Bennett JP., Jr Parkinson's disease brain mitochondrial complex I has oxidatively damaged subunits and is functionally impaired and misassembled. J Neurosci. 2006;26:5256–5264. doi: 10.1523/JNEUROSCI.0984-06.2006. [DOI] [PMC free article] [PubMed] [Google Scholar]
- Kudin AP, Bimpong-Buta NY, Vielhaber S, Elger CE, Kunz WS. Characterization of superoxide-producing sites in isolated brain mitochondria. J Biol Chem. 2004;279:4127–4135. doi: 10.1074/jbc.M310341200. [DOI] [PubMed] [Google Scholar]
- Kunz WS, Kudin AP, Vielhaber S, Blümcke I, Zuschratter W, Schramm J, Beck H, Elger CE. Mitochondrial complex I deficiency in the epileptic focus of patients with temporal lobe epilepsy. Ann Neurol. 2000;48:766–773. [PubMed] [Google Scholar]
- Lee DW, Andersen JK. Iron elevations in the aging Parkinsonian brain: a consequence of impaired iron homeostasis? J Neurochem. 2010;112:332–339. doi: 10.1111/j.1471-4159.2009.06470.x. [DOI] [PubMed] [Google Scholar]
- Lee YM, Kang HC, Lee JS, Kim SH, Kim EY, Lee SK, Slama A, Kim HD. Mitochondrial respiratory chain defects: underlying etiology in various epileptic conditions. Epilepsia. 2008;49:685–690. doi: 10.1111/j.1528-1167.2007.01522.x. [DOI] [PubMed] [Google Scholar]
- Levine RL, Stadtman ER. Oxidative modification of proteins during aging. Exp Gerontol. 2001;36:1495–1502. doi: 10.1016/s0531-5565(01)00135-8. [DOI] [PubMed] [Google Scholar]
- Liang LP, Patel M. Iron-sulfur enzyme mediated mitochondrial superoxide toxicity in experimental Parkinson's disease. J Neurochem. 2004;90:1076–1084. doi: 10.1111/j.1471-4159.2004.02567.x. [DOI] [PubMed] [Google Scholar]
- Liang LP, Patel M. Seizure-induced changes in mitochondrial redox status. Free Radic Biol Med. 2006;40:316–322. doi: 10.1016/j.freeradbiomed.2005.08.026. [DOI] [PubMed] [Google Scholar]
- Liang LP, Jarrett SG, Patel M. Chelation of mitochondrial iron prevents seizure-induced mitochondrial dysfunction and neuronal injury. J Neurosci. 2008;28:11550–11556. doi: 10.1523/JNEUROSCI.3016-08.2008. [DOI] [PMC free article] [PubMed] [Google Scholar]
- Liang LP, Waldbaum S, Rowley S, Huang TT, Day BJ, Patel M. Mitochondrial oxidative stress and epilepsy in SOD2 deficient mice: attenuation by a lipophilic metalloporphyrin. Neurobiol Dis. 2012;45:1068–1076. doi: 10.1016/j.nbd.2011.12.025. [DOI] [PMC free article] [PubMed] [Google Scholar]
- Møller IM, Rogowska-Wrzesinska A, Rao RS. Protein carbonylation and metal-catalyzed protein oxidation in a cellular perspective. J Proteomics. 2011;74:2228–2242. doi: 10.1016/j.jprot.2011.05.004. [DOI] [PubMed] [Google Scholar]
- Murphy MP. How mitochondria produce reactive oxygen species. Biochem J. 2009;417:1–13. doi: 10.1042/BJ20081386. [DOI] [PMC free article] [PubMed] [Google Scholar]
- Nicholls DG, Ward MW. Mitochondrial membrane potential and neuronal glutamate excitotoxicity: mortality and millivolts. Trends Neurosci. 2000;23:166–174. doi: 10.1016/s0166-2236(99)01534-9. [DOI] [PubMed] [Google Scholar]
- Pierce B, Weng Z. ZRANK: reranking protein docking predictions with an optimized energy function. Proteins. 2007;67:1078–1086. doi: 10.1002/prot.21373. [DOI] [PubMed] [Google Scholar]
- Racine RJ. Modification of seizure activity by electrical stimulation. I. After-discharge threshold. Electroencephalogr Clin Neurophysiol. 1972;32:269–279. doi: 10.1016/0013-4694(72)90176-9. [DOI] [PubMed] [Google Scholar]
- Requena JR, Chao CC, Levine RL, Stadtman ER. Glutamic and aminoadipic semialdehydes are the main carbonyl products of metal-catalyzed oxidation of proteins. Proc Natl Acad Sci U S A. 2001;98:69–74. doi: 10.1073/pnas.011526698. [DOI] [PMC free article] [PubMed] [Google Scholar]
- Schapira AH. Mitochondrial involvement in Parkinson's disease, Huntington's disease, hereditary spastic paraplegia and Friedreich's ataxia. Biochim Biophys Acta. 1999;1410:159–170. doi: 10.1016/s0005-2728(98)00164-9. [DOI] [PubMed] [Google Scholar]
- Schilling B, Bharath MMS, Row RH, Murray J, Cusack MP, Capaldi RA, Freed CR, Prasad KN, Andersen JK, Gibson BW. Rapid purification and mass spectrometric characterization of mitochondrial NADH dehydrogenase (Complex I) from rodent brain and a dopaminergic neuronal cell line. Mol Cell Proteomics. 2005;4:84–96. doi: 10.1074/mcp.M400143-MCP200. [DOI] [PubMed] [Google Scholar]
- Shevchenko A, Tomas H, Havlis J, Olsen JV, Mann M. In-gel digestion for mass spectrometric characterization of proteins and proteomes. Nat Protoc. 2006;1:2856–2860. doi: 10.1038/nprot.2006.468. [DOI] [PubMed] [Google Scholar]
- Taylor ER, Hurrell F, Shannon RJ, Lin TK, Hirst J, Murphy MP. Reversible glutathionylation of complex I increases mitochondrial superoxide formation. J Biol Chem. 2003;278:19603–19610. doi: 10.1074/jbc.M209359200. [DOI] [PubMed] [Google Scholar]
- Tieu K, Perier C, Caspersen C, Teismann P, Wu DC, Yan SD, Naini A, Vila M, Jackson-Lewis V, Ramasamy R, Przedborski S. D-beta-hydroxybutyrate rescues mitochondrial respiration and mitigates features of Parkinson disease. J Clin Invest. 2003;112:892–901. doi: 10.1172/JCI18797. [DOI] [PMC free article] [PubMed] [Google Scholar]
- Waldbaum S, Liang LP, Patel M. Persistent impairment of mitochondrial and tissue redox status during lithium-pilocarpine-induced epileptogenesis. J Neurochem. 2010;115:1172–1182. doi: 10.1111/j.1471-4159.2010.07013.x. [DOI] [PMC free article] [PubMed] [Google Scholar]
- Zhang Y, Marcillat O, Giulivi C, Ernster L, Davies KJ. The oxidative inactivation of mitochondrial electron transport chain components and ATPase. J Biol Chem. 1990;265:16330–16336. [PubMed] [Google Scholar]