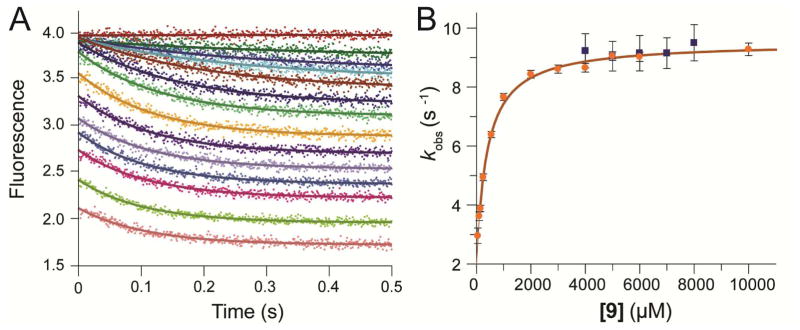
Figure 4. Stopped-Flow Fluorescence.
A) The stopped-flow fluorescence traces (0.5 s) showing reaction of αY60W-CaaD with 9 were fit to a single exponential (eq 1) shown in solid lines. The concentrations of 9 are: 0, 50, 100, 150, 250, 550, 1000, 2000, 3000, 4000, 5000, 6000, 8000, 10000 μM. B) The observed rate constant (kobs) from the 1 s stopped-flow data for the wild-type (■) and the αY60W (●) CaaD plotted versus the concentration of 9. Error bars for the kobs values are representative of the scatter in the data. Within error, the rate at high concentrations are identical. At lower concentrations, the signal to noise is too low to accurately resolve the rate. The solid line is a fit of the data to the hyperbolic equation (eq 3).

