Abstract
The migraine attack is characterized by alterations in sensory perception, such as photophobia or allodynia, which have in common an uncomfortable amplification of the percept. It is not known how these changes arise. We evaluated the ability of cortical spreading depression (CSD), the proposed mechanism of the migraine aura, to shape the cortical activity that underlies sensory perception. We measured forepaw- and hindpaw-evoked sensory responses in rat, before and after CSD, using multielectrode array recordings and two-dimensional optical spectroscopy. CSD significantly altered cortical sensory processing on a timescale compatible with the duration of the migraine attack. Both electrophysiological and hemodynamic maps had a reduced surface area (were sharpened) after CSD. Electrophysiological responses were potentiated at the receptive field center but suppressed in surround regions. Finally, the normal adaptation of sensory-evoked responses was attenuated at the receptive field center. In summary, we show that CSD induces changes in the evoked cortical response that are consistent with known mechanisms of cortical plasticity. These mechanisms provide a novel neurobiological substrate to explain the sensory alterations of the migraine attack.
Introduction
Migraine is a multisystem disorder involving transient but severe disruptions of homeostasis and sensory processing. Beyond craniofacial pain, sensation is altered during the course of the migraine attack. The aura that can precede a migraine is a frank sensory hallucination, and the photophobia, phonophobia, and allodynia that accompany the attack are painful amplifications of visual, auditory, and tactile perception.
The mechanisms of sensory modulation during the migraine attack are poorly understood. Changes in sensation take minutes to develop but can persist for hours or even days, suggesting both cortical and subcortical network alterations. The cerebral cortex is integral to conscious sensory experience and demonstrates more intrinsic plasticity than lower structures in the sensory network (Ahissar et al., 2000; Foeller and Feldman, 2004; Feldman and Brecht, 2005). However, there has been relatively little examination of cortical sensory networks in migraine models.
Cortical spreading depression (CSD) is thought to be the physiological correlate of the migraine aura (Charles and Brennan, 2009). CSD is a propagating wave of neuronal and glial depolarization, involving extracellular voltage changes larger than during seizures (Somjen, 2001). Hemodynamic changes are equally large, with hemoglobin desaturation to levels encountered during ischemia (Chang et al., 2010). Such profound disruptions could be inferred to have conditioning effects on both cortical and subcortical structures, which in turn might contribute to the migraine phenotype.
We tested the effects of CSD on sensory processing in vivo, using a combination of two-dimensional optical spectroscopy (2dOS), planar multielectrode array recordings, and naturalistic stimulation. We observed a sharpening of cortical sensory maps, potentiation or suppression of evoked potentials depending on location relative to the sensory map, and reduced sensory adaptation, all of which could contribute to the altered sensorium of the migraine attack.
Materials and Methods
Animal preparation.
Adult male Sprague Dawley rats (n = 11, weighing 481 ± 80 g) were used in accordance with the University of California at Los Angeles and University of Utah Animal Research Committee guidelines. Anesthesia was induced with 5% enflurane and maintained at 1–2% for the duration of the experiment, in a 2:1 nitrogen/oxygen mixture. An 8 × 5 mm2 cranial window in the right parietal and frontal bones (1 mm lateral to midline) exposed the somatosensory cortex. An eight-channel planar electrode array was positioned into the cranial window after retraction of the dura (Figs. 1, 2). Trials began at least 1 h after the electrode array was placed onto the cortical surface.
Figure 1.
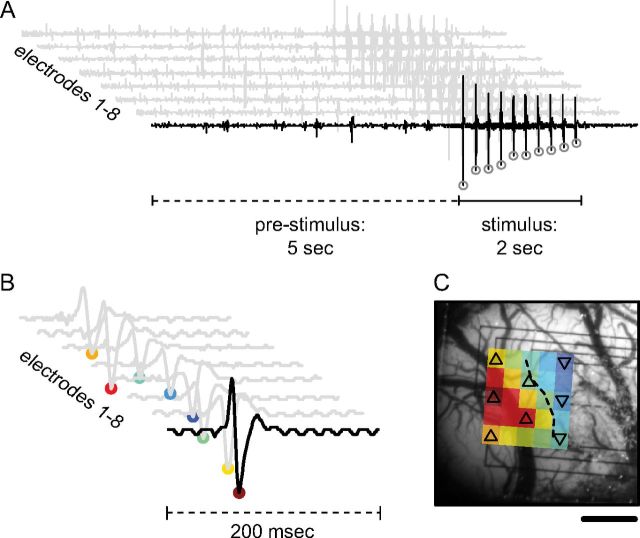
Generation of field potential maps with imaging-compatible multielectrode array. A, Eight field potential traces for a single trial show the 5 s prestimulus baseline when spontaneous peaks are counted as well as the 2 s stimulation period from which sEPs are derived. A single stimulus train produces 10 evoked field potentials, which are quantified by the amplitude of their most negative deflection (open circles). B, The sum of all 10 evoked responses generates eight sEP waveforms for each trial. C, The amplitude of these reduced waveforms (filled circles, B) can be interpolated and spatially mapped to the corresponding electrode location and superimposed over an anatomical reference image. The area of the evoked neural response is quantified as the number of electrodes that fall above a threshold of half the amplitude of the maximal responding electrode (dashed contour, up-triangle above threshold, down-triangle below threshold). Scale bar, 1 mm.
Figure 2.
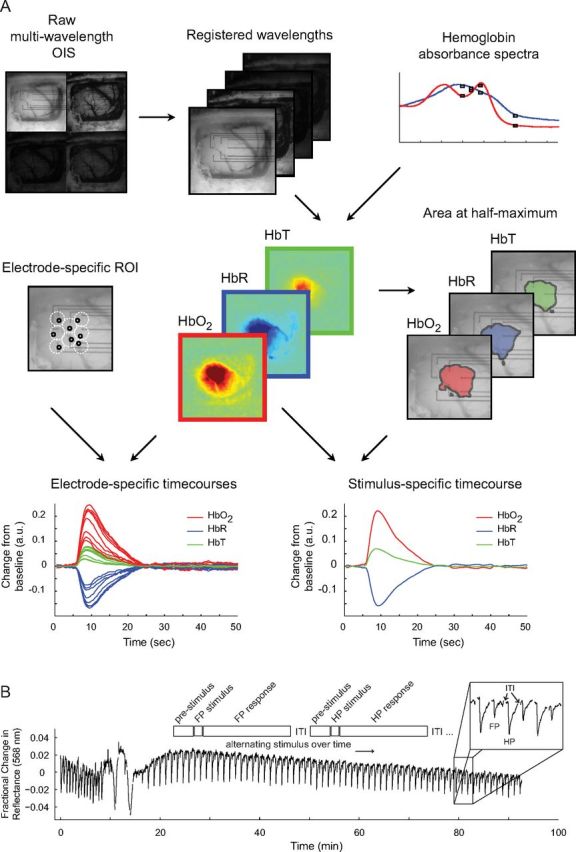
Generation of hemoglobin maps and experimental paradigm. A, Raw optical images are separated into subimages based on wavelength and are spatially registered. Along with hemoglobin absorbance spectra, these images are then fit to a modified form of the Beer–Lambert law to produce maps for Δ[HbO2], Δ[HbR], and Δ[HbT]. 2dOS maps are then analyzed either as a full image or based on individual ROIs. For each hemoglobin moiety, a threshold is set to 50% of maximum amplitude change so that the area, location, and magnitude of the response to various stimuli can be characterized. Also, individual ROIs are set adjacent to each electrode, avoiding large vessels, so that a direct comparison between optical and electrical datasets can be made. OIS, Optical imaging of intrinsic signals. B, Schematic shows experimental timeline. ITI, Intertrial interval. Trace shows optical reflectance at a single ROI for every trial over the course of a typical CSD experiment (except for ITI, gaps in trace where data is not collected). Pre-CSD FP and HP responses can be seen (closely spaced downward deflections). CSD is seen as a large triphasic change in reflectance during which mapping is suppressed. A long period of post-CSD hypoperfusion is seen as an increase in reflectance, which takes ∼90 min to recover, after which deflections from evoked FP and HP mapping are visible. Note the decrease in amplitude of the FP deflection relative to HP, and both evoked deflections relative to pre-CSD. Unlike the baseline hypoperfusion, these evoked changes persist to the end of the experiment.
Physiological monitoring.
Temperature was monitored and maintained with a rectal probe and homeothermic blanket. A subset of animals (n = 4) underwent tracheotomy and ventilation with humidified air. Systemic hemoglobin saturation (SpO2) and partial pressure of end-tidal CO2 (PETCO2) were monitored. All systemic parameters remained within a physiologically normal range throughout the experiments (temperature, 36.9–37.2°C; heart rate, 296–350 beats per minute; respiration rate, 61–66 breaths per minute; SpO2, 88–96%; PETCO2, 3.6–5.0%), and there was no significant change during or after CSD (linear mixed-effects model with post hoc Tukey's test; p > 0.75 for all comparisons).
Sensory stimulation and CSD induction.
Stainless steel stimulating electrodes (A-M Systems) were placed in the glabrous skin of the forepaw (FP) and hindpaw (HP); return electrodes were inserted into the forelimbs and hindlimbs. Trials of alternating FP and HP stimulation were performed for 1–1.5 h, with each trial lasting 35–60 s. Either paw was stimulated at 5 Hz for 2 s, beginning 5 s after the start of each trial. Monopolar current pulses were 1.0 ms in duration and 1.0 mA in intensity. Stimulation occurred before and after CSD, which was induced by placing a single potassium chloride crystal at the edge of the cranial window. Residual potassium chloride was immediately washed from the cranial window with saline when spontaneous field potentials were eliminated (within 30–60 s after application).
Electrophysiology.
An eight-channel microfabricated planar platinum electrode array (Theriot, 2011) was used to detect evoked field potentials from somatosensory cortex. A stainless steel reference electrode was placed in the temporalis muscle. Field potentials were amplified 1000×, sampled at 1 kHz, bandpass filtered at 10–300 Hz, and notch filtered at 60 Hz. Summed evoked potentials (sEPs) (Fig. 1) were generated by summing all evoked discharges during the stimulation period and quantified by taking the magnitude of the negative peak of the summed waveform (Lauritzen, 2001). Spontaneous peaks [amplitude >5 standard deviations (SDs) from baseline] occurring during the 5 s prestimulus period for each trial were also sized and counted.
2dOS.
The cortex was epi-illuminated with white light from a voltage-regulated halogen source. Light reflected from the cortical surface was divided into four parallel paths (Fig. 2) by an image splitter (QuadView; Photometrics) and captured by a cooled CCD camera (PhotonMax 512-B; Princeton Instruments). Every 512 × 512 image contained four subimages, each filtered at 560, 568, 577, or 610 nm (± 5 nm). A single trial consisted of 30–50 s of imaging with a 5–10 s intertrial interval. Images were acquired at 2 Hz with an exposure time of 400 ms and 1.0× or 0.5× magnifications. The approximate pixel resolution of an image at 1.0× was 16 μm/pixel. Optical datasets consisted of interlaced FP and HP trials, each 60–100 frames. Changes in concentration of oxyhemoglobin (Δ[HbO2]), deoxyhemoglobin (Δ[HbR]), and total hemoglobin (Δ[HbT]) were determined by analyzing the registered multi-wavelength imaging data at each pixel using a modified Beer–Lambert law:
 |
where I0λ is the prestimulus light reflectance for wavelength λ and Iλ(t) is the reflectance at any pixel over the time course of each trial. In vitro phantom models (Sato et al., 2002; Sheth et al., 2004) were used to determine the wavelength-dependent absorption coefficients, αλ.
To generate hemoglobin moiety maps, the median value of all pixels in each frame was plotted, and the time point with the largest deviation from the prestimulus baseline was determined. The image corresponding to that time point was chosen to represent the peak level of activity for that dataset. This image was thresholded at 50% maximum response to generate the map. Time series of hemoglobin moiety change were generated from averaged pixels within the map. To compare hemodynamic and electrophysiological data, circular optical regions of interest (ROIs) were chosen to coincide with each electrode. The resulting time courses were typically monophasic, with a negative deflection for HbR or positive deflections for HbO2 and HbT (Fig. 2).
Data reduction and statistics.
Data were pooled into pre-CSD and post-CSD time bins, each 10 min in length. The pre-CSD time period is bin o. Post-CSD bins i–vi cover 60 min of post-CSD trials. The first trial with an sEP >50% of the maximum post-CSD response marked the beginning of bin i. Trial reductions for electrophysiological and optical datasets were identical.
Results in text are means ± SDs. Comparisons were made using a linear mixed-effects model. Variation between animals was treated as random. Differences between time bins were determined using a post hoc Tukey's test for multiple comparisons. Box plots are used to show data distributions: median, upper and lower quartiles, and range exclusive of outliers (data outside ±2.7 SDs from the mean of the group) are depicted. Data reduction and summary statistics were done using Matlab (MathWorks). Tests for significance were performed using R (R Language and Environment for Statistical Computing, http://www.r-project.org).
Results
Spontaneous cortical activity is globally decreased after CSD
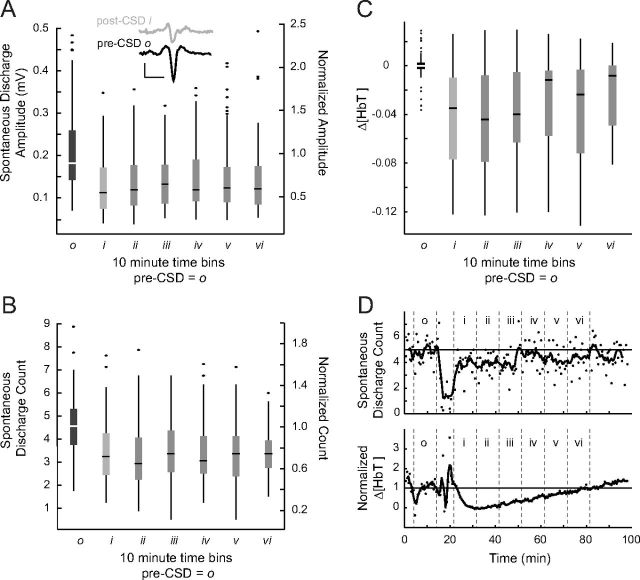
Prestimulus hemodynamic measures were taken over exposed cortex adjacent to each electrode (Fig. 2A). Baseline hemodynamic and field potential measures were homogeneous across the array; although there were large changes in all locations after CSD, there was no significant difference between locations (linear mixed-effects model with post hoc Tukey's test; p > 0.75 for all comparisons). There was a long-lasting hypoperfusion after CSD that returned to baseline within 60–90 min. Consistent with previous reports (Piilgaard and Lauritzen, 2009; Chang et al., 2010), there was no significant difference in HbT from baseline at 80 min post-CSD; three of four animals with post-CSD recordings ≥70 min recovered to baseline. Spontaneous electrical activity was undetectable for 7.6 ± 4.2 min after the CSD wave. Afterward, both the frequency and amplitude of spontaneous discharges were significantly lower than before CSD, returning to baseline with approximately the same kinetics as HbT (no significant difference in spontaneous discharge count from baseline at 80 min post-CSD; four of four animals with post-CSD recordings ≥70 min recovered to baseline) (Figs. 2B, 3).
Figure 3.
Reductions in spontaneous activity after CSD. A, B, For pre-CSD and post-CSD time bins (n = 11), spontaneous discharges are sized (A) and counted (B) during the 5 s prestimulus period for all trials. On secondary axis, data are normalized to the pre-CSD mean of all animals (central line, box, and whiskers represent median, quartiles, and range, respectively). Two spontaneous discharges are shown in inset. Pre-CSD and post-CSD discharge waveforms are similar in shape (triphasic) yet smaller in amplitude. Inset calibration bars: 0.1 mV, 20 ms. For spontaneous discharge amplitudes and counts, all post-CSD time bins were significantly smaller than the pre-CSD period (p < 0.001). However, in longer-duration experiments, both amplitudes and counts returned to baseline (see Results and D). C, Prestimulus HbT values from the same experiments and time periods as A and B. All post-CSD time bins were significantly smaller than the pre-CSD time period (p < 0.001) but show a clear trend toward recovery, which was demonstrated in longer-duration experiments (see Results and D). D, Spontaneous discharge counts and prestimulus HbT from a longer-duration experiment show recovery of these variables to baseline values.
Limb-dependent modulation of sensory maps after CSD
Evoked activity was also suppressed during and immediately after the passage of CSD, taking 5.1 ± 2.5 min to reach an amplitude greater than the half-maximum of all post-CSD responses. In contrast to the global suppression of spontaneous electrical activity, evoked responses either increased or decreased in amplitude after CSD, depending on the electrode location and which stimulus (FP or HP) was presented. Figure 4A shows a histogram of the ratio of post-CSD (bin i) to pre-CSD (bin o) amplitude for spontaneous and evoked activity over all electrodes. Unlike spontaneous activity, whose post/pre-CSD amplitude ratio never exceeded unity, sEP activity showed a post-CSD amplitude increase in 18.8% of electrodes during FP stimulation and 34.1% of electrodes during HP stimulation. Six of 11 animals during FP stimulation and 10 of 11 animals during HP stimulation had at least one electrode that recorded higher post-CSD i amplitudes.
Figure 4.
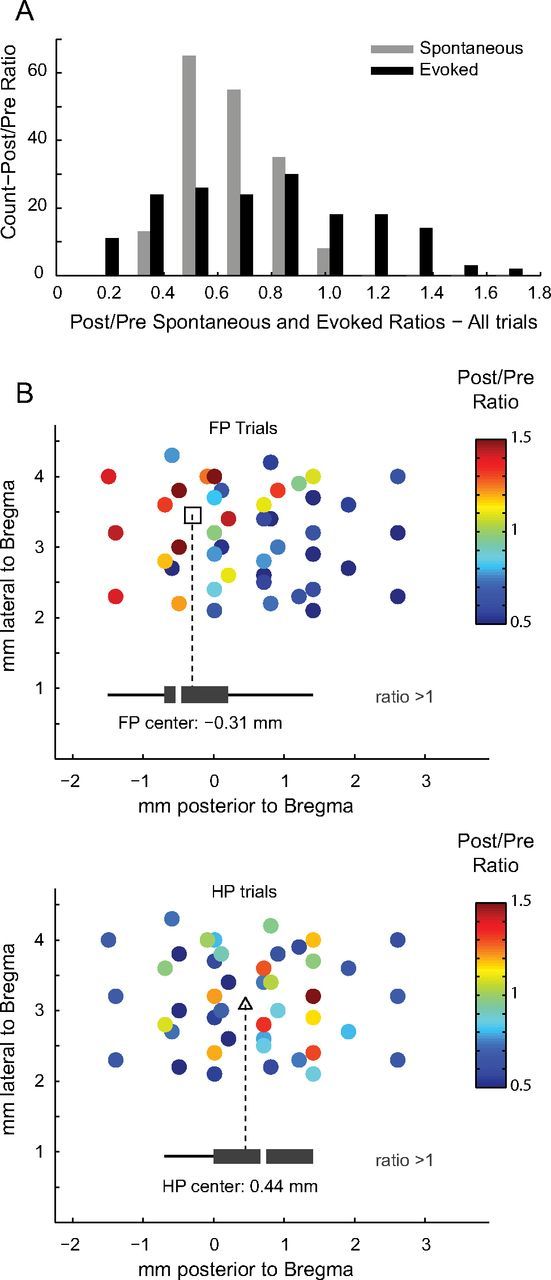
Evoked activity is potentiated in the location of cortical sensory maps. A, Histogram shows ratio of post/pre-CSD amplitude for spontaneous (gray) versus evoked (black) electrical activity. Post-CSD spontaneous activity is never greater than pre-CSD activity; therefore, the spontaneous post/pre-CSD ratio stays at or below unity. Conversely, evoked activity exhibits both an increase (ratio >1) and decrease (ratio <1) in post-CSD amplitudes. B, Scatter plots of the location of each electrode (rats with known location of bregma, n = 6) show the spatial distribution of post/pre-CSD modulation of evoked activity. Potentiated electrodes grouped (black box plots) into two distinct anteroposterior locations (open square, FP center; open triangles, HP center) (Student's unpaired t test, p = 0.011) that correspond to known FP and HP map anatomy. Mediolateral narrowness of the cranial window impaired mapping in that direction, which is why lateral separation was not measured.
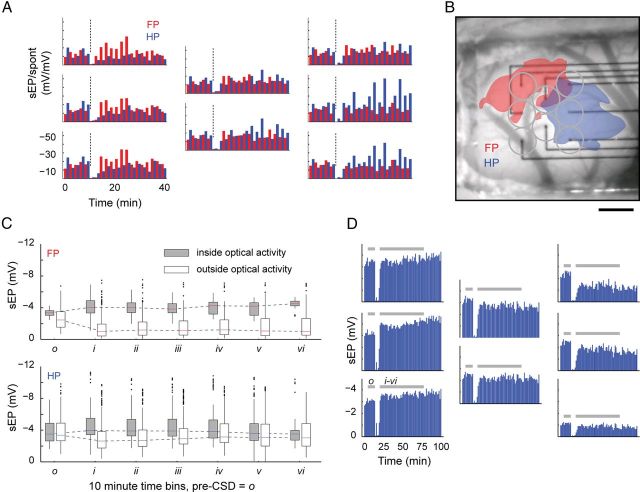
The locations of potentiated electrodes varied by stimulus (Fig. 4B, Fig. 5A). When FP was stimulated, potentiated electrodes corresponded to the anatomical location of FP cortex; when HP was stimulated, potentiated electrodes were located in HP cortex (Franklin and Paxinos, 1997). In other words, the same electrode could show either increased or decreased sEP amplitudes, depending on which stimulus was presented.
Figure 5.
Limb-dependent modulation of sensory maps after CSD. A, B, Bar plots arranged in the layout of the electrode array show the time course of alternating FP (red) and HP (blue) sEP activity for an individual animal. CSD induction is marked by a dashed line. Electrodes positioned within the optical boundaries (B) of HP activation show a marked increase in the post-CSD sEP amplitude, whereas the same electrodes show a suppression of activity during FP stimulation. A similar pattern of activity, but reversed, can be seen on electrodes situated primarily within the boundaries of FP activation. For each stimulus modality, potentiated electrodes consistently fell within the boundaries of their area of half-maximum Δ[HbT] maps. Scale bar, 1 mm. C, To confirm this, electrodes from all experiments were grouped by optical boundaries of activity, regardless of whether they were potentiated. For electrodes located inside Δ[HbT] maps, the difference between pre-CSD o and post-CSD i–v reached significance for FP and HP stimulation (both p < 0.001; exceptions: HP o/v, p = 0.955; HP o/vi, p = 0.009; FP o/vi, p = 0.019). For electrodes located outside Δ[HbT] maps, the difference between pre-CSD o and post-CSD i–vi also reached significance for FP and HP stimulation (FP, p < 0.001; HP, p < 0.01; exceptions: HP o/iv, p = 0.210). Inside FP Δ[HbT] maps, no difference was seen between any post-CSD time period, suggesting that the effects of CSD were long lasting. Inside HP Δ[HbT] maps, there was also no difference between post-CSD time bins with the exception of bin v being significantly different from bins i–vi (p < 0.001). For any CSD time period, samples (n) are taken from each electrode within the boundaries of Δ[HbT] maps, for each animal, and for all trials within that time period (inside optical activity: FP bin o–iii, n = 93; bin iv–v, n = 55; bin vi, n = 32; HP bin o, n = 191; bins i–iii, n = 197; bins iv–v, n = 166; bin vi, n = 116; outside optical activity: FP bins o–vi, n > 263; HP bins o–vi, n > 179). D, sEP traces from one of four experiments with ≥70 min of post-CSD recording, showing persistence of both potentiation and suppression to the end of the experiment, ∼80 min after CSD passage. All four long experiments showed this finding, which is in contrast to the recovery of spontaneous activity after CSD. Shading shows timing of pre-CSD bin o and post-CSD bins i–vi for comparison with pooled results in C.
Hemoglobin maps allow an independent measure of the boundaries of evoked cortical activity (Fig. 5B). We used post-CSD i Δ[HbT] maps to test whether an electrode would show potentiation. There was a significantly greater likelihood that potentiated electrodes were located within the boundaries of hemodynamic maps and, conversely, that the suppressed electrodes were located outside map boundaries. Δ[HbT] maps predicted potentiated electrodes correctly 89% of the time for FP (6% false positive, 5% false negative) and 86% of the time for HP (6% false positive, 8% false negative; Fisher's exact test, two tailed: p = 3.9 × 10⁻⁷ and p = 3.0 × 10⁻⁷ for FP and HP, respectively).
We used Δ[HbT] map classification to further examine electrode behavior over time. Electrodes within hemodynamic maps showed a significant increase in sEP amplitude and those outside a significant decrease, which lasted at least 60 min after passage of CSD. The change in electrode behavior (potentiation or suppression to either FP or HP stimulation) was preserved in the majority of electrodes for the whole duration of even the longest experiments (Fig. 5C,D). For experiments (n = 4) with 70 min or more of post-CSD recording, 2 of 11 potentiated electrodes and 0 of 47 suppressed electrodes recovered to baseline values. Moreover, amplitude of potentiated and suppressed electrodes remained significantly different from baseline at 80 min after CSD (p < 0.001 for each, linear mixed-effects model with post hoc Tukey's test).
Decreased sensory adaptation after CSD
Somatosensory responses typically depress on repetitive train stimulation, and this sensory adaptation can be modulated by changes in network activity (Moore, 2004). In contrast to the adaptation seen before CSD, there was a relative maintenance of evoked potential amplitude throughout the train after CSD (Fig. 6). Although there was no difference in the amplitude of the first evoked potential before and after CSD, evoked potentials 2–10 were significantly increased in amplitude compared with the pre-CSD period, and most maintained the increase in amplitude for the duration of even the longest experiments (11 of 14 electrodes in 4 experiments with post-CSD recordings ≥70 min).
Figure 6.
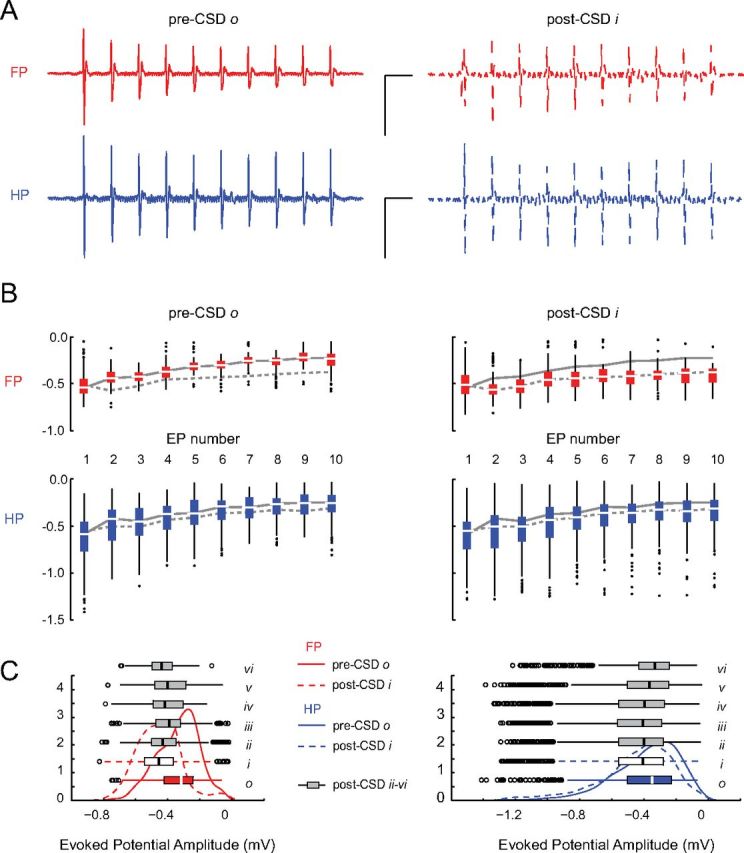
Blunted sensory adaptation after CSD. A, Evoked potential (EP) trains are shown for pre-CSD and post-CSD single trials of FP and HP stimulation in an individual animal. Before CSD, there is an attenuation of EP amplitude over the duration of the train. This sensory adaptation is reduced after CSD. Calibration: 1 mV, 200 ms. B, Significant decrease in sensory adaptation for all experiments. For all animals, box plots of EP amplitudes are shown with the median amplitude of individual EP throughout the response train for both pre-CSD o (solid) and post-CSD i (dashed) time periods. There was no significant difference in the size of the first evoked potential (EP 1) between pre-CSD o and post-CSD i time periods for either FP (p = 0.998) or HP (p = 0.726) stimulation. All other evoked potentials in the post-CSD i response train (EPs 2–10) were significantly larger than pre-CSD o (p < 0.001). C, Persistence of sensory adaptation changes. Probability density plots and box plots show the significant increase in number of high-amplitude-evoked responses (left-shifted curves) during all post-CSD periods for both stimulus modalities (FP o/i–vi, p < 0.001; HP o/i–iv, p < 0.001; HP o/v, p = 0.28; HP o/vi, p = 0.02). Samples (n) were taken from each electrode within the boundaries of Δ[HbT] maps, for each animal, and for all trials within the relevant time period [for individual EP (B): FP bin o–i, n = 93; HP bin o, n = 191; bin i, n = 197; for all 10 EPs (C): FP bin o–iii, n = 930; bin iv–v, n = 550; bin vi, n = 320; HP bin o, n = 1910; bins i–iii, n = 1970; bins iv–v, n = 1660; bin vi, n = 1160; outside optical activity: FP bins o–vi, n > 2630; HP bins o–vi, n > 1790]. All data are from electrodes classified as within the boundaries of Δ[HbT] activation maps.
Sharpening of evoked potential and hemodynamic maps after CSD
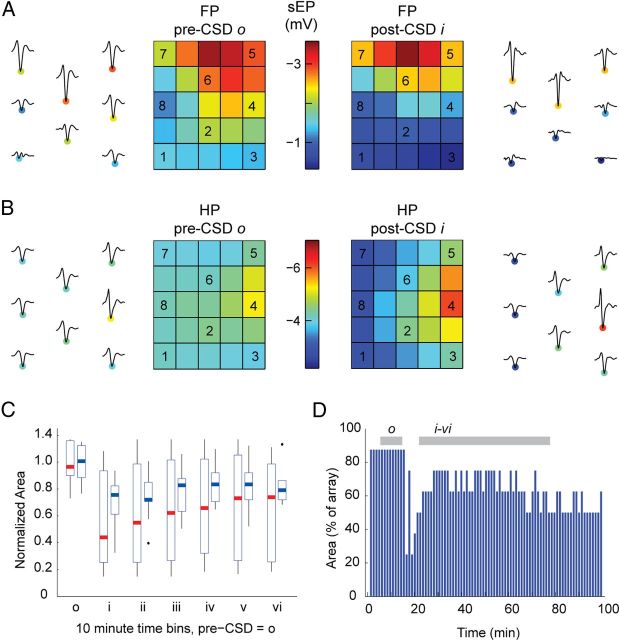
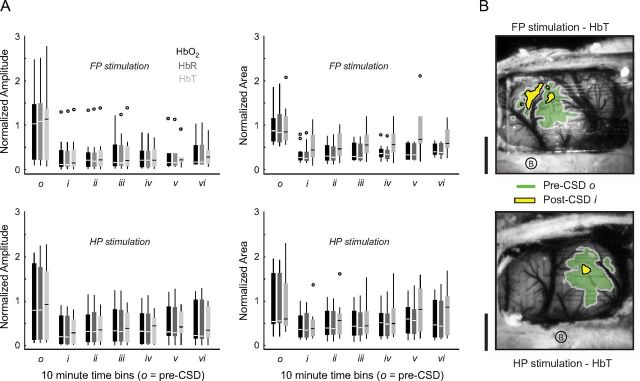
Cortical sensory-map sharpening (defined as a reduction in the area of an evoked response) (Feldman and Brecht, 2005) has been observed in sensory plasticity paradigms (Prakash et al., 1996; Polley et al., 2004). Sharpening was seen in both electrophysiological and hemodynamic maps after CSD. To quantify electrophysiological sharpening, electrodes that responded within 50% of the maximum response for a particular stimulus were counted. Between pre-CSD o and post-CSD i time periods, there was a 42.9 and 29.3% reduction in the number of electrodes that were within half-height of the maximum response, for FP (10 of 11 animals) and HP (11 of 11 animals), respectively (Fig. 7). The area at half-height of post-CSD hemodynamic maps was also reduced. The reduction in sensory-map area occurred for both stimulus modalities and all hemodynamic signals and was approximately concentric to maps of pre-CSD vascular activity (Fig. 8). Both hemodynamic and electrophysiological sharpening persisted in long-duration experiments (maps continued to have a reduced area after >70 min, four of four experiments).
Figure 7.
Electrophysiological map potentiation and sharpening after CSD. A, B, sEP waveforms from individual animals are shown adjacent to interpolated images of sEP amplitudes for the pre-CSD o and post-CSD i time periods: A shows a representative FP recording, and B shows an HP recording from a different animal. Center electrodes are potentiated, whereas the amplitude suppression in surround electrodes leads to a sharpening of the map. Overall, during FP and HP stimulation, respectively, 6 of 11 and 10 of 11 animals had at least one electrode that recorded higher post-CSD i amplitudes; 10 of 11 and 11 of 11 animals showed map sharpening. C, Box plots show FP (red) and HP (blue) normalized field potential map areas. Maps remain sharpened through 60 min after CSD for all experiments. D, Map area traces from one of four experiments with ≥70 min of post-CSD recording, showing persistent sharpening to the end of the experiment. All four long experiments showed this finding. Shading shows timing of pre-CSD bin o and post-CSD bins i–vi for comparison with pooled results in C.
Figure 8.
Hemoglobin map sharpening after CSD. A, Hemoglobin response amplitudes (left) were significantly reduced for all moieties regardless of whether FP (top) or HP (bottom) was stimulated (both FP and HP: o/i–iii, p < 0.001; o/iv–v, p < 0.01; o/vi, p < 0.05). Area of activation (right) was significantly reduced for all moieties for both stimulus modalities (both FP and HP: o/i–vi, p < 0.001; HP, o/vi, p = 0.003). Data are normalized to pre-CSD o. B, Map contours (area at half-maximum response) are drawn for pre-CSD o and post-CSD i HbT activity, for two different animals. Post-CSD responses were uniformly concentric to the pre-CSD map, with significantly reduced area and amplitude. Scale bar, 1 mm.
Attenuated hemodynamic response and neurovascular coupling after CSD
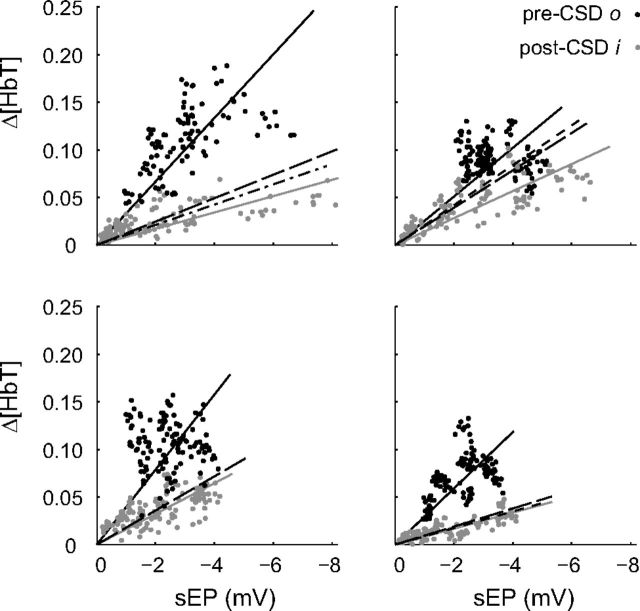
We measured the hemoglobin response amplitude within FP and HP maps. In contrast to evoked potential data, Δ[HbO2], Δ[HbR], and Δ[HbT] all exhibited a global suppression of evoked response amplitude after CSD (Fig. 8). In contrast to baseline (prestimulus) hemodynamic signals (Figs. 2B, 3D), evoked hemoglobin responses remained suppressed for the duration of even the longest experiments. Comparison of evoked potentials with hemoglobin responses from ROIs immediately adjacent to electrodes revealed a reduced slope in the evoked neurovascular coupling relationship (Fig. 9).
Figure 9.
Altered neurovascular coupling after CSD. Pre-CSD and post-CSD neurovascular coupling response curves for four individual animals. Each data point represents a single optical ROI/electrode pair for both FP and HP stimulations (5 Hz, 2 s, 1 mA) and for each trial during their respective time bins. Post-CSD i sEP activity showed both increases and decreases in response amplitude relative to pre-CSD o. Δ[HbT] activity was consistently lower after CSD. Solid lines represent a linear fit of pre-CSD (black) and post-CSD i (gray) data through zero. Long-dash, dot-dash, and short-dash black lines, respectively, represent linear fits of the post-CSD iii, v, and vi time periods (data points not shown for clarity). For animals, all post-CSD i slopes were significantly different from pre-CSD o (p < 0.001, analysis of covariance; m indicates slope; top left: o, m = −0.03, R2 = 0.89, i, m = −0.01, R2 = 0.77; top right: o, m = −0.03, R2 = 0.89; i, m = −0.01, R2 = 0.87; bottom left: o, m = −0.04, R2 = 0.84; i, m = −0.02, R2 = 0.87; bottom right: o, m = −0.03, R2 = 0.90; i, m = −0.01, R2 = 0.88).
Discussion
Beyond the aura, the migraine attack involves alterations in sensory perception. CSD, the proposed mechanism of the migraine aura, is brief but leads to long-lasting changes in cortical perfusion, metabolism, and electrical response (Piilgaard and Lauritzen, 2009; Chang et al., 2010). We reasoned that CSD might alter sensory processing, in ways that might explain the sensory symptoms of a migraine attack.
Limb-dependent potentiation and suppression of evoked potential responses
We observed a long-lasting increase in receptive field center and decrease in surround amplitude in response to paw stimulation. These sensory-map-specific changes in evoked potential amplitude persisted longer than whole-field hemodynamic and electrophysiological changes (Piilgaard and Lauritzen, 2009; Chang et al., 2010) (Figs. 2B, 3D), suggesting that their mechanisms were distinct. Such long-lasting alterations resemble synaptic plasticity phenomena, such as long-term potentiation (LTP) and long-term depression (LTD) (Bliss and Lomo, 1973; Malenka and Bear, 2004).
Changes consistent with both LTP and LTD have been induced by CSD in slice models (Footitt and Newberry, 1998; Berger et al., 2008); both potentiation and suppression of evoked responses have been observed in different in vivo studies (Guiou et al., 2005; Piilgaard and Lauritzen, 2009; Faraguna et al., 2010; de Souza et al., 2011). Our results reconcile these apparently contradictory findings by showing that potentiation and suppression depend on location relative to stimulated receptive field. Classical LTP and LTD can also be induced in somatosensory neocortex in vivo (Foeller and Feldman, 2004). The simultaneous potentiation of center responses and suppression of surround responses might be explained by heterosynaptic LTD, which is induced in inactive neurons whose neighbors undergo LTP (Buonomano and Merzenich, 1998).
Purely neural mechanisms may not be the only explanation for changes in evoked potential amplitude after CSD. Astrocytes also undergo depolarization and calcium activity during CSD (Sugaya et al., 1975; Chuquet et al., 2007), and they contribute to synaptic plasticity in vitro and in vivo (Halassa and Haydon, 2010). Astrocytic release of glutamate, K+, ATP, and neuromodulators could favor excitatory transmission on arrival of sensory impulses. Indeed, astrocytic release of d-serine is essential to hippocampal LTP (Henneberger et al., 2010). Alternatively, the metabolic challenge of CSD and its aftermath might impair astrocytic reuptake of glutamate and K+ from the extracellular space, once again favoring excitatory transmission.
Sharpening of electrical and hemodynamic maps after CSD
We observed a post-CSD reduction in the area of evoked electrophysiological and hemodynamic FP and HP maps, which (like evoked potential amplitude changes) persisted beyond the recovery of previously characterized post-CSD changes. To the best our knowledge, sensory-map sharpening has not been reported after CSD. However, it is frequently seen in sensory plasticity paradigms, such as environmental enrichment (Polley et al., 2004) and sensory deprivation (Foeller et al., 2005). Importantly, sharpening is seen on short timescales: a prominent example of this is the sharpening of sensory maps on arousal (Ferezou et al., 2006).
The decreases in surround amplitude that cause sharpening could be caused by synaptic plasticity mechanisms resembling LTD. They could also be explained by an increase in surround inhibition in proportion to center potentiation after CSD. Inhibitory sharpening is a known mechanism of plasticity after sensory deprivation (Foeller et al., 2005). Moreover, such plasticity is possible on the short timescales we observed: significant changes in the IPSP/EPSP ratio have been seen in lateral interactions <1 h after a peripheral sensory lesion (Hickmott and Merzenich, 2002).
Hemodynamic sensory maps also show sharpening on both acute and chronic timescales (Prakash et al., 1996; Polley et al., 2004), and we observed a dramatic sharpening of hemoglobin maps after CSD. It could be argued that this sharpening could be attributable to the attenuation in evoked hemodynamic response: a reduced amplitude response would be expected to have a smaller footprint. Although we cannot rule out this possibility, we suspect that the reduction in area of activation in our hemodynamic maps is a reflection of electrophysiological sharpening.
Reduction in sensory adaptation after CSD
After CSD, we observed a sustained attenuation of the normal decremental response of somatosensory cortex to repetitive stimulation. As with sensory-map sharpening, sensory adaptation changes have not been shown previously after CSD, but they make sense in the context of known mechanisms of sensory plasticity.
Adaptation to repetitive stimuli is a fundamental response of sensory cortices; its role appears to be the modulation of gain (Chung et al., 2002; Castro-Alamancos, 2004; Moore, 2004). Cellular mechanisms of sensory adaptation are incompletely understood, but for rodent somatosensory cortex short-term synaptic depression is involved (Chung et al., 2002; Heiss et al., 2008). We recorded from the cortical surface, which makes it most likely that we sampled synaptic activity generated in layers I–III, and our observations are consistent with the adaptation shown in layer II/III neurons to somatosensory stimulation (Ahissar et al., 2001; Chung et al., 2002).
Altered inhibition might also contribute to adaptation changes after CSD. Paired-pulse inhibition is attenuated after CSD (Krüger et al., 1996), and the inhibitory component of transcallosal evoked potentials is reduced in amplitude (Piilgaard and Lauritzen, 2009). However, adaptation is not modified by bicuculline (Nelson, 1991) or accompanied by changes in membrane potential or input resistance (Chung et al., 2002), suggesting that inhibition may not play a major role.
Alternative explanations of post-CSD changes
CSD causes massive disruptions in perfusion, metabolism, neurovascular coupling, and even tissue structure (Piilgaard and Lauritzen, 2009; Chang et al., 2010). It is reasonable to infer that the sensory-evoked changes we observe might be artifacts of these underlying alterations. Although it is clear that neural activity and the structural/metabolic milieu are intertwined, we suspect that our observations must rely (at least in part) on neural plasticity. The most important reason is the specificity of our responses. Post-CSD changes in perfusion, metabolism, tissue swelling, direct current potential, and spontaneous electrical activity are global in nature. In striking contrast, the changes in our evoked sensory responses are spatially, temporally, and modality specific. It is difficult to explain these effects based on pan-cortical changes in perfusion, astrocytic function, or tissue structure and resistivity (Makarova et al., 2008). A second reason is the nature of the changes in sensory response. Potentiation, suppression, sharpening, and adaptation are all known mechanisms of plasticity in sensory systems (Malenka and Bear, 2004; Moore, 2004; Feldman and Brecht, 2005), whose substrates are incontrovertibly neural and which occur independent of CSD. Finally, the kinetics of the evoked changes we observe appear different from our measures of spontaneous activity [which are comparable with previously measured post-CSD changes (Piilgaard and Lauritzen, 2009; Chang et al., 2010)]; potentiation, suppression, sharpening, and adaptation persist beyond the recovery of spontaneous hemodynamic and electrophysiological activity.
Comparison with sensory alterations in migraine
The migraine attack is defined by noxious sensory amplification (International Headache Society Classification Subcommittee, 2004; Lipton et al., 2008). Previous studies in animal models have shown how alterations in subcortical excitability, particularly in trigeminal ganglion (TG), trigeminal nucleus caudalis (TNC), and thalamus, might contribute to the enhanced sensitivity of the migraine attack (Strassman et al., 1996; Burstein and Jakubowski, 2004; Burstein et al., 2010; Noseda et al., 2010; Zhang et al., 2010, 2011; Lambert et al., 2011). Our work shows how migraine-related sensory amplification might be caused by mechanisms of plasticity in the sensory cortex. It also suggests how post-CSD cortical plasticity might explain alterations in excitability of lower structures, with cortex directly modulating TNC and thalamus activity through corticofugal connections (Noseda et al., 2010). Although speculative, this is an appealing explanation because TG and TNC do not typically demonstrate significant plasticity in adult animals. In contrast, the cortex, and to a lesser extent the thalamus, retain plasticity during adulthood (Foeller and Feldman, 2004; Feldman and Brecht, 2005), and corticothalamic networks can respond to stimuli with state- and gain-changing output within seconds (Nicolelis and Fanselow, 2002).
Given the common anatomical and functional features of primary sensory cortices (Markram, 2010), our observations are likely generalizable beyond limb sensation, to facial sensation, hearing, and vision. The fact that we elicited similar responses in two different limb cortices (one used for exploration, the other much less so) is strong evidence that other sensory regions might show a similar response.
Finally, because our experiments use naturalistic sensory stimulation, they are directly comparable with human work using non-invasive imaging and electrophysiological techniques. Interestingly, a recent magnetoencephalography study shows potentiation of the P100m response in patients with persistent aura, a finding completely consistent with our results (Chen et al., 2011).
Conclusions
We used naturalistic stimulation and distributed optical and electrical recordings in vivo to demonstrate that CSD, the proposed mechanism of the migraine aura, induces cortical plasticity mechanisms that could explain the sensory alterations of the migraine attack.
Footnotes
This work was supported by a National Science Foundation Integrative Graduate Education and Research Traineeship (J.J.T.), National Institutes of Health Grants R01 MH52083 (A.W.T.), NS059072, and NS070084, and the National Institutes of Health Loan Repayment Program (K.C.B.).
The authors declare no competing financial interests.
References
- Ahissar E, Sosnik R, Haidarliu S. Transformation from temporal to rate coding in a somatosensory thalamocortical pathway. Nature. 2000;406:302–306. doi: 10.1038/35018568. [DOI] [PubMed] [Google Scholar]
- Ahissar E, Sosnik R, Bagdasarian K, Haidarliu S. Temporal frequency of whisker movement. II. Laminar organization of cortical representations. J Neurophysiol. 2001;86:354–367. doi: 10.1152/jn.2001.86.1.354. [DOI] [PubMed] [Google Scholar]
- Berger M, Speckmann EJ, Pape HC, Gorji A. Spreading depression enhances human neocortical excitability in vitro. Cephalalgia. 2008;28:558–562. doi: 10.1111/j.1468-2982.2008.01556.x. [DOI] [PubMed] [Google Scholar]
- Bliss TV, Lomo T. Long-lasting potentiation of synaptic transmission in the dentate area of the anaesthetized rabbit following stimulation of the perforant path. J Physiol. 1973;232:331–356. doi: 10.1113/jphysiol.1973.sp010273. [DOI] [PMC free article] [PubMed] [Google Scholar]
- Buonomano DV, Merzenich MM. Cortical plasticity: from synapses to maps. Annu Rev Neurosci. 1998;21:149–186. doi: 10.1146/annurev.neuro.21.1.149. [DOI] [PubMed] [Google Scholar]
- Burstein R, Jakubowski M. Analgesic triptan action in an animal model of intracranial pain: a race against the development of central sensitization. Ann Neurol. 2004;55:27–36. doi: 10.1002/ana.10785. [DOI] [PubMed] [Google Scholar]
- Burstein R, Jakubowski M, Garcia-Nicas E, Kainz V, Bajwa Z, Hargreaves R, Becerra L, Borsook D. Thalamic sensitization transforms localized pain into widespread allodynia. Ann Neurol. 2010;68:81–91. doi: 10.1002/ana.21994. [DOI] [PMC free article] [PubMed] [Google Scholar]
- Castro-Alamancos MA. Absence of rapid sensory adaptation in neocortex during information processing states. Neuron. 2004;41:455–464. doi: 10.1016/s0896-6273(03)00853-5. [DOI] [PubMed] [Google Scholar]
- Chang JC, Shook LL, Biag J, Nguyen EN, Toga AW, Charles AC, Brennan KC. Biphasic direct current shift, hemoglobin desaturation, and neurovascular uncoupling in cortical spreading depression. Brain. 2010;133:996–1012. doi: 10.1093/brain/awp338. [DOI] [PMC free article] [PubMed] [Google Scholar]
- Charles A, Brennan K. Cortical spreading depression-new insights and persistent questions. Cephalalgia. 2009;29:1115–1124. doi: 10.1111/j.1468-2982.2009.01983.x. [DOI] [PMC free article] [PubMed] [Google Scholar]
- Chen WT, Lin YY, Fuh JL, Hämäläinen MS, Ko YC, Wang SJ. Sustained visual cortex hyperexcitability in migraine with persistent visual aura. Brain. 2011;134:2387–2395. doi: 10.1093/brain/awr157. [DOI] [PubMed] [Google Scholar]
- Chung S, Li X, Nelson SB. Short-term depression at thalamocortical synapses contributes to rapid adaptation of cortical sensory responses in vivo. Neuron. 2002;34:437–446. doi: 10.1016/s0896-6273(02)00659-1. [DOI] [PubMed] [Google Scholar]
- Chuquet J, Hollender L, Nimchinsky EA. High-resolution in vivo imaging of the neurovascular unit during spreading depression. J Neurosci. 2007;27:4036–4044. doi: 10.1523/JNEUROSCI.0721-07.2007. [DOI] [PMC free article] [PubMed] [Google Scholar]
- de Souza TK, e Silva MB, Gomes AR, de Oliveira HM, Moraes RB, de Freitas Barbosa CT, Guedes RC. Potentiation of spontaneous and evoked cortical electrical activity after spreading depression: in vivo analysis in well-nourished and malnourished rats. Exp Brain Res. 2011;214:463–469. doi: 10.1007/s00221-011-2844-3. [DOI] [PubMed] [Google Scholar]
- Faraguna U, Nelson A, Vyazovskiy VV, Cirelli C, Tononi G. Unilateral cortical spreading depression affects sleep need and induces molecular and electrophysiological signs of synaptic potentiation in vivo. Cereb Cortex. 2010;20:2939–2947. doi: 10.1093/cercor/bhq041. [DOI] [PMC free article] [PubMed] [Google Scholar]
- Feldman DE, Brecht M. Map plasticity in somatosensory cortex. Science. 2005;310:810–815. doi: 10.1126/science.1115807. [DOI] [PubMed] [Google Scholar]
- Ferezou I, Bolea S, Petersen CC. Visualizing the cortical representation of whisker touch: voltage-sensitive dye imaging in freely moving mice. Neuron. 2006;50:617–629. doi: 10.1016/j.neuron.2006.03.043. [DOI] [PubMed] [Google Scholar]
- Foeller E, Feldman DE. Synaptic basis for developmental plasticity in somatosensory cortex. Curr Opin Neurobiol. 2004;14:89–95. doi: 10.1016/j.conb.2004.01.011. [DOI] [PubMed] [Google Scholar]
- Foeller E, Celikel T, Feldman DE. Inhibitory sharpening of receptive fields contributes to whisker map plasticity in rat somatosensory cortex. J Neurophysiol. 2005;94:4387–4400. doi: 10.1152/jn.00553.2005. [DOI] [PMC free article] [PubMed] [Google Scholar]
- Footitt DR, Newberry NR. Cortical spreading depression induces an LTP-like effect in rat neocortex in vitro. Brain Res. 1998;781:339–342. doi: 10.1016/s0006-8993(97)01359-0. [DOI] [PubMed] [Google Scholar]
- Franklin K, Paxinos G. The mouse brain in stereotaxic coordinates. San Diego: Academic; 1997. [Google Scholar]
- Guiou M, Sheth S, Nemoto M, Walker M, Pouratian N, Ba A, Toga AW. Cortical spreading depression produces long-term disruption of activity-related changes in cerebral blood volume and neurovascular coupling. J Biomed Opt. 2005;10:11004. doi: 10.1117/1.1852556. [DOI] [PubMed] [Google Scholar]
- Halassa MM, Haydon PG. Integrated brain circuits: astrocytic networks modulate neuronal activity and behavior. Annu Rev Physiol. 2010;72:335–355. doi: 10.1146/annurev-physiol-021909-135843. [DOI] [PMC free article] [PubMed] [Google Scholar]
- Heiss JE, Katz Y, Ganmor E, Lampl I. Shift in the balance between excitation and inhibition during sensory adaptation of S1 neurons. J Neurosci. 2008;28:13320–13330. doi: 10.1523/JNEUROSCI.2646-08.2008. [DOI] [PMC free article] [PubMed] [Google Scholar]
- Henneberger C, Papouin T, Oliet SH, Rusakov DA. Long-term potentiation depends on release of d-serine from astrocytes. Nature. 2010;463:232–236. doi: 10.1038/nature08673. [DOI] [PMC free article] [PubMed] [Google Scholar]
- Hickmott PW, Merzenich MM. Local circuit properties underlying cortical reorganization. J Neurophysiol. 2002;88:1288–1301. doi: 10.1152/jn.00994.2001. [DOI] [PubMed] [Google Scholar]
- International Headache Society Classification Subcommittee. International classification of headache disorders, 2nd edition. Cephalalgia. 2004;24(Suppl 1):9–160. doi: 10.1111/j.1468-2982.2003.00824.x. [DOI] [PubMed] [Google Scholar]
- Krüger H, Luhmann HJ, Heinemann U. Repetitive spreading depression causes selective suppression of GABAergic function. Neuroreport. 1996;7:2733–2736. doi: 10.1097/00001756-199611040-00065. [DOI] [PubMed] [Google Scholar]
- Lambert GA, Truong L, Zagami AS. Effect of cortical spreading depression on basal and evoked traffic in the trigeminovascular sensory system. Cephalalgia. 2011;31:1439–1451. doi: 10.1177/0333102411422383. [DOI] [PubMed] [Google Scholar]
- Lauritzen M. Relationship of spikes, synaptic activity, and local changes of cerebral blood flow. J Cereb Blood Flow Metab. 2001;21:1367–1383. doi: 10.1097/00004647-200112000-00001. [DOI] [PubMed] [Google Scholar]
- Lipton RB, Bigal ME, Ashina S, Burstein R, Silberstein S, Reed ML, Serrano D, Stewart WF American Migraine Prevalence Prevention Advisory Group. Cutaneous allodynia in the migraine population. Ann Neurol. 2008;63:148–158. doi: 10.1002/ana.21211. [DOI] [PMC free article] [PubMed] [Google Scholar]
- Makarova J, Gómez-Galán M, Herreras O. Variations in tissue resistivity and in the extension of activated neuron domains shape the voltage signal during spreading depression in the CA1 in vivo. Eur J Neurosci. 2008;27:444–456. doi: 10.1111/j.1460-9568.2008.06022.x. [DOI] [PubMed] [Google Scholar]
- Malenka RC, Bear MF. LTP and LTD: an embarrassment of riches. Neuron. 2004;44:5–21. doi: 10.1016/j.neuron.2004.09.012. [DOI] [PubMed] [Google Scholar]
- Markram H. Handbook of brain microcircuits. New York: Oxford UP; 2010. Microcircuitry of the neocortex. [Google Scholar]
- Moore CI. Frequency-dependent processing in the vibrissa sensory system. J Neurophysiol. 2004;91:2390–2399. doi: 10.1152/jn.00925.2003. [DOI] [PubMed] [Google Scholar]
- Nelson SB. Temporal interactions in the cat visual system. III. Pharmacological studies of cortical suppression suggest a presynaptic mechanism. J Neurosci. 1991;11:369–380. doi: 10.1523/JNEUROSCI.11-02-00369.1991. [DOI] [PMC free article] [PubMed] [Google Scholar]
- Nicolelis MA, Fanselow EE. Thalamocortical [correction of Thalamcortical] optimization of tactile processing according to behavioral state. Nat Neurosci [Erratum (2002) 5:7045] 2002;5:517–523. doi: 10.1038/nn0602-517. [DOI] [PubMed] [Google Scholar]
- Noseda R, Constandil L, Bourgeais L, Chalus M, Villanueva L. Changes of meningeal excitability mediated by corticotrigeminal networks: a link for the endogenous modulation of migraine pain. J Neurosci. 2010;30:14420–14429. doi: 10.1523/JNEUROSCI.3025-10.2010. [DOI] [PMC free article] [PubMed] [Google Scholar]
- Piilgaard H, Lauritzen M. Persistent increase in oxygen consumption and impaired neurovascular coupling after spreading depression in rat neocortex. J Cereb Blood Flow Metab. 2009;29:1517–1527. doi: 10.1038/jcbfm.2009.73. [DOI] [PubMed] [Google Scholar]
- Polley DB, Kvasnák E, Frostig RD. Naturalistic experience transforms sensory maps in the adult cortex of caged animals. Nature. 2004;429:67–71. doi: 10.1038/nature02469. [DOI] [PubMed] [Google Scholar]
- Prakash N, Cohen-Cory S, Frostig RD. Rapid and opposite effects of BDNF and NGF on the functional organization of the adult cortex in vivo. Nature. 1996;381:702–706. doi: 10.1038/381702a0. [DOI] [PubMed] [Google Scholar]
- Sato C, Nemoto M, Tamura M. Reassessment of activity-related optical signals in somatosensory cortex by an algorithm with wavelength-dependent path length. Jpn J Physiol. 2002;52:301–312. doi: 10.2170/jjphysiol.52.301. [DOI] [PubMed] [Google Scholar]
- Sheth SA, Nemoto M, Guiou M, Walker M, Pouratian N, Hageman N, Toga AW. Columnar specificity of microvascular oxygenation and volume responses: implications for functional brain mapping. J Neurosci. 2004;24:634–641. doi: 10.1523/JNEUROSCI.4526-03.2004. [DOI] [PMC free article] [PubMed] [Google Scholar]
- Somjen GG. Mechanisms of spreading depression and hypoxic spreading depression-like depolarization. Physiol Rev. 2001;81:1065–1096. doi: 10.1152/physrev.2001.81.3.1065. [DOI] [PubMed] [Google Scholar]
- Strassman AM, Raymond SA, Burstein R. Sensitization of meningeal sensory neurons and the origin of headaches. Nature. 1996;384:560–564. doi: 10.1038/384560a0. [DOI] [PubMed] [Google Scholar]
- Sugaya E, Takato M, Noda Y. Neuronal and glial activity during spreading depression in cerebral cortex of cat. J Neurophysiol. 1975;38:822–841. doi: 10.1152/jn.1975.38.4.822. [DOI] [PubMed] [Google Scholar]
- Theriot JJ. Los Angeles: University of California; 2011. Concurrent electrophysiology and optical neuro imaging for in vivo spatial mapping of neurovascular activity. PhD thesis. [Google Scholar]
- Zhang X, Levy D, Noseda R, Kainz V, Jakubowski M, Burstein R. Activation of meningeal nociceptors by cortical spreading depression: implications for migraine with aura. J Neurosci. 2010;30:8807–8814. doi: 10.1523/JNEUROSCI.0511-10.2010. [DOI] [PMC free article] [PubMed] [Google Scholar]
- Zhang X, Levy D, Kainz V, Noseda R, Jakubowski M, Burstein R. Activation of central trigeminovascular neurons by cortical spreading depression. Ann Neurol. 2011;69:855–865. doi: 10.1002/ana.22329. [DOI] [PMC free article] [PubMed] [Google Scholar]


