

Abstract
Gamma-band (25–90 Hz) peaks in local field potential (LFP) power spectra are present throughout the cerebral cortex and have been related to perception, attention, memory, and disorders (e.g., schizophrenia and autism). It has been theorized that gamma oscillations provide a “clock” for precise temporal encoding and “binding” of signals about stimulus features across brain regions. For gamma to function as a clock, it must be autocoherent: phase and frequency conserved over a period of time. We computed phase and frequency trajectories of gamma-band bursts, using time-frequency analysis of LFPs recorded in macaque primary visual cortex (V1) during visual stimulation. The data were compared with simulations of random networks and clock signals in noise. Gamma-band bursts in LFP data were statistically indistinguishable from those found in filtered broadband noise. Therefore, V1 LFP data did not contain clock-like gamma-band signals. We consider possible functions for stochastic gamma-band activity, such as a synchronizing pulse signal.
Introduction
The gamma-band of the local field potential (LFP) in many areas of cortex shows increased spectral power during stimulation (Gray et al., 1989; Logothetis et al., 2001; Pesaran et al., 2002; Gail et al., 2004; Henrie and Shapley, 2005). Theorists have proposed gamma activity enables different regions of the brain to communicate, e.g., to “bind” aspects of a stimulus (Gray et al., 1989; Buzsáki and Chrobak, 1995; Hopfield, 1995; Buzsáki, 2006; Fries et al., 2007; Cardin et al., 2009; Colgin et al., 2009; Traub and Whittington, 2010). Synchronization of neurons through gamma activity has been suggested to enhance response saliency as an attention mechanism (Fries et al., 2001). The ubiquitous nature of gamma activity in cortex and its malfunction in psychiatric disorders such as schizophrenia (Gonzalez-Burgos and Lewis, 2008) and autism (Wilson et al., 2007) have led some to claim that gamma may even be connected to consciousness (Uhlhaas et al., 2009). Most gamma-band synchronization studies have reported correlations or coherence between neuronal networks under different types of stimulation, but few have examined gamma activity for the control signal they claim is present.
Previously, gamma oscillations were thought to provide a regular temporal reference signal for the brain; we call this idea the “clock” theory of gamma activity. A clock signal would be autocoherent, meaning that it would have a stable temporal frequency and a consistent phase. By consistent phase, we mean that the phase at a single electrode remains within relatively narrow bounds over multiple periods of oscillation. Fries et al. (2007) proposed that gamma activity supplies a “temporal reference frame” in which the “precise spike timing” of individual spikes encodes information relative to the consistent phase of gamma activity. Multiple cycles of gamma oscillations would ensure redundancy for unambiguous information transmission (Fries et al., 2007). In vitro studies have investigated the possibility that networks of inhibitory neurons may provide a rhythmic temporal structure for synchronizing neurons (Whittington et al., 1995; Cardin et al., 2009; Traub and Whittington, 2010). Chattering cells and gap junctions have also been proposed as possible sources of regular gamma oscillations (Gray and McCormick, 1996; Mancilla et al., 2007). Several researchers have described how gamma activity can be used as a reference timing signal (Buzsáki and Chrobak, 1995; Hopfield, 1995; Whittington et al., 1995; Cardin et al., 2009).
In this study, we examined the general question of whether or not gamma activity can be used as a clock signal. The “clock” we refer to here is in the form of intrinsic damped autocoherent oscillations whose time scale is set by the internal dynamics of the cortical network. To test whether a clock was present in gamma activity in V1 cortex, we measured the distribution of the time scale and frequency of all damped gamma-band autocoherent bursts that could provide a timing signal. Then we compared the data with simulations of both random networks and with clock signals added to noise. The comparisons revealed that V1 did not generate clock-like gamma-band signals.
Materials and Methods
Methods overview.
To characterize bursting observed in the gamma-band of LFP data at each electrode, we simulated synthetic data using a Burst model, which contained autocoherent bursts (persistent bursts of gamma activity with a phase that remains within narrow bounds), and a Noise model, with bursts that occurred by chance. To produce the Noise model simulations, we simply phase-shuffled the empirical data acquired during stimulation. To generate the Burst model, we added bursts, whose parameters were fit to the data, to simulated spontaneous (no stimulation) LFPs. The distributions of the frequency and duration of autocoherent gamma bursts generated by simulations of both the Burst and Noise models were statistically compared with empirical distributions measured from V1 LFP data. Ideally, the empirical distributions from LFP data would differ significantly from the distributions generated by either the Burst model or Noise model simulations.
Crucially, we compared empirical and simulated distributions only in electrodes whose signal-to-noise characteristics provided a 90% sensitivity to detecting differences in the simulated noise and burst data. The particular measures we used to test for gamma bursts were the duration (time scale) and frequency of operationally defined short bursts of gamma activity above a prespecified threshold. To ensure that the power spectrum of the simulated data was identical to that of the empirical data, we generated simulated bursts that reproduced the excess gamma-band activity observed empirically.
Surgery and preparation.
Acute experiments were performed on two male adult Old World monkeys (Macaca fascicularis). All surgical and experimental procedures were performed in accordance with the guidelines of the U.S. Department of Agriculture and have been approved by the University Animal Welfare Committee at New York University. Details of surgical preparation and physiological monitoring are given in Burns et al. (2010). After surgery, the monkey was anesthetized and paralyzed with a continuous infusion of sufentanil citrate (6–18 μg · kg−1 · h−1, i.v.) and vecuronium bromide (0.1 mg · kg−1 · h−1, i.v.).
Electrophysiological recordings and data acquisition.
A Thomas seven-electrode system (Thomas Recording) was used to record simultaneously from multiple cortical sites in V1. The recording system we used has been described previously (Burns et al., 2010).
Visual stimulation.
Once all seven electrodes were located in V1 cortex, an experiment was run with drifting sinusoidal gratings [at high contrast (0.8), spatial frequency 2 cycle/deg, temporal frequency 4 Hz] that covered the visual fields of all the recording sites. The stimulus was drifted in 18 different directions between 0 and 360° in 20° steps. The stimulus in each condition was presented for 2 or 4 s, repeated between 25 and 50 times depending on the experiment.
Burst model parameters.
A gamma-band “bump” in the power spectrum can be caused by broadband stationary gamma noise (Noise model) or by discrete packets of autocoherent gamma bursts (Burst model). In the Burst model, the characteristic frequency and time scale of the autocoherent bursts were fit to the properties of the data. Autocoherent bursts in the Burst model had the functional form of a plane wave enveloped by a Gaussian,
at each recording site. The frequency, ω0, time scale, σ, and amplitude, A, were fit to the features of the gamma-band “bump” in the measured difference spectrum (stimulated power − spontaneous power) of the data. The frequency of the bursts, ω0, was set to the peak gamma-band frequency of the data (35–55 Hz). The fact that the Fourier transform of a Gaussian is a Gaussian was exploited to determine the time scale of the bursts. The Fourier transform of the burst function, Equation 1, is
 |
The σ on the right hand side of Equation 2 was estimated by fitting a Gaussian function to the gamma-band “bump” of the difference spectrum. This spectrally estimated σ from Equation 2 is the same σ found in Equation 1: the time scale of the burst in the time domain. In the Burst model, the broadening of the gamma-band “bump” in the power spectrum is inversely related to the length of discrete packets of gamma bursts (shorter bursts generate a broader gamma-band “bump”; longer bursts generate a narrower gamma-band “bump”). Matching the time scale or duration of these bursts to power in the gamma-band “bump” enabled us to reproduce the empirical power spectrum using synthetic bursts.
For each Burst model realization, a random of number of bursts were added with the condition that they did not overlap. The burst lengths were allowed to vary by ±50% of the value given by σ, and the amplitudes of each burst were drawn randomly from the distribution of bursts seen in the data. Parseval's theorem (Bracewell, 1999) was used to set the summed variance, or “energy,” of the burst time course to equal the integrated power of the difference spectrum. Each Burst model realization was created by summing background noise, generated by assigning random phases to the Fourier amplitude spectrum of the spontaneous activity and taking the inverse transform, with the simulated burst time course with parameters fit to the difference spectrum. This procedure generated a Burst model whose power spectrum matched that of stimulated data in the gamma-band.
Continuous Gabor transform.
A time-frequency analysis was used to examine the evolution of LFP phase. The continuous Gabor transform (CGT) (Mallat, 2009) was chosen over a wavelet transform because the CGT expresses the spectrum in terms of frequency rather than scale. Here, a time resolution of 50 ms was used, resulting in a frequency resolution of 25 Hz according to the CGT uncertainty principle (dt df = 4/π).
Phase portraits and phase rotation.
The CGT complex time series at each frequency could be plotted as a phase portrait (in polar coordinates) that tracked the time evolution of the oscillation. The instantaneous phase at each time step was computed with respect to the time at the center of the Gabor filter. For autocoherent oscillations to be localized in the phase portraits, the local phases must be rotated to a reference time. This procedure has been described previously (Burns et al., 2010).
Burst tracking.
The onset of a burst was initiated when the spectrogram amplitude of any frequency between 25 and 90 Hz rose above a threshold of 2 SDs. Next we tracked the variation of the time-dependent phase at the burst frequency. Because recordings were noisy, the phase was allowed to deviate from a single fixed value. We defined a decoherence angle over which the burst was allowed to wander and still be considered autocoherent. The optimal decoherence angle, 45°, was the angle (determined empirically) that most accurately measured bursts of known frequency and length placed in noise. Once the phase wandered farther than the decoherence angle, the burst was determined to have ceased being autocoherent. Using this method, we measured bursts of known length and frequency in noise with 90% accuracy. The autocoherent burst analysis was performed for the stimulated time period (less the first and last 100 ms to avoid onset and offset effects) of all trials.
Statistical tests.
Marginal and conditional distributions were statistically tested using a two-sample Kolmogorov–Smirnov (KS) test (Sprent and Smeeton, 2007). The data's marginal distributions of frequency and time scale were tested against those of the Noise and Burst models at each site using the KS test. For each marginal distribution, the observed autocoherent bursts in the data over all repetitions of the stimulus were pooled to form the data sample. This sample distribution was compared with those of the observed burst in the simulated Noise and Burst models (1000 simulations of each model at each site) fit to the spectral properties of that site.
Statistical power.
The ability to detect autocoherent bursts when present is referred to as statistical power. The statistical power of a site was measured by first simulating the full Burst model and background noise. The conditional time scale distributions of the two simulations (burst in noise and noise only) were then tested using a KS test including a Bonferroni correction for multiple comparisons. Sites that correctly identified the distributions from the two simulations as different (rejected by the KS test) at least 90% of the time were considered to have sufficient statistical power to be included. The 90% statistical power criterion roughly corresponded to the data having an R-spectrum value ≥2. Of 90 recording sites in V1, 53 were determined to have sufficient statistical power. The R-spectrum was defined as the visually stimulated power spectrum frequency divided by the spontaneous power spectrum frequency,
 |
and is a measure of the signal-to-noise ratio of the data.
Results
To test for the presence of clock signals, we compared the data with two models. The first model, referred to as the Noise model, was based on the assumption that gamma activity measured in cortex did not contain deterministic structure and was the result of filtering of random inputs by the network. The hypothesis included the idea that the cortical network was resonant with a response that peaked broadly around 40 Hz. A second model, referred to as the Burst model, asserted that the LFP contained autocoherent bursts with a characteristic frequency and time scale in the gamma-band that were added to noisy background activity. A Noise model and Burst model were fitted and simulated for each recording site.
Figure 1 compares V1 LFP data with the Noise and Burst models. An example of LFP data from a recording site in V1 is shown in Figure 1A, with its spectrogram and power spectrum plotted in the central column of Figure 1D. Realizations of the Noise model were created by assigning random phases to the Fourier amplitude spectrum of the LFP and taking the inverse transform (Fig. 1B). This procedure ensured that the Noise model's power spectrum exactly matched that of the data but with all phase information randomized. The method of generating noise by randomizing the phase spectrum of the Fourier transform, or phase shuffling, has been used previously in nonlinear physics (Theiler et al., 1992). More recently, a similar phase-randomization method was used to test for structure in low-frequency (0–20 Hz) subthreshold neurophysiological signals (Mokeichev et al., 2007). The spectrogram of the Noise model, like the data, had bursts of activity at varying frequencies between 25 and 70 Hz (Fig. 1D).
Figure 1.
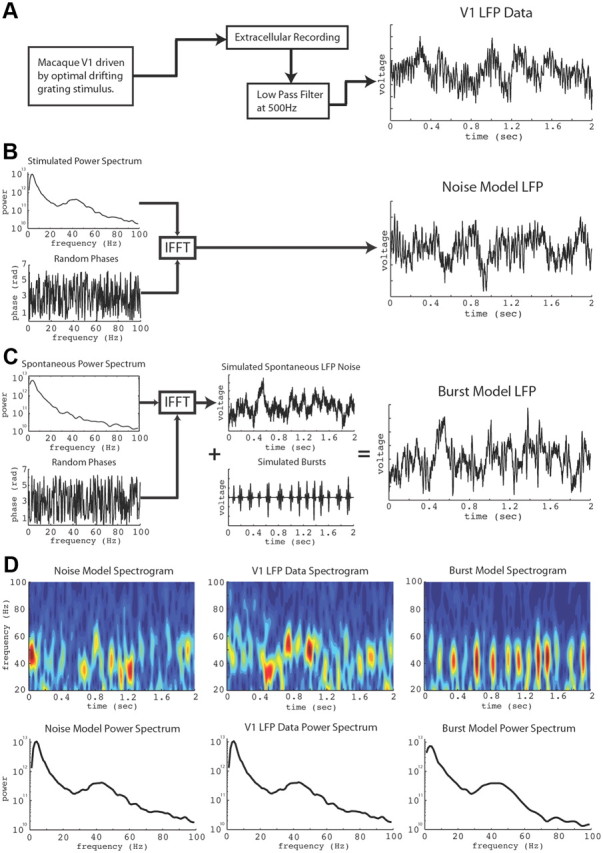
Data, Noise model and Burst model signals. A, Data recorded from visually driven macaque V1. B, Noise model: simulated by assigning random phases to the Fourier amplitude spectrum of the stimulated data and taking the inverse transform. C, Burst model: simulated by generating background noise from the spontaneous activity amplitude spectrum as in B summed with bursts fit to the power spectrum of the stimulated data. D, Spectrograms and power spectra. Power spectrum of Burst model matched the data's spectrum.
The LFP data are also compared with the Burst model in Figure 1D. The Burst model's activity consists of noisy background activity summed with randomly placed autocoherent bursts (Fig. 1C). The noisy background's time course was computed by phase shuffling the “spontaneous” (blank stimulus) Fourier amplitude spectrum. The autocoherent bursts were modeled as Gaussian-enveloped plane waves whose frequency and time scale were, respectively, set by the peak and width of the site's gamma-band power “bump” (35–55 Hz). The number of bursts in each simulation was drawn randomly from the distribution of the number of bursts observed in the data. Each burst was randomly placed in the simulated spontaneous activity with the condition that they did not overlap. The amplitude of each burst was drawn randomly from the distribution of burst amplitudes observed in the data. All burst amplitudes were multiplied by a constant chosen so that the integrated variance of all bursts in the simulation matched the power in the gamma-band of the data at that site. As shown in Figure 1D, each simulation of the Burst model generated a time series whose power spectrum matched that of the data (see Materials and Methods for details).
Autocoherence analysis of LFP gamma activity at one V1 recording site is demonstrated in Figure 2. The data's spectrogram is shown in Figure 2A, the time course of the data in Figure 2B, and phase portraits of autocoherent bursts in Figure 2C. The time-dependent amplitude and phase were calculated using the CGT (also known as a short-time Fourier transform or complex spectrogram) (Mallat, 2009) with rotated phases aligned to the beginning of the record (see Materials and Methods). Bursts were identified and their durations calculated (see Materials and Methods). The phase portraits of the bursts in Figure 2C coincide with the corresponding color-coded time periods in Figure 2B, with the color of each burst identifying its mean phase. A burst's frequency is labeled above its phase portrait and the arrows along the burst's phase trajectory indicate increasing time. The seven bursts illustrated in Figure 2 demonstrate the range of frequencies (30–70 Hz) and time scales (60–150 ms) typically present in the data. Similar phase and frequency analyses were also performed on the Noise model and Burst model simulations.
Figure 2.
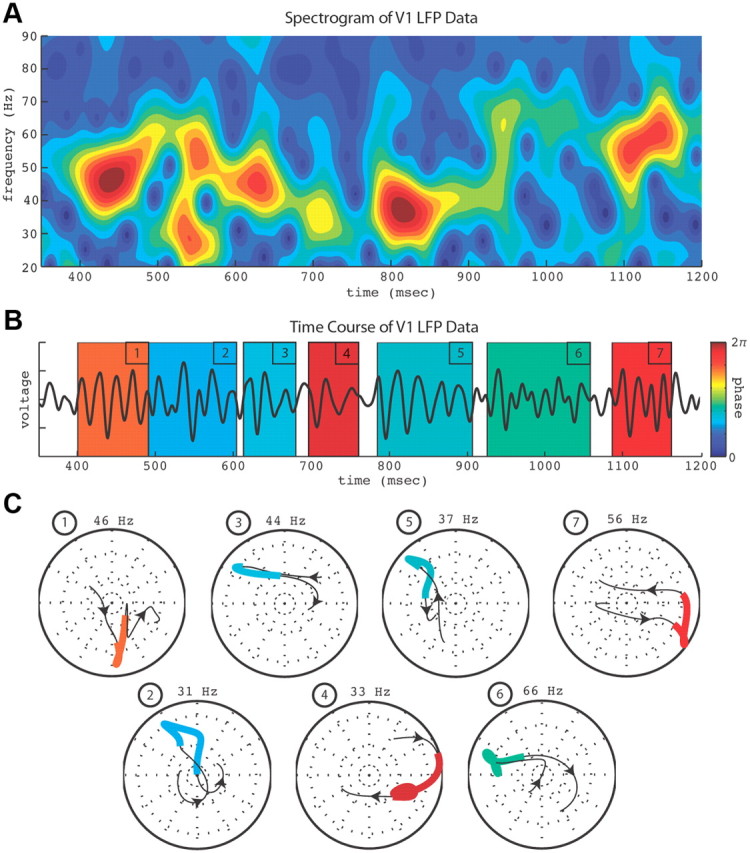
Example of autocoherence analysis of V1 LFP data. A, Gamma-band spectrogram of a stimulated V1 LFP recording. B, Time course of the recording in A with numbered bursts. C, Phase portraits of detected gamma-band bursts. Numbers and colors of bursts correspond to matching periods in the time course in B. Frequencies of bursts are labeled above each portrait, arrows in portraits show direction of increasing time, and burst color indicates mean phase of bursts as coded by the color bar in B. Range of burst frequencies and times shown here are representative of those typically measured in V1 LFP recordings.
The LFP data consisted of extracellular recordings from two macaque monkeys and consisted of 53 sites in V1 with sufficient statistical power to detect differences in the simulated data (see Materials and Methods). At each site, 25–50 repetitions of a 2–4 s optimal drifting grating visual stimulus were presented. After analyzing the bursts, the next step was to compute empirical joint probability distributions of the burst time scales and frequencies for the LFP data, Noise model, and Burst model (Fig. 3). These distributions represent the probability of occurrence of an autocoherent burst at a given oscillatory frequency that lasts for a period of time given by the time scale. The Noise model distribution (Fig. 3A) strongly resembled that of the data. The Burst model distribution (Fig. 3C) was unlike the data and Noise model distributions, with a narrower range of frequency densities. The probability of the occurrence of a burst away from the peak frequency fell off more sharply in the Burst model distribution than in the data and in the Noise model. At frequencies away from the peak, the conditional time scale distributions were narrower for the Burst model than for the data and the Noise model.
Figure 3.

Empirical joint probability distributions of measured burst frequencies and time scales over entire population of 53 sites. A, Distribution of bursts measured in Noise model simulations. B, Distribution of bursts measured in the data. Distribution peak: 40 Hz and 71 ms. C, Distribution of bursts measured in Burst model simulations.
To determine the similarity of the three distributions in Figure 3, a statistical test was performed. Plotted in Figure 4A are the marginal frequency distributions of the data, Noise model, and Burst model found by summing the joint probability distributions over all burst time scales. Whereas the marginal frequency distributions for the data and Noise model were nearly identical, the Burst model's marginal frequency distribution was different from the data's and the Noise model's distributions (Fig. 4A). A histogram of the results of a series of KS tests (Sprent and Smeeton, 2007) comparing the marginal frequency distribution at each site (see Materials and Methods) is plotted in Figure 4B. The vertical dashed line is the adjusted 95% confidence limit [using a Bonferroni correction to avoid problems with multiple comparisons (Miller, 1981)]. The bin at 10−6 contains all points with p values ≤10−6. The statistics confirm one's visual impressions of Figure 3: V1 data and the Noise model were statistically indistinguishable, but the data and the Burst model were significantly different (Fig. 4B). At 52 of 53 sites, the KS test failed to reject the null hypothesis that the data were filtered noise, with 42 sites having p values >0.1. At 52 of 53 sites, the KS test rejected the null hypothesis that the data contained bursts of a characteristic time scale and frequency described by the Burst model, with 43 sites having p values <10−6.
Figure 4.
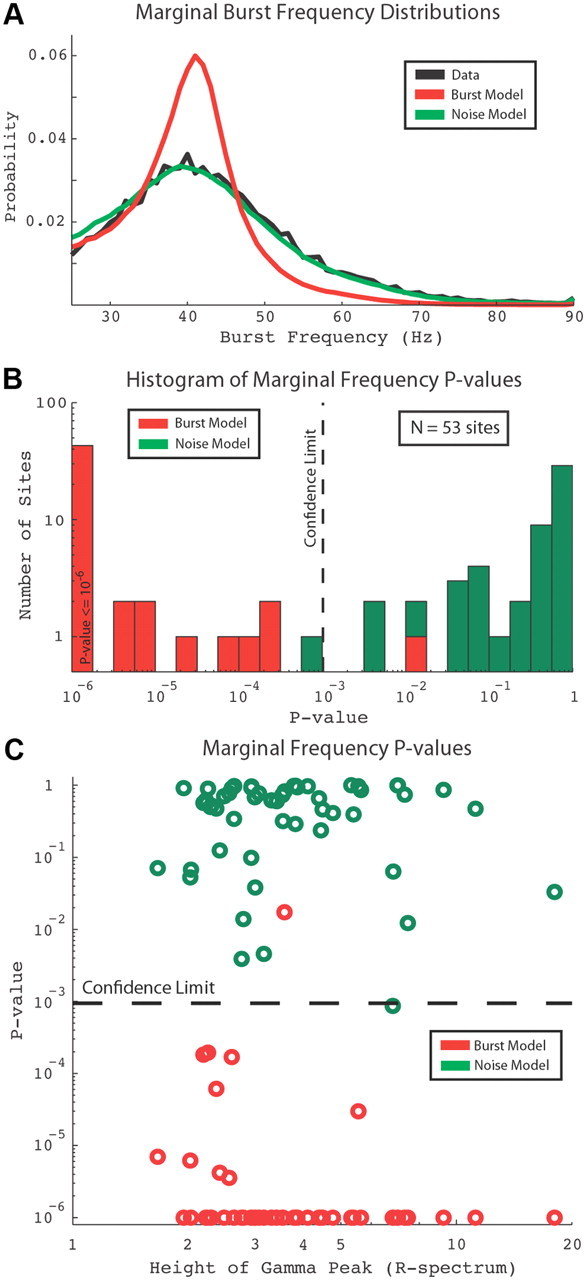
Statistical results. A, Marginal frequency distributions. B, Histogram of p values using the KS test for data and Noise model (green) and data and Burst model (red). C, p values described in B plotted versus gamma-band power; p values were not correlated with the amount of gamma activity.
It is conceivable that gamma activity becomes more clock-like when the gamma-band peak is higher and narrower, but this was not the case. There was no dependence of the KS test p values on the amount of gamma activity (expressed in terms of signal-to-noise ratio, SNR, using the R-spectrum; see Materials and Methods). The Burst model was strongly rejected (p < 10−6) at sites with SNRs ranging from 2 to 18, indicating that the rejection of the Burst model was not due to low SNRs. The Noise model was not rejected (p > 0.1) at sites with SNRs ranging from 2 to 13. KS tests of the marginal time scale distribution did not reject both the Noise and Burst models at a majority of sites. However, KS tests of the conditional time scale probabilities over the population of all sites (due to sparse conditional measurements, tests at each site were not possible) rejected the Burst model at frequencies between 25 and 45 Hz. The KS test of the conditional frequency and time scale probabilities over the population did not reject the Noise model from 25 to 90 Hz and 50–200 ms.
Discussion
We did not find evidence for the presence of a gamma clock in the visual cortex. There were no more autocoherent (phase conserving) oscillations in gamma activity than would be expected by chance. In this study, the autocoherence of visually driven LFPs from macaque V1 with strong gamma-band response under drifting grating stimulation was examined. We found that V1 gamma activity was statistically inconsistent with a clock model fit to the spectral properties of the LFP data; in fact, it was statistically indistinguishable from filtered noise.
The central concept of the clock theory is the idea that gamma activity may serve the purpose of a local “temporal reference frame” (Fries et al., 2007). In general, we use the term “clock” to mean a signal that supplies a regular deterministic temporal structure that can be used to organize time-dependent activities. Although it may be possible for multiple, distinct neuronal networks to be correlated with common noisy stochastic gamma activity (Fries, 2005; Womelsdorf et al., 2007), the gamma activity itself does not contain any phase structure and hence does not supply a “clock.” This means that given the arrival of one gamma-band pulse, the network has no knowledge of when the next pulse will arrive. The statement that gamma activity cannot be used as a clock specifically means that neuronal networks cannot use gamma activity as a regular temporal signal on which to base time-dependent calculations. This result calls into question theories of “binding” by coherence using gamma-band oscillations that rely on regular, rhythmic, or autocoherent oscillations that are established by a subpopulation of inhibitory interneurons in a neuronal network (Gray et al., 1989; Buzsáki and Chrobak, 1995; Hopfield, 1995; Buzsáki, 2006; Fries et al., 2007; Cardin et al., 2009; Traub and Whittington, 2010).
Previously, we tested for the presence of an externally stimulus-driven clock by examining phase trajectories of gamma activity in LFPs recorded in vivo from macaque V1 stimulated with optimal drifting gratings (Burns et al., 2010). We tested for autocoherence by estimating the consistency of gamma-band phase over the period of stimulation and found that, over time, the phase of gamma activity in V1 LFPs at a single electrode (as opposed to over multiple electrodes) varied widely and randomly on the time scale of external stimuli (2–4 s). The goal of Burns et al. (2010) was to test the validity of theoretical models that claimed that external stimuli evoked sustained, deterministic, harmonic network oscillations in the gamma-band. The data were statistically inconsistent with such models. In summary, we have tested gamma activity for autocoherence both on longer, externally driven time scales set by stimuli (Burns et al., 2010) and for shorter, internally generated time scales here. In both studies, we did not find any autocoherent structure that could not be found by chance in filtered noise. These combined results call into question theories of gamma activity that claim the gamma-band of the LFP may serve as a time-keeping signal. Furthermore, we claim that modeling gamma activity as a regular deterministic oscillation on any time scale is inconsistent with data recorded from cortex and an unrealistic representation of how the brain functions.
Other studies also have searched for temporal structure in the spike sequences produced by single units and in LFP signals, and concluded that oscillations and patterns in subthreshold activity were not different from what was expected to occur in noise. For example, Baker and Lemon (2000) demonstrated that sequences of spikes that were thought to form distinct repeating “synfire chains” in motor cortex were just as likely to be found in random spike sequences whose interval statistics matched the data. Mokeichev et al. (2007) examined low-frequency (0–20 Hz) subthreshold voltage recordings for “cortical motifs” and found that the repetition of 1 s long patterns in intracellular data recorded from rat barrel cortex was not greater than chance. Roxin et al. (2008) simulated a model network of stochastic binary neurons with random connectivity and found they were also able to re-create the distribution of “motifs” found in data, “motifs” that were thought to be meaningful.
Recent work on gamma activity in V1 LFPs also concluded that gamma activity does not function as a clock signal. Ray and Maunsell (2010) studied the V1 gamma-band response in neighboring networks to visual stimuli with spatially varying contrast. They found that within a trial in which stimulus contrast across a surface was modulated in time, the peak gamma frequency in V1's visual response varied according to the time-varying contrast. Furthermore, neighboring V1 networks (∼400 μm separation) could have significantly different peak frequencies. The variation of the gamma frequency did not support the idea of gamma as a clocking mechanism for binding neural signals about objects.
It may be argued there are multiple discrete “clocks” operating at different frequencies in the gamma activity that our Burst model at a single frequency would not capture. But the marginal distribution of burst frequencies observed in the data (Fig. 4A) is unimodal and very well fit by the Noise model (statistically indistinguishable in 52 of 53 sites). For a Burst model with clocks at multiple frequencies to fit the data better than the Noise model, the number of clocks that would need to be included would make the Burst model indistinguishable from noise. For this reason, we believe that a Burst model containing a small number of clocks will also not be a realistic description of the observed gamma activity.
Gamma activity has less temporal structure than previously thought, and for this reason the mechanism by which gamma activity may function as a means of communication between networks must be reconsidered. One possibility that has been suggested is that neuronal networks may use higher order features of the gamma signal to communicate, such as the instantaneous frequency modulation of bursts (Atallah and Scanziani, 2009). Hansel and Sompolinsky (1996) simulated a model network that generated chaotic synchronized states, which suggests that chaotic gamma activity could synchronize neurons. Although a chaotic gamma oscillation would not supply a regular autocoherent oscillation as described here, chaos is deterministic and predictable on certain time scales. If a network contains chaotic gamma-band oscillations, then, for short time windows determined by the Lyapunov exponents of the system (Strogatz, 2001), the network will have knowledge of when the next pulse of gamma activity will arrive. In this way, a chaotic gamma oscillation can be used as a short-term clock for time-dependent computation and, if multiple networks are in the same chaotic parameter regime, also for synchronizing different networks. But, when analyzed using linear methods, deterministic chaotic signals would appear to be noise. Further work on the possible synchronizing of networks via the gamma-band will include examining the phase and frequency structure of gamma activity for higher order correlations and for the presence of chaotic activity.
We have shown that gamma activity is indistinguishable from filtered noise and does not supply a clock to the network, but a noisy gamma signal may still serve a function in network computation. A mechanism that could generate a signal that consists of filtered noise with a peak response in the gamma-band is a resonant stochastic filter (Rennie et al., 2000; Kang et al., 2010). It is possible that the stochastic gamma activity generated by such a filter could drive the network into an activated state where the membrane potentials of individual neurons in the network are randomly depolarized due to input from the noisy gamma activity. On average, neurons in an activated state will be more likely to fire in response to sparse input. Short high-amplitude bursts in the gamma-band, if present in multiple networks, could operate as a transient sync pulse. This pulse would not serve as a clock but may synchronize different gamma-activated networks to fire simultaneously. Furthermore, the relative timing of this sync pulse in different networks could also function in the attentional selection of different features of a stimulus.
Footnotes
This work was supported by the Swartz Foundation and NIH Training Grant T32-EY007158. Robert M. Shapley and Dajun Xing were also supported by NIH Grant R01 EY-01472 and National Science Foundation Grant IOS-745253.
The authors declare no competing financial interests.
References
- Atallah BV, Scanziani M. Instantaneous modulation of gamma oscillation frequency by balancing excitation with inhibition. Neuron. 2009;62:566–577. doi: 10.1016/j.neuron.2009.04.027. [DOI] [PMC free article] [PubMed] [Google Scholar]
- Baker SN, Lemon RN. Precise spatiotemporal repeating patterns in monkey primary and supplementary motor areas occur at chance levels. J Neurophysiol. 2000;84:1770–1780. doi: 10.1152/jn.2000.84.4.1770. [DOI] [PubMed] [Google Scholar]
- Bracewell R. Ed 3. New York: McGraw-Hill; 1999. The Fourier transform and its applications. [Google Scholar]
- Burns SP, Xing D, Shelley MJ, Shapley RM. Searching for autocoherence in the cortical network with a time-frequency analysis of the local field potential. J Neurosci. 2010;30:4033–4047. doi: 10.1523/JNEUROSCI.5319-09.2010. [DOI] [PMC free article] [PubMed] [Google Scholar]
- Buzsáki G. Rhythms of the brain. Oxford: Oxford UP; 2006. [Google Scholar]
- Buzsáki G, Chrobak JJ. Temporal structure in spatially organized neuronal ensembles: a role for interneuronal networks. Curr Opin Neurobiol. 1995;5:504–510. doi: 10.1016/0959-4388(95)80012-3. [DOI] [PubMed] [Google Scholar]
- Cardin JA, Carlen M, Meletis K, Knoblich U, Zhang F, Deisseroth K, Tsai LH, Moore C. Driving fast-spiking cells induces gamma rhythms and controls sensory responses. Nature. 2009;459:663–667. doi: 10.1038/nature08002. [DOI] [PMC free article] [PubMed] [Google Scholar]
- Colgin LL, Denninger T, Fyhn M, Hafting T, Bonnevie T, Jensen O, Moser MB, Moser EI. Frequency of gamma oscillations routes flow of information in the hippocampus. Nature. 2009;462:353–357. doi: 10.1038/nature08573. [DOI] [PubMed] [Google Scholar]
- Fries P. A mechanism for cognitive dynamics: neuronal communication through neuronal coherence. Trends Cog Sci. 2005;9:474–480. doi: 10.1016/j.tics.2005.08.011. [DOI] [PubMed] [Google Scholar]
- Fries P, Reynolds JH, Rorie AE, Desimone R. Modulation of oscillatory neuronal synchronization by selective visual attention. Science. 2001;291:1560–1563. doi: 10.1126/science.1055465. [DOI] [PubMed] [Google Scholar]
- Fries P, Nikolić D, Singer W. The gamma cycle. Trends Neurosci. 2007;30:309–316. doi: 10.1016/j.tins.2007.05.005. [DOI] [PubMed] [Google Scholar]
- Gail A, Brinkmeyer HJ, Eckhorn R. Perception-related modulations of the local field potential power and coherence in primary visual cortex of awake monkey during binocular rivalry. Cereb Cortex. 2004;14:300–313. doi: 10.1093/cercor/bhg129. [DOI] [PubMed] [Google Scholar]
- Gonzalez-Burgos G, Lewis DA. GABA neurons and the mechanisms of network oscillations: implications for understanding cortical dysfunction in schizophrenia. Schizophr Bull. 2008;34:944–961. doi: 10.1093/schbul/sbn070. [DOI] [PMC free article] [PubMed] [Google Scholar]
- Gray CM, McCormick DA. Chattering cells: superficial pyramidal neurons contributing to the generation of synchronous oscillations in the visual cortex. Science. 1996;274:109–113. doi: 10.1126/science.274.5284.109. [DOI] [PubMed] [Google Scholar]
- Gray CM, König P, Engel AK, Singer W. Oscillatory responses in cat visual cortex exhibit inter-columnar synchronization which reflects global stimulus properties. Nature. 1989;338:334–337. doi: 10.1038/338334a0. [DOI] [PubMed] [Google Scholar]
- Hansel D, Sompolinsky H. Chaos and synchrony in a model of a hypercolumn in visual cortex. J Comput Neurosci. 1996;3:7–34. doi: 10.1007/BF00158335. [DOI] [PubMed] [Google Scholar]
- Henrie JA, Shapley R. LFP power spectra in V1 cortex: the graded effect of stimulus contrast. J Neurophysiol. 2005;94:479–490. doi: 10.1152/jn.00919.2004. [DOI] [PubMed] [Google Scholar]
- Hopfield JJ. Pattern recognition computation using action potential timing for stimulus representation. Nature. 1995;376:33–36. doi: 10.1038/376033a0. [DOI] [PubMed] [Google Scholar]
- Kang K, Shelley M, Henrie JA, Shapley R. LFP spectral peaks in V1 cortex: network resonance and cortico-cortical feedback. J Comput Neurosci. 2010;29:495–507. doi: 10.1007/s10827-009-0190-2. [DOI] [PMC free article] [PubMed] [Google Scholar]
- Logothetis NK, Pauls J, Augath M, Trinath T, Oeltermann A. Neurophysiological investigation of the basis of the fMRI signal. Nature. 2001;412:150–157. doi: 10.1038/35084005. [DOI] [PubMed] [Google Scholar]
- Mallat S. A wavelet tour of signal processing. Ed 3. Burlington, MA: Academic; 2009. [Google Scholar]
- Mancilla JG, Lewis TJ, Pinto DJ, Rinzel J, Connors BW. Synchronization of electrically coupled pairs of inhibitory interneurons in neocortex. J Neurosci. 2007;27:2058–2073. doi: 10.1523/JNEUROSCI.2715-06.2007. [DOI] [PMC free article] [PubMed] [Google Scholar]
- Miller RG. Simultaneous statistical inference. Ed 2. New York: Springer; 1981. [Google Scholar]
- Mokeichev A, Okun M, Barak O, Katz Y, Ben-Shahar O, Lampl I. Stochastic emergence of repeating cortical motifs in spontaneous membrane potential fluctuations in vivo. Neuron. 2007;53:413–425. doi: 10.1016/j.neuron.2007.01.017. [DOI] [PubMed] [Google Scholar]
- Pesaran B, Pezaris JS, Sahani M, Mitra PP, Andersen RA. Temporal structure of neuronal activity during working memory in macaque parietal cortex. Nat Neurosci. 2002;5:805–811. doi: 10.1038/nn890. [DOI] [PubMed] [Google Scholar]
- Ray S, Maunsell JH. Differences in gamma frequencies across visual cortex restrict their possible use in computation. Neuron. 2010;67:885–896. doi: 10.1016/j.neuron.2010.08.004. [DOI] [PMC free article] [PubMed] [Google Scholar]
- Rennie CJ, Wright JJ, Robinson PA. Mechanisms of cortical electrical activity and emergence of gamma rhythm. J Theoret Biol. 2000;205:17–35. doi: 10.1006/jtbi.2000.2040. [DOI] [PubMed] [Google Scholar]
- Roxin A, Hakim V, Brunel N. The statistics of repeating patterns of cortical activity can be reproduced by a model network of stochastic binary neurons. J Neurosci. 2008;28:10734–10745. doi: 10.1523/JNEUROSCI.1016-08.2008. [DOI] [PMC free article] [PubMed] [Google Scholar]
- Sprent P, Smeeton NC. Applied nonparametric statistical methods. Ed 4. London: Chapman and Hall; 2007. [Google Scholar]
- Strogatz SH. New York: Westview; 2001. Nonlinear dynamics and chaos: with applications to physics, biology, chemistry, and engineering. [Google Scholar]
- Theiler J, Eubank S, Longtin A, Galdrikian B, Farmer JD. Testing for nonlinearity in time series: the method of surrogate data. Physica D. 1992;58:77–94. [Google Scholar]
- Traub RD, Whittington MA. Cortical oscillations in health and disease. Oxford, UK: Oxford UP; 2010. [Google Scholar]
- Uhlhaas PJ, Pipa G, Lima B, Melloni L, Neuenschwander S, Nikolić D, Singer W. Neural synchrony in cortical networks: history, concept and current status. Front Integr Neurosci. 2009;3:1–19. doi: 10.3389/neuro.07.017.2009. [DOI] [PMC free article] [PubMed] [Google Scholar]
- Whittington MA, Traub RD, Jefferys JGR. Synchronized oscillations in interneuron networks driven by metabotropic glutamate receptor activation. Nature. 1995;373:612–615. doi: 10.1038/373612a0. [DOI] [PubMed] [Google Scholar]
- Wilson TW, Rojas DC, Reite ML, Teale PD, Rogers SJ. Children and adolescents with autism exhibit reduced MEG steady-state gamma responses. Biol Psychiatry. 2007;62:192–197. doi: 10.1016/j.biopsych.2006.07.002. [DOI] [PMC free article] [PubMed] [Google Scholar]
- Womelsdorf T, Schoffelen JM, Oostenveld R, Singer W, Desimone R, Engel AK, Fries P. Modulation of neuronal interactions through neuronal synchronization. Science. 2007;316:1609–1612. doi: 10.1126/science.1139597. [DOI] [PubMed] [Google Scholar]