Abstract
The ARF locus is frequently inactivated in human cancer. The oncosuppressor ARF has indeed been described as a general sensor for different situation of cellular stress. We have previously demonstrated that ARF deficiency severely impairs inflammatory responses in vitro and in vivo, establishing a role for ARF in the regulation of innate immunity. The aim of the present work was to get further insights into the immune functions of ARF and to evaluate its possible contribution to the polarization of macrophages toward the M1 or M2 phenotype. Our results demonstrate that resting Arf−/− macrophages express high levels of Ym1 and Fizz-1, two typical markers of alternatively-activated macrophages (M2). Additionally, Arf−/− peritoneal macrophages showed an impaired response to lipopolysaccharide (a classical inducer of M1 polaryzation) and a reduced production of pro-inflammatory cytokines/chemokines. Moreover, upon stimulation with interleukin-4 (IL-4), an inducer of the M2 phenotype, well established M2 markers such as Fizz-1, Ym1 and arginase-1 were upregulated in Arf−/− as compared with wild type macrophages. Accordingly, the cytokine and chemokine profile associated with the M2 phenotype was significantly overexpressed in Arf−/− macrophages responding to IL-4. In addition, multiple pro-angiogenic factors such as VEGF and MMP-9 were also increased. In summary, these results indicate that ARF contributes to the polarization and functional plasticity of macrophages.
Keywords: ARF, IL-4, TAMs, alternative activation, macrophage
Introduction
The immune system constitutes one of the first-line defenses to prevent tumor development, owing to its ability to identify and destroy tumor cells. This process, which has been termed cancer immunosurveillance, has gained considerable attention in the last years. One of the most important immune effector cells are macrophages, which exert multiple biological roles, including antigen presentation as well as the regulation of inflammation and tissue remodeling. Moreover, macrophages are involved in the etiology of a variety of pathological conditions including cancer. In particular, tumor-associated macrophages (TAMs) have been found to contribute to tumor initiation, progression and metastasis. TAMs have been proposed to exhibit many similarities in terms of gene expression and functions with “alternatively-activated” M2 macrophages.1
Macrophages are classified in two different polarization phenotypes according to distinct functional properties: classically-activated (M1) and alternatively-activated (M2) macrophages.2 M1 macrophages are induced by interferon γ (IFNγ) either alone or in combination with microbial stimuli such as lipopolysaccharide (LPS) or cytokines (e.g., tumor necrosis factor α, TNFα, and granulocyte macrophage colony-stimulating factor, GM-CSF). These macrophages produce pro-inflammatory cytokines including TNF-α, interleukin (IL)-1, IL-6, IL-12 or IL-23, as well as other pro-inflammatory mediators such as nitric oxide (NO, upon the expression of inducible nitric oxide synthase, iNOS), all of which are essential for killing pathogens and for priming antitumor immune responses.2 In contrast, IL-4/IL-13 stimulation induces M2 macrophages, which have an important role in the response to parasites, tissue remodeling, angiogenesis and tumor progression. M2 macrophages downregulate IL-12 expression and produce the anti-inflammatory cytokine IL-10. Additionally, M2 macrophages are characterized by the expression of several surface markers including arginase 1 (Arg-1) and the mannose receptor (MMR).2-4 Interestingly, genes associated with tissue remodelling such as found in inflammatory zone 1 (FIZZ1) and chitinase 3-like 3 (YM1) have been considered new M2-polarization associated genes.5,6
We have recently described that the tumor suppressor ARF (alternative reading frame; p14ARF in humans, p19ARF in mice) plays an important role in the regulation of innate immunity and inflammatory processes.7 Mice lacking the Arf gene are resistant to LPS-endotoxic shock, and Arf-deficient macrophages showed a severely impaired production of inflammatory mediators including NO, cytokines and chemokines. Since this phenotype showed numerous similarities to that of M2 macrophages, we wondered whether ARF could contribute to the polarization and functional plasticity of macrophages.
Our results demonstrate that ARF deficiency switch macrophages to a M2-like phenotype. Thus, resting Arf−/− macrophages overexpress typical M2 markers such as Ym1 and Fizz-1, as well as the Ccl17 chemokine. Furthermore, compared to their wild type (WT) counterparts, ARF-deficient cells showed an altered expression of pro-inflammatory mediators and cytokines such as NO, IL-12, IL-6 and TNFα after stimulation with LPS. The cytokine/chemokine pattern induced by IL-4 stimulation appeared upregulated in macrophages isolated from Arf−/− mice, showing a M2-like phenotype featuring higher levels of IL-10, Ccl22, Ccl5, Ccr3 or Ccr5. A significantly enhanced arginase activity and the upregulation of surface receptors such as Fizz-1 and Ym1 were also observed. Finally, important pro-angiogenic factors such as vascular endothelial growth factor (VEGF) and matrix metalloproteinase 9 (MMP-9) were increased in ARF-deficient macrophages, suggesting that these cells may exert pro-tumorigenic functions.
In summary, the current study strongly suggests that ARF has a profound influence in regulating the polarization of macrophages and points to ARF as a novel regulator of the immune tumor microenvironment.
Results
ARF deficiency promotes the expression of M2 markers
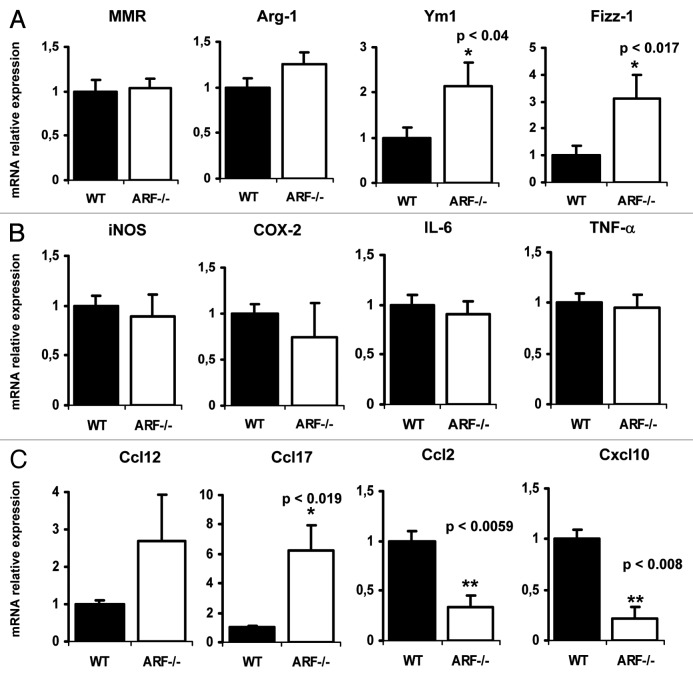
To explore the contribution of the tumor suppressor ARF to macrophage polarization, we first analyzed by quantitative PCR the expression levels of typical hallmarks of M2 polarization on WT vs. Arf−/− resting macrophages. The levels of the genes encoding Fizz-1 and Ym1 were significantly higher in ARF-deficient macrophages than in their WT counterparts. Arg-1 also showed a tendency to be overexpressed, although the data were not statistically significant. Nevertheless, MMR gene was unaffected in this situation (Fig. 1A). In contrast, M1 polarization markers such as iNOS, COX-2, IL-6 or TNFα were not altered in Arf−/− macrophages. In addition to the modulation of surface markers expression, M1 and M2 macrophages display different cytokines and chemokines gene expression profiles. In order to analyze whether ARF deficiency alters these profiles, we performed a microarray analysis of 84 genes coding for pro-inflammatory cytokines and their receptors. The full list of genes and fold changes are shown in Table S1. As depicted in Table 1, ARF appears to play a key role in regulating the basal expression of several genes related with M2 polarization. Thus, in the group of genes upregulated in Arf−/− macrophages, we found Ccl12 and Ccl17, two chemokines related to the M2 phenotype. In contrast, the expression of M1-related chemokines (Ccl2 and Cxcl10) was reduced. Microarray data were validated by quantitative PCR (Fig. 1C). These results suggest that ARF deficiency might modulate macrophage differentiation toward a M2-like phenotype.
Figure 1. Expression of M1 and M2 markers in resting WT and ARF-deficient macrophages. Peritoneal WT and ARF-deficient macrophages were obtained as described in Material and Methods. Cells were cultured in RPMI 1640 medium for 24 h, followed by RNA isolation. (A) Mannose macrophage receptor (MMR), arginase 1 (Arg-1), Ym1 and Fizz-1 expression was assessed by quantitative PCR. Results were obtained from five independent experiments performed in triplicate and data are reported as means ± SD (B) iNOS, COX-2, IL-6 and TNF-α expression was assessed by quantitative PCR. Results were obtained from five independent experiments performed by triplicate and data are reported as means ± SD (C) Quantitative PCR confirmation of selected genes identified by microarray studies. Results were obtained from three independent experiments with 4–5 mice per group and data are reported as means ± SD *p < 0.05 and **p < 0.01, as compared with WT macrophages.
Table 1. Basal gene expression profiles in Arf−/− vs. wild type resting macrophages.
| Symbol | Description | Fold change | p value | |
|---|---|---|---|---|
| Ccl12 |
Chemokine (C-C motif) ligand 12 |
2,7045 |
0,29821 |
|
| Ccl17 |
Chemokine (C-C motif) ligand 17 |
6,2512 |
0,00196 |
|
| Ccl2 |
Chemokine (C-C motif) ligand 2 |
0,331 |
0,00596 |
|
| Cxcl10 |
Chemokine (C-X-C motif) ligand 10 |
0,2134 |
0,00843 |
|
| Cxcl15 |
Chemokine (C-X-C motif) ligand 15 |
2,8189 |
0,22657 |
|
| Il2rb |
Interleukin 2 receptor, β chain |
2,147 |
0,5172 |
|
| Il5ra |
Interleukin 5 receptor, α |
3,404 |
0,26724 |
|
| Ltb |
Lymphotoxin B |
4,4502 |
0,20412 |
|
| Tnfrsf1b |
Tumor necrosis factor receptor superfamily, member 1b |
49,2344 |
0,37387 |
|
| Xcr1 |
Chemokine (C motif) receptor 1 |
2,6956 |
0,27068 |
|
| Peritoneal macrophages from wild type (WT) and Arf−/− mice were obtained as described in Material and Methods. Cells were cultured in RPMI 1640 medium for 24 h, followed by lysis and RNA isolation. The expression of pro-inflammatory genes was analyzed by RT2 PCR analysis. p values were calculated based on Student’s t tests comparing 2-ΔCt values for each gene. | ||||
Impaired M1 polarization in ARF-deficient macrophages
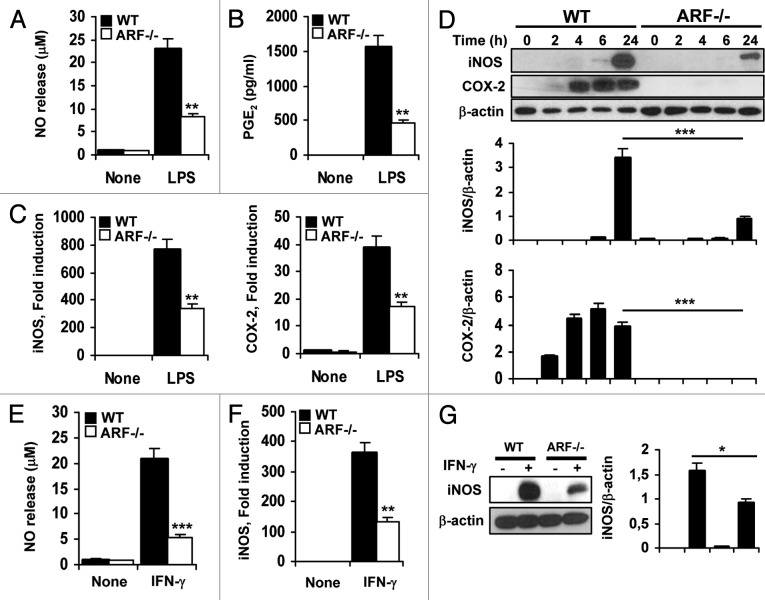
One of the characteristics of M2-polarized cells is their ability to wane the inflammatory/immune response by inhibiting M1 macrophage-mediated functions. M1 macrophages are mainly induced by IFNγ or upon stimulation with bacterial products such as LPS. To investigate whether ARF deficiency contributes to the downregulation of M1-mediated inflammatory activities, we examined the levels of classical inflammatory mediators such as NO and prostaglandin E2 (PGE2). Peritoneal macrophages from WT and Arf−/− mice were stimulated with LPS or IFNγ. As expected, the stimulation of WT macrophages with LPS generated high NO and PGE2 levels, whereas a deficient response was observed in the absence of Arf (Figs. 2A and B). Accordingly, iNOS and COX-2 expression was upregulated in WT cells responding to LPS and IFNγ, as compared with Arf−/− macrophages (Figs. 2C and D). Similar to LPS, IFNγ induced NO release and iNOS activation, and once again, Arf−/− cells showed a significantly reduced response as compared with WT macrophages (Figs. 2E–G).
Figure 2. Attenuated inflammatory response of ARF deficient macrophages to classical activation. (A) Peritoneal WT and ARF-deficient macrophages were stimulated with 200 ng/mL lipopolysaccharide (LPS) for 24 h and NO release was determined by the Griess reaction. (B) PGE2 levels were assessed by ELISA in cells treated as in A. (C) Peritoneal macrophages from WT and ARF-deficient mice were activated for 6 h with 200 ng/mL LPS and expression of iNOS and COX-2 was evaluated by quantitative PCR. (D) Protein levels of iNOS and COX-2 were evaluated by immunoblotting after stimulation of peritoneal macrophages with 200 ng/mL LPS for the indicated time. Band intensities were quantified by densitometry, normalized to β-actin levels and represented as means ± SD of the fold change from control condition (n = 3). (E) NO release of peritoneal macrophages from WT and Arf−/− mice after stimulation for 24 h with 50 ng/mL γinterferon γ (IFNγ). (F) iNOS induction was examined by quantitative PCR in WT and Arf−/− cells after treatment with 50 ng/mL IFNγ for 6 h. (G) Protein levels of iNOS were evaluated by immunoblotting after stimulation of peritoneal macrophages with 50 ng/mL IFNγ for 24 h. Results were obtained from three independent experiments performed in triplicate and data are reported as means ± SD *p < 0.05, **p < 0.01 and ***p < 0.001 as compared with the same condition in WT macrophages. (D) and (G) are representative of one out of three independent experiments.
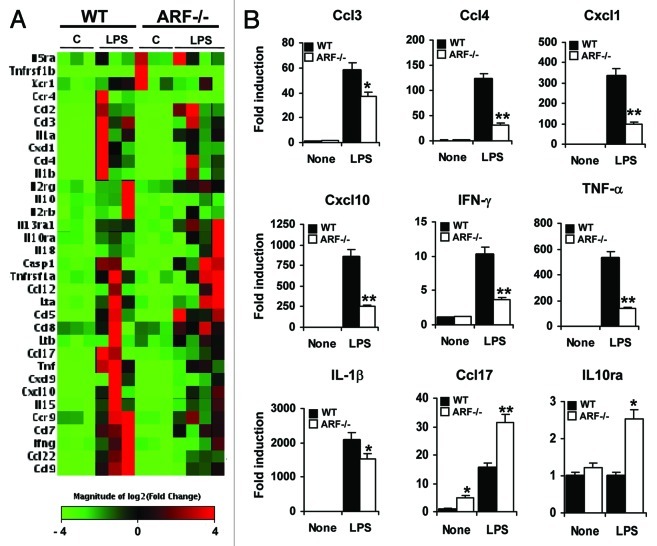
We next compared the genetic profiles of WT and Arf−/− macrophages after stimulation with LPS. We found that LPS induced 31 pro-inflammatory genes in WT macrophages including genes coding for chemokines (Ccl3, Ccl4, Cxcl1, and Cxcl10), cytokines (IL-1α, IL-1β) and other inflammatory mediators such as TNFα and IFNγ (Fig. 3A and Table 2). LPS-treated Arf−/− cells expressed markedly lower levels of 22 out of these 31 genes, and a significant upregulation of 8 genes, including Ccl5 and Ccl17. Additionally, we found two genes only upregulated in Arf−/− macrophages responding to LPS, namely Ccl8 and IL10ra (Fig. 3 and Table 2).
Figure 3. Differential LPS-inducible cytokine/chemokine profile in WT and Arf−/− cells. (A) DNA microarray analysis of lipopolysaccharide (LPS)-inducible cytokines/receptors differentially expressed in WT macrophages vs. Arf−/− macrophages. Peritoneal macrophages from WT and ARF-deficient mice were treated with 200 ng/mL LPS for 6 h, followed by microarray studies. In red and green, genes upregulated and downregulated, respectively, in response to LPS are indicated. (B) A panel of genes was selected for validation by quantitative PCR analysis based on microarray results. Results were obtained from three independent experiments performed in triplicate and data are reported as means ± SD *p < 0.05, and **p < 0.01, as compared with the same condition in WT macrophages.
Table 2. Inflammatory gene expression in lipopolysaccharide-activated wild type and ARF-deficient macrophages.
| Symbol |
Description |
Fold change |
|
|---|---|---|---|
| WT | Arf−/− | ||
| Casp1 |
Caspase 1 |
2,3858 |
3,6185 |
| Ccl12 |
Chemokine (C-C motif) ligand 12 |
339,1902 |
293,5526 |
| Ccl17 |
Chemokine (C-C motif) ligand 17 |
15,46 |
31,5263 |
| Ccl2 |
Chemokine (C-C motif) ligand 2 |
37,6895 |
49,6193 |
| Ccl22 |
Chemokine (C-C motif) ligand 22 |
47,0971 |
17,1265 |
| Ccl3 |
Chemokine (C-C motif) ligand 3 |
65,9904 |
36,7995 |
| Ccl4 |
Chemokine (C-C motif) ligand 4 |
92,4702 |
40,9398 |
| Ccl5 |
Chemokine (C-C motif) ligand 5 |
480,1318 |
618,0507 |
| Ccl7 |
Chemokine (C-C motif) ligand 7 |
95,9741 |
50,8313 |
| Ccl8 |
Chemokine (C-C motif) ligand 8 |
0,9048 |
2,4129 |
| Ccl9 |
Chemokine (C-C motif) ligand 9 |
18,802 |
6,4933 |
| Ccr4 |
Chemokine (C-C motif) receptor 4 |
4,175 |
0,5347 |
| Ccr9 |
Chemokine (C-C motif) receptor 9 |
8,9115 |
5,7009 |
| Cxcl1 |
Chemokine (C-X-C motif) ligand 1 |
423,505 |
197,4882 |
| Cxcl10 |
Chemokine (C-X-C motif) ligand 10 |
639,2351 |
465,289 |
| Cxcl9 |
Chemokine (C-X-C motif) ligand 9 |
184,895 |
123,7246 |
| Ifng |
Interferon gamma |
11,0909 |
3,6384 |
| Il10 |
Interleukin 10 |
4,7143 |
1,6302 |
| Il10ra |
Interleukin 10 receptor, α |
0,9859 |
2,2415 |
| Il13ra1 |
Interleukin 13 receptor, α 1 |
1,8425 |
3,7824 |
| Il15 |
Interleukin 15 |
19,8637 |
12,7172 |
| Il18 |
Interleukin 18 |
5,4358 |
5,6541 |
| Il1a |
Interleukin 1 α |
55,0694 |
44,468 |
| Il1b |
Interleukin 1 β |
2002,2656 |
1885,7737 |
| Il2rb |
Interleukin 2 receptor, β chain |
4,6718 |
3,2719 |
| Il2rg |
Interleukin 2 receptor, gamma chain |
2,4378 |
3,1741 |
| Il5ra |
Interleukin 5 receptor, α |
2,5791 |
3,6383 |
| Lta |
Lymphotoxin A |
12,0863 |
10,4605 |
| Ltb |
Lymphotoxin B |
7,0985 |
10,909 |
| Tnf |
Tumor necrosis factor |
465,9427 |
189,7928 |
| Tnfrsf1a |
Tumor necrosis factor receptor superfamily, member 1a |
2,0311 |
1,8406 |
| Tnfrsf1b |
Tumor necrosis factor receptor superfamily, member 1b |
13,7323 |
10,1068 |
| Xcr1 | Chemokine (C motif) receptor 1 | 3,5155 | 1,3856 |
Peritoneal macrophages from wild type (WT) and Arf−/− mice were obtained as described in Material and Methods. Cells were stimulated with 200 ng/mL lipopolysaccharide (LPS) for 6h and the expression of pro-inflammatory genes was analyzed by RT2 PCR analysis. Genes upregulated in LPS-stimulated Arf−/− cells as compared with WT cells are shown in bold.
The absence of ARF promotes exacerbated M2 polarization in response to IL-4 and IL-3
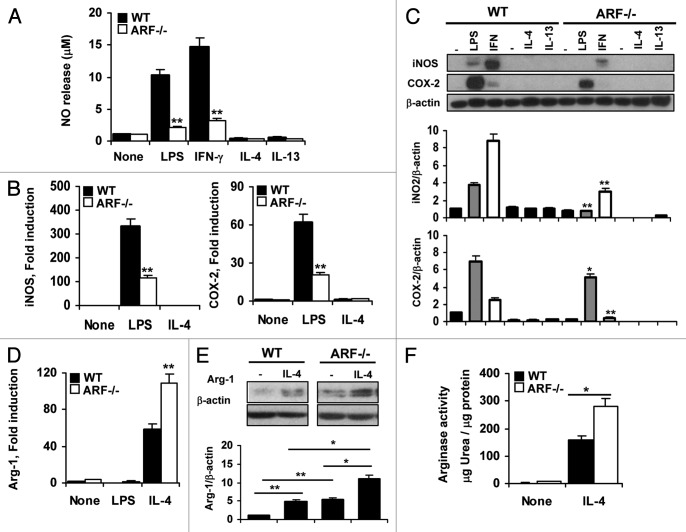
IL-4 and IL-13 are prototypic cytokines that induce the alternative activation of macrophages. To ascertain the role of ARF in this pathway, we evaluated the M2-like response on WT and Arf−/− peritoneal macrophages generated upon stimulation with IL-4 or IL-13. As shown in Figure 4A, LPS or IFNγ treatment induced NO release, a marker for classical activation, whereas IL-4 or IL-13 did not affect the levels of this pro-inflammatory mediator. Consistently with these findings, neither iNOS nor COX-2 overexpression was observed in macrophages activated with IL-4 or IL-13 (Fig. 4C). Opposite to the NO release observed by M1-activated macrophages, the alternative polarization is characterized by the upregulation of Arg-1, an inducible enzyme that competes with iNOS for l-arginine and thus can prevent NO release.8 Classical activation of macrophages with LPS had no effect on Arg-1 activation (Fig. 4D). In contrast, IL-4 promoted a > 50-fold induction in Arg-1 expression in WT macrophages (Fig. 4D). Interestingly, Arf−/− macrophages showed a much more striking and significant increase of Arg-1 after IL-4 stimulation (Fig. 4D). The markedly raised mRNA levels for Arg-1 in Arf−/− macrophages were confirmed at the protein level by immunoblotting analysis (Fig. 4E). Moreover, an increment in arginase activity using an urea-based assay was observed in Arf−/− macrophages as compared with WT cells (Fig. 4F).
Figure 4. Exacerbated activation of Arf−/− macrophages in response to IL-4. (A) WT and Arf−/− macrophages were treated with 200 ng/mL lipopolysaccharide (LPS), 50 ng/mL interferon γ (IFNγ), 20 ng/mL IL-4 and 20 ng/mL IL-13 for 24 h and NO release was determined by the Griess reaction. (B) Peritoneal macrophages from WT and ARF-deficient mice were treated with 200 ng/mL LPS and 20 ng/mL IL-4 and expression of iNOS and COX-2 was evaluated by quantitative PCR.. (C) Protein levels of iNOS and COX-2 were evaluated by immunoblotting after stimulation of peritoneal macrophages as in A. (D) Arg-1 expression was examined by quantitative PCR in WT and Arf−/− cells after stimulation with 200 ng/mL LPS and 20 ng/mL IL-4 for 6 h. (E) Protein levels of Arg-1 were evaluated by immunoblotting after stimulation of peritoneal macrophages with 20 ng/mL IL-4 for 24 h. F. WT and Arf−/− macrophages were treated with 20 ng/mL IL-4 for 24 h and production of urea was determined. Results were obtained from three independent experiments performed in triplicate and data are reported as means ± SD *p < 0.05, and **p < 0.01, as compared with WT mice. Panels B and E are representative of one out of three independent experiments. In panels C and E, band intensities were quantified by densitometry, normalized to β-actin levels and represented as means ± SD of the fold change from control condition (n = 3).
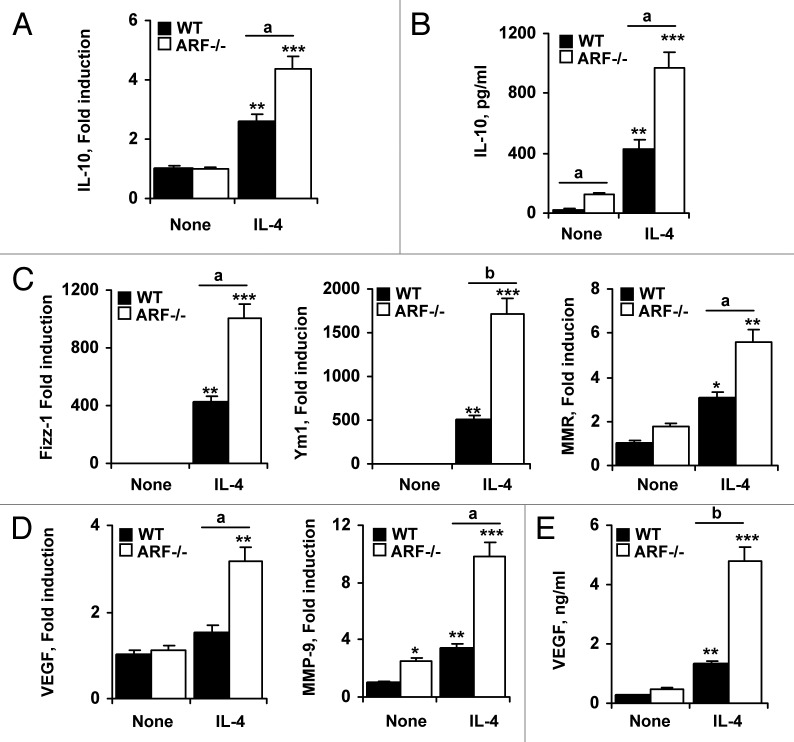
In agreement with the anti-inflammatory activity of M2 macrophages, the expression of IL-10 was considerably higher in Arf−/− macrophages (Fig. 5A). The differential expression of IL-10 in both types of macrophages was confirmed by measuring IL-10 levels in the supernatant (Fig. 5B). Moreover, we observed a higher expression of typical M2-surface markers (i.e., Fizz-1, Ym1 and MMR) in Arf−/− macrophages responding to IL-4, as compared with their WT counterparts (Fig. 5C).
Figure 5. M2 phenotype markers and pro-angiogenic factors are increased in IL-4-treated Arf−/− macrophages. (A) Peritoneal macrophages from WT and ARF-deficient mice were treated with 20 ng/mL IL-4 for 6 h, and the expression of IL-10 was evaluated by quantitative PCR. (B) IL-10 levels were measured by ELISA in supernatants of WT and Arf−/− macrophages treated for 24 h with 20 ng/mL IL-4. (C) WT and Arf−/− macrophages were treated as in A and Fizz-1, Ym1 and MMR expression was examined by quantitative PCR. (D) VEGF and MMP-9 expression was examined by quantitative PCR in WT and Arf−/− cells upon stimulation with 20 ng/mL IL-4 for 6 h. E. VEGF levels were determined by ELISA after stimulation of WT and Arf−/− cells with 20 ng/mL IL-4 for 24 h. Results were obtained from three independent experiments performed in triplicate and data are reported as means ± SD *p < 0.05, **p < 0.01 and ***p < 0.001, as compared with untreated WT cells, and ap < 0.05, bp < 0.01, as compared with WT cells.
In most tumor types, TAMs resemble alternatively activated macrophages in several aspects, including the release of pro-angiogenic factors. We observed that Arf−/− macrophages significantly increased VEGF and MMP-9 expression after IL-4 treatment (Figs. 5D and E), suggesting a pro-tumoral function for these cells.
Cytokine and chemokine expression profiles in IL-4-treated macrophages
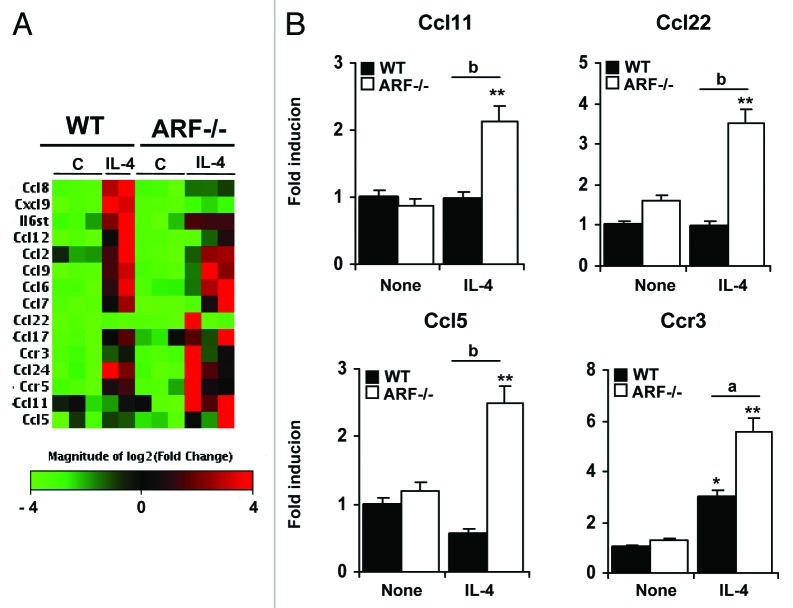
To obtain a more comprehensive understanding of the cytokine/chemokine repertoire induced by IL-4 in Arf−/− macrophages, we performed a microarray-based gene expression analysis. After 6 h of stimulation, only 14 genes were upregulated (> 2-fold) in WT macrophages (Fig. 6A and Table 3). The overexpressed genes Ccl24, Ccl6, Ccr3, Ccr5 and Il6st were IL-4 specific since LPS treatment did not modify their expression levels (Fig. 3A). In addition, we also found some chemokines and receptors (Ccl11, Ccl22, Ccl5, and CCr3) highly expressed in IL-4 stimulated Arf−/− macrophages as compared with WT cells. These results were validated by quantitative PCR analysis (Fig. 6B). Altogether, these data suggest that ARF deficiency promotes an enhanced response to inducers of the M2 polarization program, promoting a chemokine/cytokine pattern that may be viewed as that of a “hyper-M2” phenotype.
Figure 6. Gene expression profile of ARF-deficient macrophages after IL-4 stimulation. (A) Microarray analysis was conducted on 3 independent preparations of unstimulated macrophages or macrophages treated with 20 ng/mL IL-4 for 6 h. Hierarchical clustering of genes induced by IL-4 (fold induction > 2 and p < 0.05 on a 2-tailed paired Student’s t test comparing M2 vs unstimulated macrophages) is shown, together with genes differentially expressed in Arf−/− macrophages as compared with WT cells. Columns report gene names and fold increase upon IL-4 treatment vs. untreated conditions, for both WT and Arf−/− macrophages. (B) A panel of genes was selected for validation by quantitative PCR analysis based on the microarray results. Results were obtained from three independent experiments performed in triplicate and data are reported as means ± SD *p < 0.05, and **p < 0.01 as compared with none condition, and ap < 0.05, bp < 0.01, as compared with WT cells.
Table 3. Chemokine and cytokine profile in IL-4-stimulated macrophages.
| Symbol |
Description |
Fold change |
|
|---|---|---|---|
| WT | Arf−/− | ||
| Ccl11 |
Chemokine (C-C motif) ligand 11 |
0,98 |
2,14 |
| Ccl12 |
Chemokine (C-C motif) ligand 12 |
48,86 |
11,83 |
| Ccl17 |
Chemokine (C-C motif) ligand 17 |
12,97 |
13,60 |
| Ccl2 |
Chemokine (C-C motif) ligand 2 |
2,24 |
1,74 |
| Ccl22 |
Chemokine (C-C motif) ligand 22 |
1,51 |
3,52 |
| Ccl24 |
Chemokine (C-C motif) ligand 24 |
7,80 |
6,73 |
| Ccl5 |
Chemokine (C-C motif) ligand 5 |
1,57 |
2,01 |
| Ccl6 |
Chemokine (C-C motif) ligand 6 |
6,50 |
5,51 |
| Ccl7 |
Chemokine (C-C motif) ligand 7 |
21,92 |
11,05 |
| Ccl8 |
Chemokine (C-C motif) ligand 8 |
5,14 |
2,30 |
| Ccl9 |
Chemokine (C-C motif) ligand 9 |
3,71 |
3,21 |
| Ccr3 |
Chemokine (C-C motif) receptor 3 |
2,94 |
5,55 |
| Ccr4 |
Chemokine (C-C motif) receptor 4 |
0,45 |
0,40 |
| Ccr5 |
Chemokine (C-C motif) receptor 5 |
4,54 |
4,72 |
| Cxcl9 |
Chemokine (C-X-C motif) ligand 9 |
26,43 |
4,50 |
| Il6st |
Interleukin 6 signal transducer |
3,15 |
2,55 |
| Ltb |
Lymphotoxin B |
3,56 |
1,36 |
| Tnfrsf1b | Tumor necrosis factor receptor superfamily, member 1b | 2,79 | 1,53 |
Peritoneal macrophages from wild type (WT) and Arf−/− mice were stimulated with 20 ng/mL interleukin-4 (IL-4) for 6 h, and the expression of pro-inflammatory genes was analyzed by RT2 PCR analysis. Genes upregulated in IL-4 stimulated Arf−/− cells as compared with WT cells are shown in bold.
Discussion
Macrophages are dynamic cells that might modify their functional profiles in response to the microenvironment. Moreover, macrophages are increasingly recognized as pivotal regulators of tumorigenesis. Accumulating evidence suggests that macrophages that infiltrate tumors acquire a phenotype of alternative activation (M2), exerting immunosuppressive functions through the release of anti-inflammatory cytokines and facilitating the progression of tumors via the production of pro-angiogenic factors.1
Previously, we have described that the tumor suppressor ARF is an important mediator of the inflammatory response and of macrophage activation.7 In the current study, we investigated whether ARF deficiency promotes macrophage differentiation toward a phenotype that resembles the alternatively-activated state of TAMs. We demonstrate that, in the absence of ARF, macrophages have an impaired ability to develop pro-inflammatory properties, rather showing anti-inflammatory characteristics. Arf−/− macrophages expressed higher levels of IL-10, Fizz-1, Ym1, and increased arginase activity and lower levels of IL-12, TNFα, IFNγ, PGE2 and NO. Moreover, Arf−/− macrophages showed the upregulation of important pro-angiogenic factors (VEGF and MMP-9), which might contribute to tumor progression. These findings highlight the importance of ARF in the regulation of macrophage activation.
The tumor suppressor ARF is among the genes most frequently mutated in human cancer.9 Loss of ARF gene expression can abrogate immunosurveillance mechanisms and increase the susceptibility to cancer. Indeed, mice lacking p19ARF are highly prone to tumor development10,11 and deletion of ARF has been described in a variety of malignancies, including glioblastoma, melanoma, pancreatic adenocarcinoma, and non-small cell lung cancer. Interestingly, M2-polarized TAMs have been associated with poor prognosis and progression in many of these malignancies.
Based on these premises and on our previous results showing impairment in the pro-inflammatory activation of Arf−/− macrophages, we hypothesized that ARF might modulate the M1/M2 polarization and functional plasticity of macrophages. We have demonstrated that genes involved in M1 polarization, antimicrobial and antitumoral responses are downregulated in Arf−/− macrophages. In primary macrophages stimulated with LPS or IFNγ, these included genes coding for pro-inflammatory cytokines (TNFα, IL-1β), chemokines (Cxcl10, Cxcl1, Ccl4) and inflammatory mediators (iNOS/PGE2). Accordingly, the absence of Arf is known to reduce the susceptibility of mice to septic shock.7 Although mechanisms involved in this inhibitory effect have not been explored in this study, a decrease in NF-κB and MAPK activation has been described in Arf−/− macrophages responding to LPS.7 Similarly, inhibited degradation of IκB has been observed in ARF-deficient macrophages stimulated with the vesicular stomatis virus.12 Interestingly, the nuclear translocation of the p65/p50 heterodimers mainly associated with classical NF-κB activation was also inhibited in macrophages from Arf−/− mice responding to LPS stimulation,7 whereas massive accumulation of the p50 homodimer was observed (unpublished results), supporting the idea that ARF deficiency favors M2-driven inflammatory reactions.
In addition to the downregulation of pro-inflammatory mediators, typical hallmarks of the anti-inflammatory M2 phenotype were increased in both resting and IL-4-treated Arf−/− macrophages, including Arg-1, Fizz-1 and Ym1. In mice, M2 macrophages are characterized by an alternative metabolism of l-arginine, mainly catalyzed by Arg-1. Arg-1 is a cytosolic enzyme expressed at high levels in M2 macrophages that hydrolyzes arginine to urea and ornithine.8 Elevated Arg-1 expression might promote tumor growth via several mechanisms, including the downregulation of NO-mediated tumor cytotoxicity,13 increased tumor proliferation (due to alterations in polyamine and proline synthesis), and enhancements of the capacity of myeloid-derived suppressor cells to inhibit T cell proliferation.14,15 Indeed, increased expression of Arg-1 in TAMs has been described in 3LL murine lung carcinoma,14 in human papillomavirus E6/E7-expressing murine tumors16 and in CD11b+/CD14− myeloid cells from renal carcinoma patients.17 Together with Arg-1 overexpression, an increase in Fizz-1 and Ym1 levels was observed in Arf−/− macrophages. These data are in agreement with other studies showing a direct correlation between the M2 phenotype and a elevated expression of these genes.5 Interestingly, Fizz-1 and Ym1 have been shown to exert angiogenic effects, stimulating actin and collagen expression, and have been implicated in tissue repair.18,19
M2 macrophages and TAMs play an important role in tumor angiogenesis, as they produce critical factors including VEGF and MMP-9.20 Our results demonstrate that Arf−/− macrophages produce high levels of these angiogenesis-associated molecules, supporting the idea of that these cells exert tumor-supporting functions. Consistent with this notion, recent studies have demonstrated a role for ARF in suppressing tumor angiogenesis by regulating the expression of VEGF21 and the activity of its transactivator hypoxia-inducible factor -1 (HIF-1).22 Notably, ARF has also been described to inhibit angiogenesis by upregulating the expression of TIMP3, an inhibitor of MMPs activity.23
Another important feature that discriminates M1 and M2 macrophages is their cytokine and chemokine repertoire. M1 macrophages produce inflammatory chemokines such as Cxcl9 and Cxcl10, which induce the recruitment of Th1 cells, whereas M2 polarization is accompanied by the production of immunosuppressive cytokines (e.g., IL-10 and TGFβ) and chemokines such as Ccl17, Ccl22 and Ccl241,4,24 that favor the recruitment of immunosuppressive cells such like regulatory T cells (Tregs). Analysis of the cytokine and chemokine profile in Arf−/− macrophages showed a clear correlation with M2 phenotype. Notably, chemokines typically involved in lymphocyte recruitment, such as Ccl5 and the Ccr4 ligands Ccl17 and Ccl22 were consistently higher after the administration of IL-4 treatment in Arf−/−, but not in WT, macrophages. Thus, the release of these chemokines might result in the recruitment of Tregs, Th2 cells, eosinophils and basophils and in the amplification of Th2 responses. Moreover, Arf−/− macrophages showed a significant increase in IL-10 levels, which contribute to the maintenance of an immunosuppressive environment. Taken together, these findings indicate that resting Arf−/− macrophages acquire an M2-like phenotype. Moreover, Arf−/− macrophages exhibit a higher expression of M2-associated immunomodulatory genes in response to alternative activation stimuli.
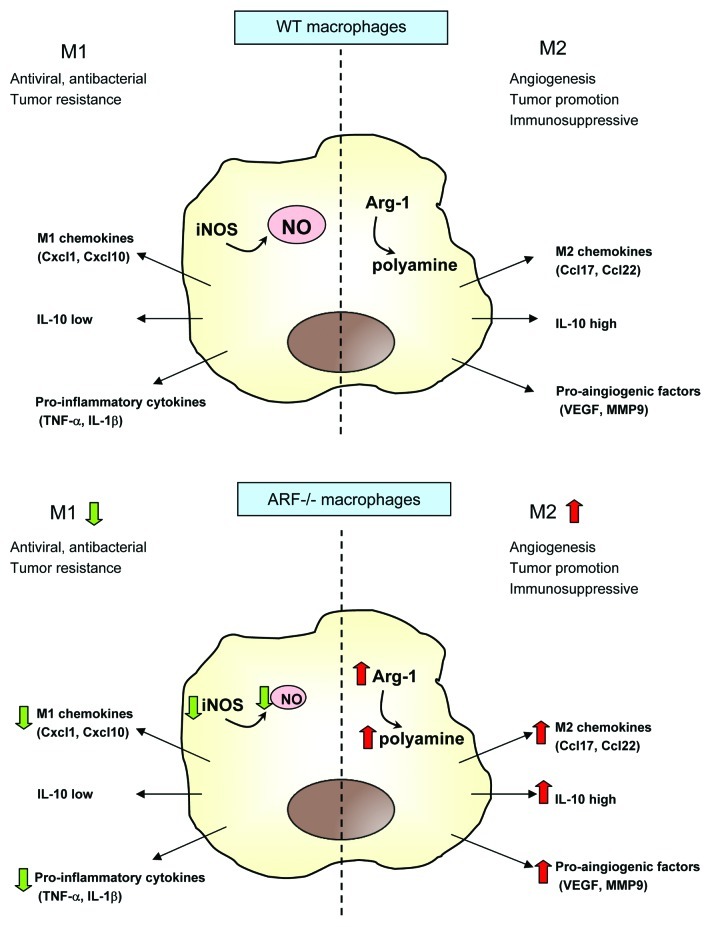
In summary, we propose that ARF-deficient macrophages can contribute to the establishment of a tolerogenic microenviroment, faciliting tumor progression as a result of 1) immunosuppression, through the production of anti-inflammatory IL-10 and the secretion of Ccl22 and Ccl2, which attract Tregs, 2) stimulation of angiogenesis, through the upregulation of VEGF and MMP-9, and 3) induction of extracellular matrix remodeling, through the production of MMP-9, Fizz-1 and Ym1 (Fig. 7). Further experiments analyzing the phenotype of macrophages that infiltrate tumors in Arf−/− mice might provide further insights into macrophage plasticity, thus facilitating the development of new therapeutic strategies.
Figure 7. A simplified view for M2-type activation in ARF-deficient macrophages. In WT macrophages, a balance between the M1 and M2 phenotype is established, depending on the initiating stimuli. However, ARF-deficient macrophages establish an immunosuppressive and tolerant microenvironment upon the impairment of M1 signals, secretion of the M2 chemokines Ccl17 and Ccl22 as well as of the anti-inflammatory cytokine IL-10, and stimulation of angiogenesis through expression of VEGF and MMP-9. Green and red arrows depict genes that are downregulated and upregulated, respectively, in ARF-deficient macrophages as comparted to their WT counterparts.
Materials and Methods
Materials and reagents
Ultrapure 0111:B4 lipopolysaccharide (LPS) from Escherichia coli was purchased from InvivoGen. Murine IFNγ, IL-4 and IL-13 were provided by Peprotech. The mouse RT2Profiler PCR Inflammatory Cytokines and Receptors array, the RT2 First Strand kit and SYBR Green/Fluorescein qPCR master mix were from SABiosciences. TRIzol reagent was from Invitrogen. Difco thioglycollate broth was from Becton-Dickinson. Anti-iNOS and anti-COX-2 antibodies were from Abcam, anti-arginase-1 and anti-β-actin antibodies were from Santa Cruz Biotechnology. Immunoblotting reagents (polyvinylidene difluoride membranes and ECL kit) were from GE Healthcare. Culture media were from Lonza. L-arginine, urea and 1-phenyl-1,2-propanedione-2-oxime were from Sigma.
Animals
All procedures involving animals were performed in accordance with European Union guidelines and the Declaration of Helsinki principles for the handling and use of laboratory animals. Studies were performed on 12-week-old Arf+/+ (WT), and Arf−/− C57BL/6J mice.
Preparation of elicited peritoneal macrophages
Peritoneal macrophages were elicited by intraperitoneal injection of 2.5 mL 3% thioglycollate in distilled water and were prepared as previously described.25 Cells were seeded at 1 x 10⁶/cm2 in RPMI medium containing 10% FBS. Non-adherent cells were removed 2 h after seeding by extensive washing with medium.
Determination of NO synthesis
NO was measured by the Griess reaction as previously described.26 Briefly, NO release was determined spectrophotometrically as the accumulation of nitrite in the medium. Absorbance at 548 nm was compared with standard NaNO2 solutions.
Assay of PGE2, VEGF and IL-10 release
Supernatants from WT and Arf−/− macrophages were tested for the presence of PGE2 VEGF, and cytokines using commercially available ELISA following the protocols supplied by the manufacturers (R&D Systems).
Arginase activity measurement
Arginase activity was assessed in cell lysates indirectly by measuring urea concentration generated by the arginase-dependent hydrolysis of L-arginine.27 Briefly, cells were lysed with 20 mM Tris (pH 7.5), 150 mM NaCl, 2 mM EDTA, and 0.1% Triton X-100-containing protease inhibitor mixture (Sigma) for 30 min at room temperature. Standards were prepared by serially diluting a stock of urea in 50 mM TRIS-HCl (pH 7.5) to yield a standard range from 1500 to 23.4 μg/mL. Lysates and standards (25 μL) were mixed with 25 μL of 10 mM MnCl2 in 50 mM TRIS-HCl (pH 7.5) in a 2 mL Eppendorf tube. Tubes were then incubated for 10 min at 55°C for activation. Next, arginine hydrolysis was conducted by incubating 50 μL of the lysates and standards with 50 μL of 0.5 M L-arginine at 37°C for 75 min, followed by the addition of 400 μL stopping solution (H2SO4/H3PO4/H2O = 1/3/7, v/v/v). To measure the amount of urea in each tube, 50 μL of 9% 1-phenyl-1,2-propanedione-2-oxime (Sigma) in 100% ethanol was added to each sample and standard, and tubes were incubated at 100°C for 60 min. Tubes were placed in the dark at 25°C for 30 min. Samples and standards (100 μL/well) were transferred in triplicate to a 96-well plate, and optical density was read at 540 nm with 690 nm correction. The concentration of samples was determined from the standard curve and converted to arginase units using the following formula: (urea produced (μg/mL)/total protein (μg/mL)).
Total extracts and immunoblotting
Cells were lysed at 4°C with 0.2 mL buffer A (0.5% Chaps, 10mM Tris pH 7.5, 1mM Cl2Mg, 1mM EGTA, 10% Glycerol, 5 mM β) and protease inhibitor cocktail (Sigma). Protein content was assayed with the Bio-Rad protein reagent. All cell fractionation steps were performed at 4°C. Protein extracts were subjected to SDS-PAGE (10–15% gels) and blotted onto polyvinylidene difluoride membranes, which were incubated antibodies specific for Arg-1, iNOS, COX-2 and β-actin. After incubation with HRP-conjugated secondary antibody, protein bands were revealed with an enhanced chemiluminescence kit (GE Healthcare). β-actin was used as a loading control. After treatment with 100 mM β-mercaptoethanol, 2% SDS in TBS and heating at 60°C for 30 min, blots were sequentially probed with other antibodies.
RNA isolation and quantitative PCR
Total RNA was isolated from cells with Trizol reagent (Invitrogen). Quantitative PCR (SYBR Green) analysis was performed with an ABI 7500 Fast sequence analyzer as previously described.28 Each sample was run in duplicate, and all samples were analyzed in parallel for the expression of the housekeeping gene 36B4 (acidic ribosomal phosphoprotein P0), which was used as an endogenous control for normalization of the expression level of target genes. Fold induction was determined from mean replicate values. Primer sequences are available on request.
Gene expression profile
Expression of inflammatory genes was evaluated with the mouse RT2Profiler PCR Inflammatory Cytokines and Receptors Array (SABiosciences). Briefly, 2 μg of RNA were used for cDNA synthesis with RT2 First Standard kit (SABiosciences). The RT2Profiler array was probed according to the manufacturer’s protocol, using the Profiler PCR Array System and SYBR Green/Fluorescein qPCR master mix (SABiosciences) in an ABI 7500 Fast sequence analyzer (Applied Biosystems). Gene expression was compared with the web-based software package for the PCR Array System (http://www.superarray.com/pcr/arrayanalysis.php), which automatically performs all ΔΔCt based fold-change calculations from the specific uploaded raw threshold cycle data.
Statistical analysis
The data presented are shown as means ± SD of three or five independent experiments. Statistical significance was estimated by Student's t test for unpaired observations and one- or two-way ANOVA, followed by Bonferroni's, Tukey's, or Dunnett's post-hoc comparisons. Differences were considered significant at when p values were < 0.05. All statistical analyses were conducted using GraphPad Prism 5.0 (GraphPad Software). For immunoblots, a linear correlation was observed between increasing amounts of input protein and signal intensity.
Supplementary Material
Disclosure of Potential Conflicts of Interest
No potential conflicts of interest were disclosed.
Acknowledgments
This study was supported by grant PI11.0036 from the FIS and MPY 1410/09 from ISCIII to S.H.
Supplemental Material
Supplemental material may be downloaded here:
www.landesbioscience.com/journals/oncoimmunology/article/21207
Glossary
Abbreviations:
- ARF
alternative reading frame
- Arg-1
arginase-1
- COX-2
cyclooxigenase-2
- Fizz-1
found in inflammatory zone 1
- IFNγ
interferon γ
- LPS
lipopolysaccharide
- MMR
mannose receptor
- MMP-9
matrix metalloproteinase-9
- M1
classically-activated macrophages
- M2
alternatively-activated macrophages
- NO
nitric oxide
- iNOS
inducible nitric oxide syntase
- PGE2
prostaglandin E2
- TAM
tumor-associated macrophages
- TIMP-3
metalloproteinase inhibitor 3
- TNFα
tumor necrosis factor α
- VEGF
vascular endotelial growth factor
- Ym1
chitinase 3-like 3
Footnotes
Previously published online: www.landesbioscience.com/journals/oncoimmunology/article/21207
References
- 1.Mantovani A, Sozzani S, Locati M, Allavena P, Sica A. Macrophage polarization: tumor-associated macrophages as a paradigm for polarized M2 mononuclear phagocytes. Trends Immunol. 2002;23:549–55. doi: 10.1016/S1471-4906(02)02302-5. [DOI] [PubMed] [Google Scholar]
- 2.Gordon S. Alternative activation of macrophages. Nat Rev Immunol. 2003;3:23–35. doi: 10.1038/nri978. [DOI] [PubMed] [Google Scholar]
- 3.Martinez FO, Helming L, Gordon S. Alternative activation of macrophages: an immunologic functional perspective. Annu Rev Immunol. 2009;27:451–83. doi: 10.1146/annurev.immunol.021908.132532. [DOI] [PubMed] [Google Scholar]
- 4.Martinez FO, Sica A, Mantovani A, Locati M. Macrophage activation and polarization. Front Biosci. 2008;13:453–61. doi: 10.2741/2692. [DOI] [PubMed] [Google Scholar]
- 5.Raes G, De Baetselier P, Noël W, Beschin A, Brombacher F, Hassanzadeh Gh G. Differential expression of FIZZ1 and Ym1 in alternatively versus classically activated macrophages. J Leukoc Biol. 2002;71:597–602. [PubMed] [Google Scholar]
- 6.Nair MG, Cochrane DW, Allen JE. Macrophages in chronic type 2 inflammation have a novel phenotype characterized by the abundant expression of Ym1 and Fizz1 that can be partly replicated in vitro. Immunol Lett. 2003;85:173–80. doi: 10.1016/S0165-2478(02)00225-0. [DOI] [PubMed] [Google Scholar]
- 7.Través PG, López-Fontal R, Luque A, Hortelano S. The tumor suppressor ARF regulates innate immune responses in mice. J Immunol. 2011;187:6527–38. doi: 10.4049/jimmunol.1004070. [DOI] [PubMed] [Google Scholar]
- 8.Munder M, Eichmann K, Modolell M. Alternative metabolic states in murine macrophages reflected by the nitric oxide synthase/arginase balance: competitive regulation by CD4+ T cells correlates with Th1/Th2 phenotype. J Immunol. 1998;160:5347–54. [PubMed] [Google Scholar]
- 9.Sharpless NE. INK4a/ARF: a multifunctional tumor suppressor locus. Mutat Res. 2005;576:22–38. doi: 10.1016/j.mrfmmm.2004.08.021. [DOI] [PubMed] [Google Scholar]
- 10.Kamijo T, Zindy F, Roussel MF, Quelle DE, Downing JR, Ashmun RA, et al. Tumor suppression at the mouse INK4a locus mediated by the alternative reading frame product p19ARF. Cell. 1997;91:649–59. doi: 10.1016/S0092-8674(00)80452-3. [DOI] [PubMed] [Google Scholar]
- 11.Kamijo T, Bodner S, van de Kamp E, Randle DH, Sherr CJ. Tumor spectrum in ARF-deficient mice. Cancer Res. 1999;59:2217–22. [PubMed] [Google Scholar]
- 12.García MA, Collado M, Muñoz-Fontela C, Matheu A, Marcos-Villar L, Arroyo J, et al. Antiviral action of the tumor suppressor ARF. EMBO J. 2006;25:4284–92. doi: 10.1038/sj.emboj.7601302. [DOI] [PMC free article] [PubMed] [Google Scholar]
- 13.Chang CI, Liao JC, Kuo L. Macrophage arginase promotes tumor cell growth and suppresses nitric oxide-mediated tumor cytotoxicity. Cancer Res. 2001;61:1100–6. [PubMed] [Google Scholar]
- 14.Rodríguez PC, Ochoa AC. Arginine regulation by myeloid derived suppressor cells and tolerance in cancer: mechanisms and therapeutic perspectives. Immunol Rev. 2008;222:180–91. doi: 10.1111/j.1600-065X.2008.00608.x. [DOI] [PMC free article] [PubMed] [Google Scholar]
- 15.Zea AH, Rodriguez PC, Atkins MB, Hernandez C, Signoretti S, Zabaleta J, et al. Arginase-producing myeloid suppressor cells in renal cell carcinoma patients: a mechanism of tumor evasion. Cancer Res. 2005;65:3044–8. doi: 10.1158/0008-5472.CAN-04-4505. [DOI] [PubMed] [Google Scholar]
- 16.Lepique AP, Daghastanli KR, Cuccovia IM, Villa LL. HPV16 tumor associated macrophages suppress antitumor T cell responses. Clin Cancer Res. 2009;15:4391–400. doi: 10.1158/1078-0432.CCR-09-0489. [DOI] [PubMed] [Google Scholar]
- 17.Ochoa AC, Zea AH, Hernandez C, Rodriguez PC. Arginase, prostaglandins, and myeloid-derived suppressor cells in renal cell carcinoma. Clin Cancer Res. 2007;13:721s–6s. doi: 10.1158/1078-0432.CCR-06-2197. [DOI] [PubMed] [Google Scholar]
- 18.Liu T, Dhanasekaran SM, Jin H, Hu B, Tomlins SA, Chinnaiyan AM, et al. FIZZ1 stimulation of myofibroblast differentiation. Am J Pathol. 2004;164:1315–26. doi: 10.1016/S0002-9440(10)63218-X. [DOI] [PMC free article] [PubMed] [Google Scholar]
- 19.Webb DC, McKenzie AN, Foster PS. Expression of the Ym2 lectin-binding protein is dependent on interleukin (IL)-4 and IL-13 signal transduction: identification of a novel allergy-associated protein. J Biol Chem. 2001;276:41969–76. doi: 10.1074/jbc.M106223200. [DOI] [PubMed] [Google Scholar]
- 20.Hiratsuka S, Nakamura K, Iwai S, Murakami M, Itoh T, Kijima H, et al. MMP9 induction by vascular endothelial growth factor receptor-1 is involved in lung-specific metastasis. Cancer Cell. 2002;2:289–300. doi: 10.1016/S1535-6108(02)00153-8. [DOI] [PubMed] [Google Scholar]
- 21.Kawagishi H, Nakamura H, Maruyama M, Mizutani S, Sugimoto K, Takagi M, et al. ARF suppresses tumor angiogenesis through translational control of VEGFA mRNA. Cancer Res. 2010;70:4749–58. doi: 10.1158/0008-5472.CAN-10-0368. [DOI] [PubMed] [Google Scholar]
- 22.Fatyol K, Szalay AA. The p14ARF tumor suppressor protein facilitates nucleolar sequestration of hypoxia-inducible factor-1alpha (HIF-1alpha ) and inhibits HIF-1-mediated transcription. J Biol Chem. 2001;276:28421–9. doi: 10.1074/jbc.M102847200. [DOI] [PubMed] [Google Scholar]
- 23.Zerrouqi A, Pyrzynska B, Febbraio M, Brat DJ, Van Meir EG. P14ARF inhibits human glioblastoma-induced angiogenesis by upregulating the expression of TIMP3. J Clin Invest. 2012;122:1283–95. doi: 10.1172/JCI38596. [DOI] [PMC free article] [PubMed] [Google Scholar]
- 24.Mantovani A, Sica A, Sozzani S, Allavena P, Vecchi A, Locati M. The chemokine system in diverse forms of macrophage activation and polarization. Trends Immunol. 2004;25:677–86. doi: 10.1016/j.it.2004.09.015. [DOI] [PubMed] [Google Scholar]
- 25.Zeini M, Través PG, López-Fontal R, Pantoja C, Matheu A, Serrano M, et al. Specific contribution of p19(ARF) to nitric oxide-dependent apoptosis. J Immunol. 2006;177:3327–36. doi: 10.4049/jimmunol.177.5.3327. [DOI] [PubMed] [Google Scholar]
- 26.Cuadrado I, Cidre F, Herranz S, Estevez-Braun A, de las Heras B, Hortelano S. Labdanolic acid methyl ester (LAME) exerts anti-inflammatory effects through inhibition of TAK-1 activation. Toxicol Appl Pharmacol. 2012;258:109–17. doi: 10.1016/j.taap.2011.10.013. [DOI] [PubMed] [Google Scholar]
- 27.Tai SK, Chang HC, Lan KL, Lee CT, Yang CY, Chen NJ, et al. Decoy receptor 3 enhances tumor progression via induction of tumor-associated macrophages. J Immunol. 2012;188:2464–71. doi: 10.4049/jimmunol.1101101. [DOI] [PubMed] [Google Scholar]
- 28.Través PG, López-Fontal R, Cuadrado I, Luque A, Boscá L, de Las Heras B, et al. Critical role of the death receptor pathway in the antitumoral effects induced by hispanolone derivatives. Oncogene. 2012 doi: 10.1038/onc.2012.23. [DOI] [PubMed] [Google Scholar]
Associated Data
This section collects any data citations, data availability statements, or supplementary materials included in this article.


