Abstract
Single-molecule total internal reflection fluorescence microscopy was used to observe the dynamic behavior of (poly)-cytosine ssDNA (1–50 nucleotides long) at the interface between aqueous solution and hydrophilic (oligoethylene oxide-modified fused silica, OEG) and hydrophobic (octadecyltriethoxysilane-modified fused silica, OTES) solid surfaces. High throughput molecular tracking was used to determine >75,000 molecular trajectories for each molecular length, which were then used to calculate surface residence time and squared displacement (i.e. “step-size”) distributions. On hydrophilic OEG surfaces, the surface residence time increased systematically with ssDNA chain length, as expected due to increasing molecule-surface interactions. Interestingly, the residence time decreased with increasing ssDNA length on the hydrophobic OTES surface, particularly for longer chains. Similarly, the interfacial mobility of polynucleotides slowed with increasing chain length on OEG, but became faster on OTES. On OTES surfaces, the rates associated with desorption and surface diffusion exhibited the distinctive anomalous temperature dependence that is characteristic of hydrophobic interactions for short chain species but not for longer chains. These combined observations suggest that long oligonucleotides adopt conformations minimizing hydrophobic interactions, e.g. by internal sequestration of hydrophobic nucleobases.
INTRODUCTION
Biosensors and other diagnostic technologies often rely on the interactions of nucleic acids in the vicinity of interfaces. For example, deoxyribonucleic acid (DNA) microarray technology has rapidly become an indispensable tool for studies of genetic content because they permit the simultaneous multiplexed analysis of large numbers of nucleic acid fragments.1 Microarrays cover a wide range of applications including genotyping,2 detection of single nucleotide variations in a DNA sequence (single-nucleotide polymorphism),3, 4 and analysis of gene expression networks.5, 6 Recent single molecule sequencing-by-synthesis technologies represent a massive parallelization of the array approach, potentially permitting even higher data densities.7 DNA-based technologies typically require nucleotides or oligonucleotides (generally less than 100 bases long8) to form Watson-Crick base-pairing complexes with surface-immobilized nucleic acids with a very high degree of specificity; concurrent non-specific adsorption results in background noise or errors. Therefore, surface coatings should encourage base-pairing by inducing molecular conformations that favor hybridization and by enabling adsorbed ssDNA to explore large regions of the surface (e.g. long residence time and high mobility). Recent theoretical work suggests that subtle details of surface mobility can have significant effects with respect to the efficiency of this “targeting” process.8–10 At the same time, these surfaces should be designed to inhibit irreversible non-specific DNA adsorption as much as possible. However, because DNA is structurally complex and can engage in many competing non-covalent interactions with a surface, the optimal type of surface chemistry is not immediately apparent.
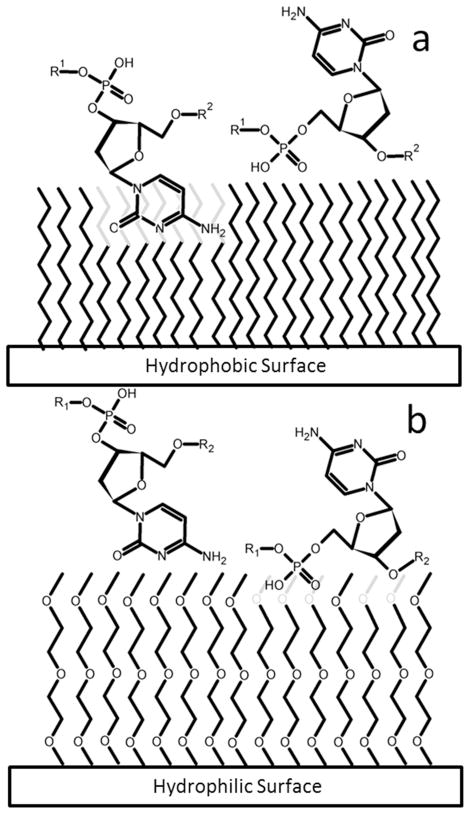
The largest contributors to DNA-surface interaction are hydrophobic interactions, hydrogen bonding (H-bonding), and van der Waals interactions.11 Figure 1 schematically illustrates some ways in which these interactions may influence dynamic behavior on surfaces. ssDNA is highly flexible with a statistical segment length of one monomer unit and has the ability to expose either the phosphodiester backbone or nucleobases to a surface. The nucleobases, consisting of either one (pyrimidine) or two (purine) aromatic rings, are significantly more hydrophobic than the phosphate backbone and exhibit an affinity to non-polar environments.12 Thus, molecular conformations that minimize nucleobase exposure are preferred in aqueous solution. Similarly, exposed nucleobases are expected to interact relatively weakly with a non-H-bonding hydrated hydrophilic surface (Figure 1b) and more strongly with a hydrophobic surface (Figure 1a). The opposite is true for the phosphodiester backbone (Figures 1a,b). 9, 10
Figure 1.
A schematic diagram of hypothetical surface interactions for the nucleobase cytosine (left molecule) and the phosphate backbone (right molecule). The surfaces represent (a) a non-hydrogen-bonding hydrophobic surface, and (b) a non-hydrogen-bonding hydrophilic surface, All chains in the surface layer are the same length; the “shorter” apparent chains are intended to demonstrate immersion/intercalation of the adsorbate within the monolayer.
Hydrophobic interactions are mediated by water and tend to cause hydrophobic molecules to cluster in aqueous conditions.13 These interactions are complex and manifest in different ways depending on the attributes (such as molecular size) of the model system.14 For large biomolecules, the thermodynamic aspects of the hydrophobic effect are critically important determinants of molecular conformation and stability.15 The hydrophobic effect also exhibits a unique, non-Arrhenius temperature dependence. In particular, hydrophobic interactions typically increase in strength up to a maximum at 293–303K as a result of increasing enthalpic contributions. Above 303K enhanced entropic contributions result in a decrease in the strength of hydrophobic interactions.14, 16 Therefore, a distinctive anomalous non-monotonic temperature behavior is generally observed in systems dominated by hydrophobic interactions. For example, Haidacher et al. observed non-monotonic temperature-dependence of the retention time of a model hydrophobic probe molecule using several hydrophobic interaction chromatography columns.15
In this work, oligoethyleneglycol-modified fused silica (OEG), and n-octadecyltriethoxysilane-modified fused silica (OTES) were used to probe the effects of hydration, and hydrophobicity, respectively, on dynamic behavior associated with ssDNA-surface interactions. Since short oligonucleotides are highly constrained due to steric hindrance, while long oligonucleotides have greater conformational freedom, the effects of molecular conformation were explored by studying the interfacial behavior of oligonucleotides as a function of molecular weight.
EXPERIMENTAL DETAILS
Materials
Methoxy(triethyleneoxy)propyltrimethoxysilane (OEG, 95% pure) and n-octadecyltriethoxysilane (OTES, 95% pure) were obtained from Gelest. n-Butylamine (99.5% pure) was obtained from Sigma-Aldrich. Micro 90 cationic detergent was obtained from International Product Corp. All other chemicals were Optima grade from Fisher Scientific. All chemicals were used as received without further purification or modification. Aqueous solutions were prepared with water purified to 18 MΩ cm−1 using a Millipore Milli-Q system. Alexa488-modified deoxycytidine triphosphate (dCTP, Invitrogen) was used as the single nucleotide probe, and Alexa488-modified poly-cytosine 5-mer, 10-mer, 25-mer, and 50-mer species were used to investigate the effects of ssDNA chain length. DNA solutions were prepared in Milli-Q water to concentrations of 10−10 M to achieve low enough surface densities for single-molecule experiments.
Surface Preparation
Fused silica (FS, Mark optics) wafers were washed in a 2% Micro 90 solution and scrubbed with a Kim-wipe prior to rinsing with copious amounts of Milli-Q water. The wafers were then washed with fresh isopropanol followed by drying with ultrapure nitrogen. Wafers were then placed in a piranha solution (3:1 sulfuric acid:hydrogen peroxide) at approximately 70 °C for 1 h followed again by copious rinsing with Milli-Q water and drying with ultrapure nitrogen. The dry wafers underwent UV-ozone treatment for 1 h. Following the UV-ozone cleaning, FS wafers were either modified with a monolayer of methoxy(triethyleneoxy)propyltrimethoxysilane (OEG), n-octadecyltriethoxysilane (OTES), or 3-Glycidoxypropyltirmethoxysilane (GPTMS). To form OEG monolayers via solvent-assisted vapor deposition, a 1:2:20 solution by volume, of n-butylamine:OEG:toluene was placed in the bottom of a 250 ml glass jar. The sample was then placed on the mouth of the jar and the jar was sealed. The sample was left to deposit for 24h at room temperature. The preparation of GPTMS layers followed the same vapor deposition procedure, using a 1:2:20 solution of n-butylamine:GPTMS:toluene for 16–20 hours. n-Octadecyltriethoxysilane monolayers were deposited via liquid deposition for 1 h in a 1:2:20 solution by volume, of n-butylamine:OTES:toluene mixture heated to 70°C in a water bath.
Contact-Angle Measurements
Contact angles (CA) of all surfaces were measured with a custom-built contact-angle goniometer. A 1 μl drop of Milli-Q water was deposited on the surface in seven random locations on three separate samples; the averaged values and standard deviations are reported below. For unmodified FS samples almost complete wetting of the surface was observed (CA < 5°). The CA of the OEG-modified FS was 18° ± 3° as expected for relatively short methoxy-terminated PEG molecules (MW = 236); longer methoxy-terminated PEG silanes (MW ~ 460–590) have been reported to exhibit somewhat larger contact angles of 36° ± 1°.17 The CA for GPTMS was 54° ± 3° corresponding to a complete monolayer as measured by ellipsometry as discussed below. The CA of OTES modified FS surfaces was 108° ± 1°, which is characteristic of highly-ordered long-chain self-assembled monolayers.18, 19
Ellipsometry Measurements
A variable angle spectroscopic ellipsometer (V-VASE®, J.A. Woolam, Lincoln, NE, USA) was used to measure the thickness of silane thin films in air to assess the monolayer quality. For ellipsometry experiments, 2″ intrinsic silicon wafers (WRS Materials) were used as substrates for the thin film deposition described previously; the native oxide on these wafers is expected to be chemically similar to fused silica. An isotropic three interface optical model consisting of air, OEG/OTES, native silicon dioxide layer, and silicon, was used to fit the change in amplitude, Ψ, and change in phase, Δ, measured at angles from 60° to 80° at 5° degree intervals, spanning the spectroscopic range from wavelengths of 400nm to 900nm.20 The thickness of the native oxide layer was measured prior to surface modification. This technique gave an OEG layer thickness of 1.62 ± 0.02 nm which is similar to the theoretical length of a fully-extended molecule (~ 1.7 nm) calculated through molecular geometry (using nominal bond lengths and bond angles).21 The layer thickness of GPTMS was 0.9 ± 0.1 nm which is similar to both the fully extended molecular length and previously reported values.22 The layer thickness for the OTES layer was 1.81 ± 0.02 nm which is similar to typical literature values (~ 1.7 nm) as well as the theoretical length of a fully-extended OTES molecule (~ 2.1 nm).23
Microscopy Measurements
Total internal reflection fluorescence microscopy (TIRFM) measurements were performed on a custom-built prism-based microscope consisting of a Nikon TE-2000 microscope with a 60x water emersion objective and a 491 nm DPSS LASER oriented to produce a TIRF field when flow cell and prism are mounted on the microscope. This microscope configuration has been described in detail previously.24 The intensity of the illumination was adjusted to permit single fluorophore observation with a 100 ms acquisition time during sequential imaging, while also allowing continuous observation for several minutes without photobleaching. Since it was impossible to accurately measure residence times or diffusive trajectories of objects that resided on the surface for less than one frame (100 ms), all such species were removed from the data pool.
Photobleaching Rate Determination
Using the microscope setup described above, photobleaching studies were performed to determine the characteristic photobleaching time under typical imaging conditions. In this study fluorescein was used instead of its more photostable derivative, Alexa-488.25 The change in dye was necessary since DNA labeled with Alexa-488 cannot be amine modified due to chemical reactivity between the Alexa dye and amine modifier. Surfaces were initially prepared as described above using the GPTMS modification. Amine-modified ssDNA (16-mer poly-C) terminally modified with fluorescein, was then covalently attached to the epoxy-modified surface via a primary amine-epoxide ring-opening addition reaction. This was accomplished by immersing the epoxy-modified FS substrate into a pH 8–10, 50nM solution of the amine-modified ssDNA for 20 hours at ambient temperature. These surfaces were then vigorously cleaned using a sequence of rinses with acetone, ethanol, and toluene followed by 10 minute bath in boiling Milli-Q water. Imaging of the surface was then performed under continuous TIRF illumination at laser power similar to standard TIRF experiments. The interval for image acquisition was 4 s and imaging was performed for 600 s. Single molecules were identified on a frame by frame basis, counted, and tabulated versus time. If a molecule disappeared for one or more frames but then reappeared in the same position, that molecule was considered to have undergone a blinking event as opposed to actual photobleaching. The results were then plotted and fit using an exponential decay as expected from a first order kinetics model, (see Supplementary Information Figure S1). The characteristic photobleaching time (i.e. the inverse photobleaching rate) for fluorescein was determined to be 290 ± 10 s. Alexa-488 is more photostable than fluorescein, so this characteristic photobleaching time (290s) represents a lower limit for the photobleaching time constant of Alexa-488 modified ssDNA. Since this time constant is more than an order of magnitude larger than that of the longest residence time mode for Alexa-488 modified ssDNA (~14s), we conclude that the observed residence times were representative of actual desorption events, and not an artifact of photobleaching.
Data Analysis
Diffraction-limited objects were identified by a disk matrix and thresholding algorithm on a frame by frame basis.26 Center-of-intensity calculations were used to determine object locations in each frame. An object that appeared within 3 pixels (681nm) in consecutive frames was identified as the same object for purposes of tracking. At least 75,000 molecular trajectories were obtained for each probe molecule on each type of surface. Only objects that were directly observed to both adsorb and desorb were used in the analysis to eliminate uncertainty with respect to the surface residence time. The surface residence time of each object was calculated as the number of frames in which the object was identified multiplied by the exposure time (100ms) to convert to units of time. Since an object may not reside in the initial and/or final frames for the entire exposure time of that frame, the uncertainty in the residence time was taken to be the exposure time divided by √2.
The cumulative residence time distribution was modeled using a multi-exponential function, where the coefficient of each term represents a population fraction (fi) and the time constant represents the characteristic residence time (τi) of that population (Eqn. 2).
| (2) |
The error for each data point in the distribution represents a 68% confidence interval for a Poisson distribution. Mean residence times were calculated by a weighted average of the residence times of all observed populations. A more detailed discussion of this analysis was given previously.27
The squared-displacement was calculated for each step of each trajectory. Experimental cumulative squared-displacement distributions were created by sorting the squared-displacement data and ranking each data point 24. The error for each data point in the distribution represents a 68% confidence interval for a Poisson distribution. The cumulative distribution was then fitted to a multiple-Gaussian function to extract population fractions (xj) and their respective diffusion coefficients (Dj). A more detailed discussion of this analysis was given previously (Eqn. 3).24, 27
| (3) |
Molecular Modeling
ssDNA conformations were explored using Spartan® molecular modeling software. In these analyses, 5-mer, 10-mer, 25-mer, and 50-mer poly-C chains were created, initially in an elongated conformation. Each molecule was then folded by rotating the molecule about chemical bonds in such a way to expose the maximum surface area of the phosphodiester backbone while attempting to internalize the nucleobases in a “micelle-like” conformation. Embedded Merck Molecular Force Field (MMFF) energy minimization calculations were run periodically throughout the folding process to anneal the structure. MMFF calculations account for bond stretching, angle bending, stretch-bend interactions, out-of-plane bending, torsion interactions, van der Waals interactions, and electrostatic interactions.28 This procedure ignored the inherent stiffness of the ssDNA chain due to electrostatic interactions that lead to a persistence length of ~2 nm under the conditions of the experiment.29 Therefore, the resulting structures, while indicative of a systematic trend, represent limiting cases that are more compact than the true molecular conformations.
Spartan® molecular modeling software was also used to examine the electrostatic potential map of each of the surface modification ligands. To create an electrostatic potential map, Spartan® combines the electron density and electrostatic potential surfaces. Electron density defines the molecular shape and size, performing a similar function to a space-filling model. The electrostatic potential energy (|ΔU|) at a point on the electron density surface is given by the electrostatic potential energy between an imaginary positively charged ion and the molecule. If the ion is attracted to the molecule then the potential is negative. Spartan® calculates the electrostatic potential at selected points along the electron density surface creating a rainbow color coded surface potential map with arbitrary units, creating a model describing the molecule’s size and shape as well as its charge. Using the electrostatic potential map, the polar surface area was measured for each surface-modifying ligand.
RESULTS AND DISCUSSION
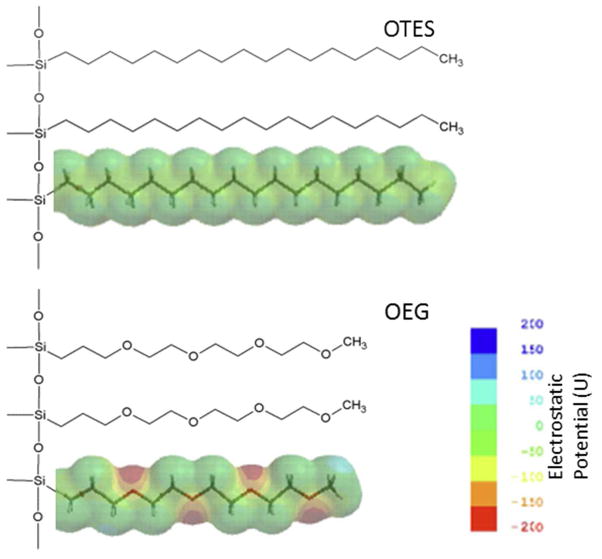
Two types of model surface were employed to explore the effects of polarity on ssDNA-surface interactions (Figure 2). The OTES represented an effectively non-polar environment, with calculations giving a polar surface area (PSA) of 0 Å2/molecule, and a maximum molecular surface electrostatic potential of |ΔU| ≈ 10 as defined above. This was consistent with the measured value of the water contact angle (108°). The OEG surface represented a hydrophilic case with |ΔU| ≈ 210 and a PSA of 28 Å2/molecule, again consistent with the water contact angle of 16°. The similarities in the molecular lengths of OTES (18.1 ± 0.2 Å) and OEG (16.2 ± 0.2 Å) provided similar opportunities for ssDNA molecules to intercalate within the “soft layer” of both model surfaces.
Figure 2.
Chemical structure and electrostatic potential map of model surfaces OTES (top), OEG (bottom).
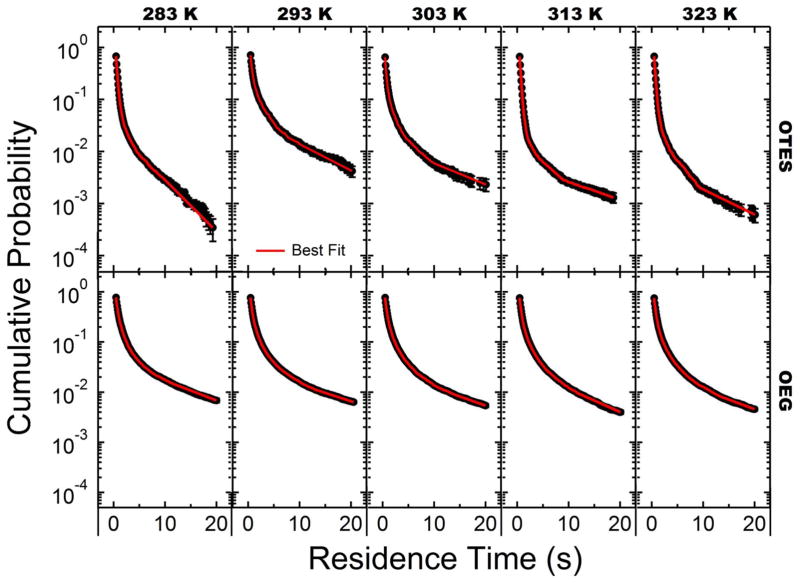
The cumulative surface residence time distributions for the monomer probe molecule dCTP (C1), and poly-cytosine 5-mer (C5), 10-mer (C10), 25-mer (C25), and 50-mer (C50) on each model surface (OEG and OTES) were calculated as described above from raw molecular trajectories. Representative residence time distributions for C5 on OTES and OEG are shown in Figure 3 for temperatures ranging from 282–323K. On these semi-log plots, a straight line would indicate first-order desorption kinetics; the observed deviation from this behavior indicates the presence of multiple populations with unique characteristic residence times. In each instance, a distinct dependence of residence time on temperature was observed. For OTES surfaces (Figure 3, top row), the residence time distribution initially shifted “upwards” to longer times with temperature in the range of 283–293K, and then shifted systematically “downwards” to shorter times as temperature was increased further in the range of 293–323K. This distinctive non-monotonic trend was observed for the residence time distributions of both C1 and C5 with a peak between 293–303K. This non-monotonic behavior was not observed for the OEG surface. On the OEG surface a slight shift to longer residence times was observed over the entire observed temperature range 283–323K (Figure 3, bottom row). The non-monotonic behavior observed on the OTES surface with a peak at 293–303K is a known characteristic of hydrophobic interactions.14, 16
Figure 3.
Semi-log plots of the cumulative surface residence time distributions of C5, on OTES-modified fused silica (top row), and OEG-modified fused silica (bottom row).
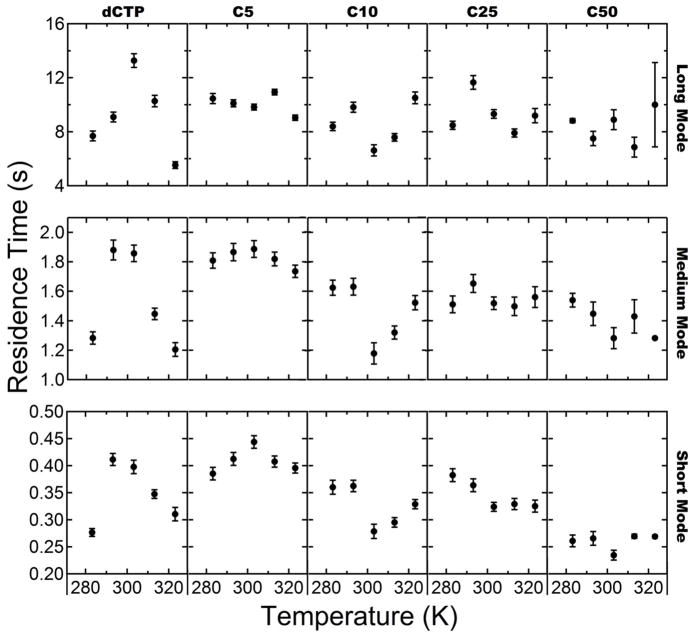
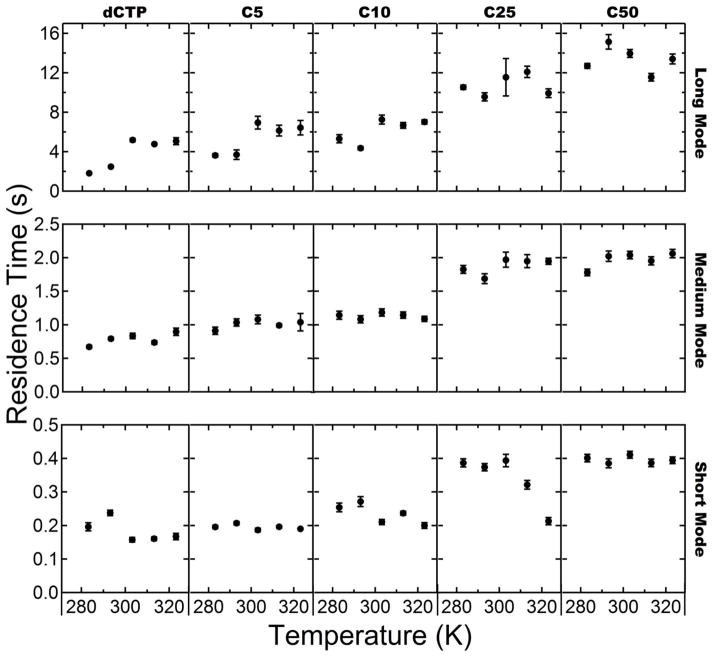
The cumulative residence time distributions (terminated at the 99.9 percentile) were fit with a triple-exponential function as described above to characterize each observed population with a characteristic residence time and population fraction (see Table S1 and S2 in the Supporting Information for exact values). Interestingly, the population fractions changed only modestly with molecular size. However, significant shifts were observed in the characteristic residence times and these shifts were the dominant factor in changes in the residence time distribution for each probe-surface combination. The characteristic residence times for each mode are shown as a function of molecular length and temperature on OTES (Figure 4) and OEG (Figure 5).
Figure 4.
Characteristic residence time versus temperature for OTES surface. From left to right columns show data for dCTP, C5, C10, C25, C50. Rows from top to bottom represent the long, medium, and short residence time modes respectively.
Figure 5.
Characteristic residence time versus temperature for OEG surface. From left to right columns show data for dCTP, C5, C10, C25, C50. Rows from top to bottom represent the long, medium, and short residence time modes respectively.
In all cases, a short-lived fraction, representing the majority of the adsorbing molecules (>70%), exhibited a characteristic residence time in the range 0.15–0.45s. A second population, representing roughly 10–20% of adsorbing molecules had a residence time in the range 0.65–1.90s, and a relatively rare (<4% of all molecules) long-lived population had a residence time of 1.80–15.20s.
Inspection of the characteristic residence times on OTES (Figure 4) revealed that most populations of the smaller probe molecules (dCTP and C5) exhibited the non-monotonic temperature-dependence characteristic of hydrophobic interactions. This behavior was not observed for poly-C longer than C5. The juxtaposition of the non-monotonic temperature dependence of shorter chain species and the linear temperature dependence of longer chain species suggests that shorter chain surface behavior is dominated by hydrophobic interactions while longer chain lengths are not.
Dynamic behavior for varying poly-C lengths on hydrophilic OEG is shown in Figure 5, which displays the residence time for each population as a function of temperature and chain length. In contrast to the hydrophobic OTES surface, no non-monotonic temperature-dependence was observed for any probe molecule. In fact, for any given molecular species, only very modest changes with temperature were observed, suggesting that, for all chain lengths and residence modes, the surface behavior on OEG was not dominated by hydrophobic interactions. This is expected since the OEG surface is hydrophilic and should exhibit van der Waals forces as the primary interaction with the probe molecules.
Figure 4 and Figure 5 also exhibit an interesting (and opposite) dependence of nucleotide-surface interactions on molecular length. OEG surfaces exhibit increasing residence times with increasing ssDNA chain length, while OTES surfaces generally demonstrate the opposite trend (particularly for C10–C50). This dependence on molecular size is visually apparent by scanning across each row of the Figures 4 and 5. A direct comparison of absolute residence time shows that the lower molecular weight cytosine species (C1–C10) reside for longer periods on the OTES surface than the OEG surface, emphasizing the importance of hydrophobic interactions for smaller oligonucleotides. This suggests that short chain species adopt conformations that allow for the hydrophobic moieties of the amphiphilic ssDNA molecule to interact favorably with the more hydrophobic surface, resulting in longer residence times. However, for the longer C25–C50 species, the opposing trends with molecular weight on hydrophilic and hydrophobic surfaces lead to a situation where residence times on OTES actually become shorter than on OEG. As discussed further below, we hypothesize that the molecular conformations favored by longer oligonucleotides (e.g. more compact molecular configurations) limit the amount of exposed hydrophobic moieties, reducing the favorable interactions with hydrophobic surfaces, with a concomitant reduction in the surface residence time.
Surface mobility provides complementary information about interactions between probe molecules and surfaces. Previous work by our group suggests that several mechanisms may be involved in surface diffusion. In one mode (“flying”), a molecule undergoing surface diffusion partially or completely detaches from the surface.30, 31 permitting the molecule to bypass potential barriers. Another mode (“crawling”) involves local motions without detachment.31 For a hydrophobic molecule on a hydrophobic surface, the “crawling” mode was found to be essentially activation-less,30 consistent with a very smooth laterally-homogeneous surface potential and the relatively long-range nature of the hydrophobic interaction, which tends to smooth the lateral variations of the local potential.
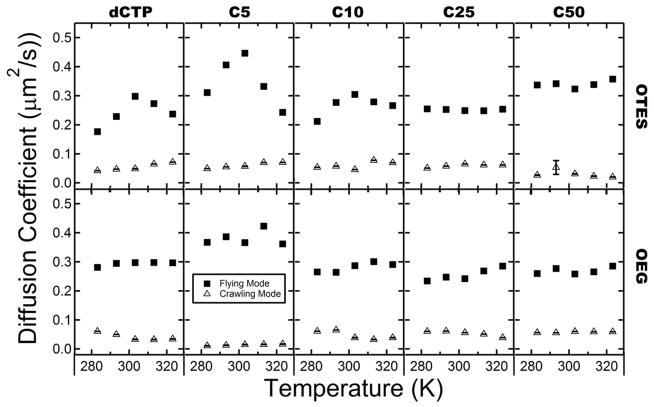
Cumulative squared-displacement distributions were calculated for each probe/surface combination as described previously (see Supplementary Information Figure S2). These distributions were then terminated at the 99.9 percentile and fit to a double-exponential function as described above to characterize each diffusive mode.27 The calculated effective diffusion coefficients for each mode are shown in Figure 6 versus temperature for each ssDNA molecular length (see Table S3 and S4 in the Supporting Information for exact values). As expected, for all ssDNA-surface combinations, the experimental surface diffusion coefficients were smaller than reported 3D diffusion coefficients in solvent by a factor of 100–1000.8
Figure 6.
Diffusion coefficients versus temperature for each surface/probe combination. From left to right columns show data for dCTP, C5, C10, C25, C50. Rows from top to bottom represent data for surfaces OTES and OEG
The crawling mode diffusion coefficients showed little dependence on temperature or chain length on either hydrophobic or hydrophilic surfaces. The diffusion coefficients for the crawling mode were ~0.05 μm2/s. For small values of the diffusion coefficient, the phenomenon of apparent diffusion becomes increasingly important. Apparent diffusion is the perceived motion of molecules due to the inability to perfectly localize an object spatially and can be estimated by taking the square of the positional uncertainty (~60 nm in our system) divided by the frame rate (0.1 s), giving ~0.04 μm2/s in this case. Previous work performed with fibrinogen found that even relatively immobile populations had an apparent diffusivity of similar magnitude.32 Thus, the measured values of the diffusion coefficient associated with the crawling diffusion mode are near the limit for accurate measurement under the current experimental conditions. Therefore, it would be difficult to draw significant conclusions regarding the temperature dependence of the crawling diffusion mode.
However, the flying mode diffusion coefficients for C1–C10 exhibited a distinctive non-monotonic temperature-dependence peaking at 303K. This non-monotonic behavior is again indicative of dominant hydrophobic interactions between OTES and short-chain poly-C. This non-monotonic behavior was not observed for the C25 and C50 species, whose diffusion coefficients varied only modestly with temperature. Again, a transition was observed at the C10 length from dynamics dominated by hydrophobic interactions to van der Waals interactions. This further supports the hypothesis that longer ssDNA molecules adopt conformations that minimize the amount of exposed hydrophobic surface area available to interact with the surface. In contrast to the behavior on hydrophobic surfaces, the diffusion coefficients of all probes on the OEG surface exhibited a statistically-insignificant dependence on temperature. This lack of temperature-dependence again suggests that, as expected, the surface behavior on OEG was not dominated by hydrophobic interactions for any chain length or diffusive mode.
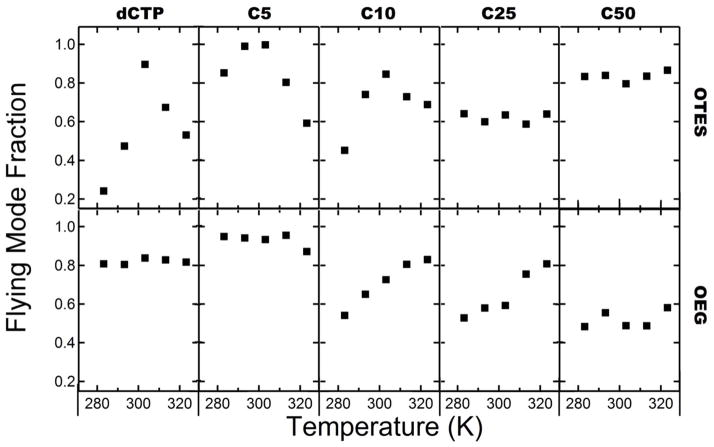
On OTES surfaces, the mean diffusion coefficient increased systematically with molecular length. In contrast, they decreased with molecular length on OEG surfaces. Since two diffusive modes were observed for most species, changes in the mean diffusion coefficient can be due to changes in the diffusion coefficients of the various modes, the fraction of “steps” corresponding to the different modes, or a combination of both. The fraction of the steps corresponding to the flying diffusive mode is plotted versus temperature for each probe surface combination in Figure 7. A detailed analysis revealed that both the diffusion coefficients of the flying mode as well as the mode fractions were sensitive to changes in ssDNA chain length and temperature. The overall trends in the flying mode fraction shown in Figure 7 exactly mirror those in Figure 6 for the flying mode diffusion coefficient, suggesting that both the mode fraction and diffusion coefficient of polynucleotides are affected by surface hydrophobicity. In particular, the increase of the surface mobility on OTES surface with molecular size was due both to the increased diffusivity of the flying mode as well as an increase in the flying mode fraction. Similarly, on OEG surfaces, the diffusivity of the flying mode and the flying mode fraction both decreased with molecular length. Notably, non-monotonic temperature-dependence was again observed for the flying mode fraction of short chains on OTES.
Figure 7.
Fraction of population in flying mode versus temperature for each surface/probe combination. From left to right columns show data for dCTP, C5, C10, C25, C50. Rows from top to bottom represent data for surfaces OTES and OEG
The diffusion coefficient trends observed on OEG and OTES surfaces were consistent with those previously described for the mean surface residence time. For OEG, decreasing mobility and longer surface residence times were both consistent with increasing molecule-surface interactions as a function of molecular length. For OTES, the opposite was true; increasing mobility and shorter surface residence reflected a decreasing molecule-surface interaction with molecular length. In the study by Honciuc et al. it was observed that as surfactant size increased so did the diffusion coefficient on hydrophobic surfaces.30 Honciuc’s work also demonstrated hydrophobic collapse of the longest chain fatty acid species (BODIPY-(CH2)n-COOH n ≥ 12) resulted in an anomalously low activation barrier to diffusion. This suggests that the apparent increase in diffusion with increasing ssDNA chain length on OTES is the result of hydrophobic collapse of the long chain DNA into a more compact conformation. While van der Waals interactions increase monotonically with the size of the ssDNA molecule, the hydrophobic collapse of long-chain ssDNA (which sequesters the nucleobases within a hydrophobic core) reduces hydrophobic exposure. As discussed earlier, this would reduce the corrugation of the interaction energy, and therefore the apparent activation energy for diffusion.30, 31
These observations are not limited to oligonucleotides containing primarily cytosine residues. It is expected that, for short chain lengths, hydrophobic interactions would influence characteristic residence time and diffusion coefficients for ssDNA of any composition. For example, qualitatively-similar observations were made for poly-adenosine (polyA), where opposing trends in residence time were again observed vs. chain length on OTES and OEG. The cross-over (where residence time on OEG became longer on OEG than on OTES) for polyA occurred for slightly shorter chains than for polyC, consistent with the greater hydrophobicity of adenosine as compared to cytosine. In general, therefore, it is expected that the observed trends would be independent of sequence composition. However, subtle details, e.g. critical chain lengths, are expected to be sequence-dependent.
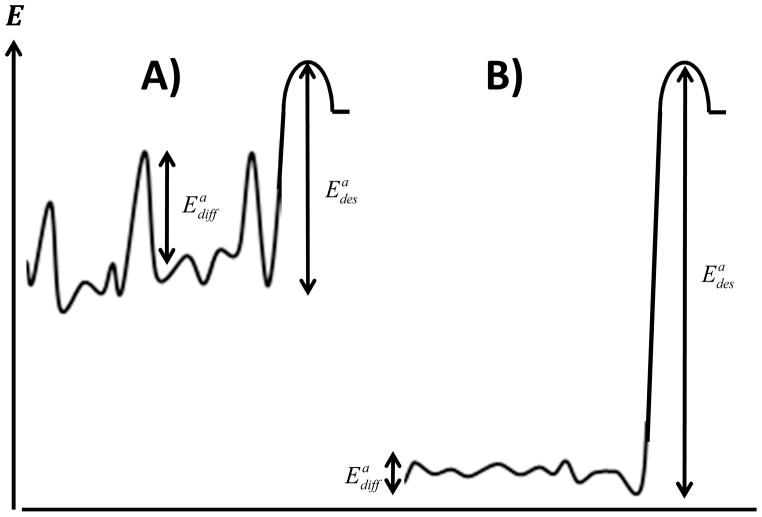
Interestingly, the temperature trends of short chain species C1–C5 on OTES demonstrated an increase in both residence time as well as flying mode diffusion up to 303 K followed by a decrease in both dynamic parameters. As discussed previously, the extremely slow diffusion associated with the crawling mode made this analysis inconclusive for that mode. One might naively expect that an increase in residence time should always be accompanied by slower surface diffusion. However, recent molecular dynamics studies performed by the Garde group for hydrophobic molecules interacting with surfaces found that as the hydrophobicity of the surface was increased, molecules were bound more strongly, but also exhibited greater lateral mobility.33 This behavior is presumably due to the orthogonal nature of the energy barriers associated with desorption vs. lateral diffusion. In particular, activation energies associated with desorption ( ) are related to the overall strength of molecular interactions normal to the surface while energy barriers associated with surface diffusion ( ) are associated with the corrugation of the energy landscape within the plane of the surface. For a surface dominated by short-range forces, such as van der Waals interactions, the energy profile of the surface would be highly corrugated due to short-range lateral variations in surface chemistry, resulting in large barriers to lateral motion (Figure 8a). In this scenario, the desorption rate and surface diffusion rate should parallel each other. This complementary behavior is observed for all species on the OEG surface as well as chains C10 and longer on the OTES surface. Conversely, longer range interactions, such as hydrophobic interactions, tend to smooth the lateral energy profile of a surface for diffusion (Figure 8b) leading to the opposite correlation between diffusion and desorption. In particular, an increase in hydrophobic interaction strength at low temperatures leads to both longer residence times and faster diffusion, and the opposite trend as the interaction strength decreases at higher temperatures.
Figure 8.
Schematic energy profiles of surfaces dominated by (a) short range interactions and (b) long range (hydrophobic) interactions. As the strength of hydrophobic interactions increases, the overall depth of the potential increases while also becoming smoother.
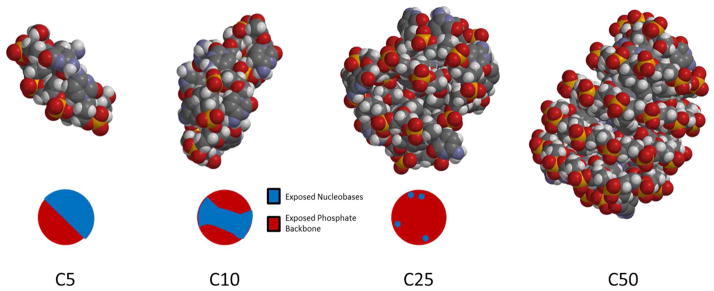
We suggested above that ssDNA may adopt conformations that minimize exposure of the hydrophobic nucleobases to the aqueous solvent. In order to schematically illustrate conformations that ssDNA can potentially adopt as a function of chain length, C5 – C50 molecules were folded in such a way as to minimize the solvent-exposed hydrophobic surface area. The results of this modeling experiment are shown in Figure 9. The structure of C5 – C10 is shown in Figure 9 and, as expected, the molecules are unable to adopt a structure that completely internalizes the nucleobases when using MMFF energy minimization. Instead, a “linear” structure is adopted for C5, and a “baseball” structure is adopted for C10, leaving a crescent of nucleobases exposed as indicated on the bottom of Figure 9. For C25 and C50, on the other hand, it was possible to internalize the nucleobases almost completely, leaving only a few exposed (Figure 9, C25).
Figure 9.
from left to right C5, C10, C25, C50 folded into structures minimizing exposure of hydrophobic moieties.
We emphasize that the structures shown in Figure 9 neglect some important structural features of ssDNA. In particular, the persistence length of ssDNA under the conditions of our experiments is expected to be ~2 nm.29 Using a contour length of ~5.6 Å per nucleotide,34 this suggests that groups of less than 4 nucleotides could be interpreted as approximately rigid rods. Thus the C5 and C10 species would be relatively rigid and have trouble internalizing the nucleobases as Figure 9 suggests. The longer chains would still be able to internalize the nucleobases though not necessarily in a globular structure suggested by the modeling study. Previous work in the literature has demonstrated that ssDNA can adopts either rod-like or globular conformations on surfaces when deposited out of polar solutions and imaged with atomic force microscopy.35 A molecular dynamics study on ssDNA conformation in water and PBS buffer, by Martinez et. al, found that increasing chain length promotes base-base stacking which would also internalize the nucleobases.36 These studies, as well as the molecular modeling described here, support the hypothesis that ssDNA adopts a molecular size limited conformation to hide the nucleobases when interacting with surfaces.
The trend illustrated in Figure 9 provides insight into the dynamic interfacial behavior described previously. Naively, one expects that larger molecules will have greater surface attraction, generally consistent with what is observed on hydrophilic surfaces. Indeed, regardless of whether the molecular conformation is extended, random coil, or micellar, the interaction strength between an oligonucleotide and an OEG surface is destined to increase with molecular length, due to increasing van der Waals contacts. However, on the OTES surface, where hydrophobic interactions are dominant, the hydrophobic overlap between adsorbed oligonucleotide and surface may actually decrease as the molecular size increases due to the enhanced ability of the longer molecule to sequester hydrophobic nucleobase moieties within the molecular interior.
CONCLUSIONS
In contrast with conventional ensemble-averaging techniques, single molecule tracking provides information about individual molecular populations, giving insights into molecular conformation and surface interactions that are otherwise lost. Since certain populations (even rare ones) may be disproportionately important for specific phenomena (e.g. DNA hybridization), this sort of population analysis is critical for the understanding of dynamic behavior of (poly)nucleotides at interfaces. In the experiments performed here, we found that dynamic interfacial properties of ssDNA (residence time and surface diffusion) were inherently dependent on the chain length of the probe nucleotide; sometimes in a non-intuitive way. This may be an important factor when designing genome sequencing or biosensing applications. Since longer oligonucleotides tend to form structures where nucleobases are sequestered internally, surfaces that encourage un-folding of the micelles may promote more efficient hybridization in the near surface region.
Techniques such as sequence-by-synthesis (genome sequencing) use nucleotide triphosphates as probe molecules. In these experiments it is important that molecules have short surface residence times to reduce surface sticking which leads to insertion errors. Thus, hydrophilic surface chemistries, similar to OEG, would appear to be desirable. Other attributes to consider include surface diffusion, which dictates the probe molecule’s ability to explore the surface to target a tethered capture molecule. OEG surfaces have the largest mean diffusion coefficient and thus, the most rapid surface exploration. These two factors suggest that for a sequence-by-synthesis technique using monomeric nucleotides, a hydrophilic non-hydrogen bonding surface similar to OEG is desirable. Due to the unusual temperature dependence of the hydrophobic effect, it is possible to control surface residence and diffusion rates in a system via temperature control. This provides another tool to potentially enhance throughput of microarray techniques. Thus, the information about nucleic acid surface dynamics provided by single molecule tracking gives new insight into the ways in which surface chemistry can be used to improve microarray and biosensor technology using short chain oligonucleotides.
Supplementary Material
Acknowledgments
The authors gratefully acknowledge support by the National Institutes of Health (1RC2HG005598-01), the National Institute of Biomedical Imaging and Bioengineering of the National Institutes of Health (1R21EB015061-01), and the National Science Foundation (award #CHE-0841116). We also thank Dr. Mark Kastantin for his invaluable assistance and Dr. Brian Jordan for insightful suggestions.
Footnotes
SUPPORTING INFORMATION AVAILABLE
Additional raw data and the numerical values of all parameters are presented in the supporting information, including data used to determine the photobleaching rate (Section I Figure S1), the detailed characteristic residence times of all populations (Section II Table S1 and S2), the diffusion coefficients of multiple modes (Section III Table S3 and S4) and their associated fractions. Representative raw cumulative squared-displacement distributions are also shown (Figure S2).This material is available free of charge via the internet at http://pubs.acs.org.
References
- 1.Brown PO, Botstein D. Nat Gen. 1999;21:33–37. doi: 10.1038/4462. [DOI] [PubMed] [Google Scholar]
- 2.Cutler DJ, Zwick ME, Carrasquillo MM, Yohn CT, Tobin KP, Kashuk C, Mathews DJ, Shah NA, Eichler EE, Warrington JA, Chakravarti A. Genome Res. 2001;11(11):1913–1925. doi: 10.1101/gr.197201. [DOI] [PMC free article] [PubMed] [Google Scholar]
- 3.Hacia JG, Fan JB, Ryder O, Jin L, Edgemon K, Ghandour G, Mayer RA, Sun B, Hsie L, Robbins CM, Brody LC, Wang D, Lander ES, Lipshutz R, Fodor SPA, Collins FS. Nat Gen. 1999;22(2):164–167. doi: 10.1038/9674. [DOI] [PubMed] [Google Scholar]
- 4.Syvanen AC. Nat Rev Gen. 2001;2(12):930–942. doi: 10.1038/35103535. [DOI] [PubMed] [Google Scholar]
- 5.Kirby J, Heath PR, Shaw PJ, Hamdy FC. Adv Clin Chem. 2007;44:247–292. doi: 10.1016/s0065-2423(07)44008-2. [DOI] [PubMed] [Google Scholar]
- 6.Schulze A, Downward J. Nat Cell Biol. 2001;3(8):E190–E195. doi: 10.1038/35087138. [DOI] [PubMed] [Google Scholar]
- 7.Bentley DR. Curr Opin Gen Dev. 2006;16(6):545–552. doi: 10.1016/j.gde.2006.10.009. [DOI] [PubMed] [Google Scholar]
- 8.Chan V, Graves DJ, McKenzie SE. Biophys J. 1995;69(6):2243–2255. doi: 10.1016/S0006-3495(95)80095-0. [DOI] [PMC free article] [PubMed] [Google Scholar]
- 9.Cardenas M, Braem A, Nylander T, Lindman B. Langmuir. 2003;19(19):7712–7718. [Google Scholar]
- 10.Eskilsson K, Leal C, Lindman B, Miguel M, Nylander T. Langmuir. 2001;17(5):1666–1669. [Google Scholar]
- 11.Melzak KA, Sherwood CS, Turner RFB, Haynes CA. J Colloid Interface Sci. 1996;181(2):635–644. [Google Scholar]
- 12.Maheswari PU, Rajendiran V, Palaniandavar M, Thomas R, Kulkarni GU. Inorg Chim Acta. 2006;359(14):4601–4612. [Google Scholar]
- 13.Kauzmann W. Adv Prot Chem. 1959;14:1–63. doi: 10.1016/s0065-3233(08)60608-7. [DOI] [PubMed] [Google Scholar]
- 14.Chandler D. Nature. 2005;437(7059):640–647. doi: 10.1038/nature04162. [DOI] [PubMed] [Google Scholar]
- 15.Haidacher D, Vailaya A, Horvath C. Proc Natl Acad Sci USA. 1996;93(6):2290–2295. doi: 10.1073/pnas.93.6.2290. [DOI] [PMC free article] [PubMed] [Google Scholar]
- 16.Chan HS, Dill KA. Proteins: Struct Funct, Bioinf. 1998;30(1):2–33. doi: 10.1002/(sici)1097-0134(19980101)30:1<2::aid-prot2>3.0.co;2-r. [DOI] [PubMed] [Google Scholar]
- 17.Sorribas H, Padeste C, Tiefenauer L. Biomaterials. 2002;23(3):893–900. doi: 10.1016/s0142-9612(01)00199-5. [DOI] [PubMed] [Google Scholar]
- 18.Peanasky J, Schneider HM, Granick S, Kessel CR. Langmuir. 1995;11(3):953–962. [Google Scholar]
- 19.Wood J, Sharma R. Langmuir. 1994;10(7):2307–2310. [Google Scholar]
- 20.Tompkins HG. A user’s guide to ellipsometry. Academic Press; Boston: 1993. p. xv.p. 260. [Google Scholar]
- 21.Atkins PW. Shriver & Atkins inorganic chemistry. 4. Oxford University Press ; W.H. Freeman and Co; Oxford ; New York New York: 2006. p. xxi.p. 822. [Google Scholar]
- 22.Tsukruk VV, Luzinov I, Julthongpiput D. Langmuir. 1999;15(9):3029–3032. [Google Scholar]
- 23.Hong L, Sugimura H, Furukawa T, Takai O. Langmuir. 2003;19(6):1966–1969. [Google Scholar]
- 24.Honciuc A, Harant AW, Schwartz DK. Langmuir. 2008;24(13):6562–6566. doi: 10.1021/la8007365. [DOI] [PubMed] [Google Scholar]
- 25.Panchuk-Voloshina N, Haugland RP, Bishop-Stewart J, Bhalgat MK, Millard PJ, Mao F, Leung WY, Haugland RP. J Histochem Cytochem. 1999;47(9):1179–1188. doi: 10.1177/002215549904700910. [DOI] [PubMed] [Google Scholar]
- 26.Walder R, Schwartz DK. Langmuir. 2010;26(16):13364–13367. doi: 10.1021/la1023357. [DOI] [PubMed] [Google Scholar]
- 27.Kastantin MKM, Langdon BB, Chang EL, Schwartz DK. J Am Chem Soc. 2011;133(13):4975–4983. doi: 10.1021/ja110663u. [DOI] [PMC free article] [PubMed] [Google Scholar]
- 28.Halgren TA. J Comput Chem. 1995;17(5 & 6):490–519. [Google Scholar]
- 29.Chen H, Meisburger SP, Pabit SA, Sutton JL, Webb WW, Pollack L. Proc Natl Acad Sci USA. 2012;109(3):799–804. doi: 10.1073/pnas.1119057109. [DOI] [PMC free article] [PubMed] [Google Scholar]
- 30.Honciuc A, Schwartz DK. J Am Chem Soc. 2009;131(16):5973–5979. doi: 10.1021/ja900607g. [DOI] [PubMed] [Google Scholar]
- 31.Walder R, Nelson N, Schwartz DK. Phys Rev Lett. 2011;107(15):156102. doi: 10.1103/PhysRevLett.107.156102. [DOI] [PubMed] [Google Scholar]
- 32.Kastantin M, Schwartz DK. Microsc Microanal. 2012;18(4):793–797. doi: 10.1017/S1431927612000438. [DOI] [PMC free article] [PubMed] [Google Scholar]
- 33.Jamadagni SN, Godawat R, Garde S. Langmuir. 2009;25(22):13092–13099. doi: 10.1021/la9011839. [DOI] [PubMed] [Google Scholar]
- 34.Smith SB, Cui Y, Bustamante C. Science. 1996;271(5250):795–9. doi: 10.1126/science.271.5250.795. [DOI] [PubMed] [Google Scholar]
- 35.Hansma HG, Revenko I, Kim K, Laney DE. Nucleic Acids Res. 1996;24(4):713–720. doi: 10.1093/nar/24.4.713. [DOI] [PMC free article] [PubMed] [Google Scholar]
- 36.Martinez JM, Elmroth SKC, Kloo L. J Am Chem Soc. 2001;123(49):12279–12289. doi: 10.1021/ja0108786. [DOI] [PubMed] [Google Scholar]
Associated Data
This section collects any data citations, data availability statements, or supplementary materials included in this article.


