

Abstract
Neuronal activity and energy metabolism are tightly coupled processes. Previously, we found that nuclear respiratory factor 1 (NRF-1) transcriptionally co-regulates energy metabolism and neuronal activity by regulating all 13 subunits of the critical energy generating enzyme, cytochrome c oxidase (COX), as well as GluN1 (Grin1) and GluN2B (Grin2b) subunits of NMDA receptors. We also found that another transcription factor, nuclear respiratory factor 2 (NRF-2 or GA-binding protein) regulates all subunits of COX as well. The goal of the present study was to test our hypothesis that NRF-2 also regulates specific subunits of NMDA receptors, and that it functions with NRF-1 via one of three mechanisms: complementary, concurrent and parallel, or a combination of complementary and concurrent/parallel. By means of multiple approaches, including in silico analysis, electrophoretic mobility shift and supershift assays, in vivo chromatin immunoprecipitation of mouse neuroblastoma cells and rat visual cortical tissue, promoter mutations, real-time quantitative PCR, and western blot analysis, NRF-2 was found to functionally regulate Grin1 and Grin2b genes, but not any other NMDA subunit genes. Grin1 and Grin2b transcripts were up-regulated by depolarizing KCl, but silencing of NRF-2 prevented this up-regulation. On the other hand, over-expression of NRF-2 rescued the down-regulation of these subunits by the impulse blocker TTX. NRF-2 binding sites on Grin1 and Grin2b are conserved among species. Our data indicate that NRF-2 and NRF-1 operate in a concurrent and parallel manner in mediating the tight coupling between energy metabolism and neuronal activity at the molecular level.
Keywords: Gene regulation, NRF-2, GABP, GluN1, GluN2B, NMDA
1. Introduction
Glutamate is the main excitatory neurotransmitter in the brain and N-methyl-D-aspartate (NMDA) receptors are a major type of glutamatergic receptors. NMDA receptors are ligand-gated, voltage-dependent ionotropic receptors (for review see [1]). They are heterotetrameric proteins composed of the ubiquitous GluN1 subunit in various combinations with the GluN2A-D or GluN3A-B subunits [2–4]. While the NMDA receptors are crucial for the proper functioning and activity of neurons, the properties of the receptors are dictated by their subunit composition. Most NMDA receptors are composed of two GluN1 subunits with two GluN2A or GluN2B subunits [2, 5]. GluN1/GluN2A receptors are fast-acting and widely expressed in the adult brain, while the GluN1/GluN2B receptors are slower acting but widely expressed in the neonatal and the adult brain [3]. The GluN2C, GluN2D, GluN3A, and GluN3B receptor subunits are more developmentally and regionally expressed [4, 6].
Our laboratory has recently shown that GluN1 and GluN2B receptor subunits are regulated at the transcriptional level by nuclear respiratory factor 1 (NRF-1) [7], which also regulates all 13 subunits of cytochrome c oxidase (COX) [8], an enzyme critical for energy production in neurons (for review see [9]). Perturbations of neuronal activity result in concurrent changes in mRNA and protein levels of COX subunits as well as those of GluN1 (Grin1) and GluN2B (Grin2b) subunits [7, 8]. Likewise, altering the expression of NRF-1 leads to parallel changes in COX, GluN1, and GluN2B mRNA and protein expression [7, 8]. Thus NRF-1 co-regulates mediators of synaptic transmission and energy generation, thereby coupling neuronal activity to energy metabolism.
Nuclear respiratory factor 2 (NRF-2), or GA binding protein (GAPB), is a transcription factor in the E-26 transformation-specific (ETS) family (for review see [10]). The functional protein is composed of an α and β subunit that form either a heterodimer or a heterotetramer (α2β2) [10]. The α subunit contains the ETS DNA binding domain that binds to the ‘GGAA’ or ‘TTCC’ motif, and the β subunit contains the transcriptional activation domain [10]. NRF-2 is involved in the control of basic cellular processes, such as cell cycle progression, protein synthesis, and mitochondrial biogenesis [11–13]. NRF-2 is present in neurons, with neuronal activity regulating transcription and nuclear translocation of both its subunits [14–16]. NRF-2 and COX co-exist at the immunohistochemical level, and physiological perturbations of neuronal activity result in parallel changes in NRF-2 and COX protein expression [17, 18]. Our lab has recently discovered that NRF-2, like NRF-1, transcriptionally regulates all subunit genes of the COX enzyme [19–21]. The question naturally arises as to whether NRF-2 also couples energy metabolism to neuronal activity by regulating specific subunits of the NMDA receptors. If so, do the two transcription factors operate via complementary, concurrent and parallel, or a combined complementary and concurrent/parallel mechanism? The goal of the present study was to test our hypothesis that NRF-2 also mediates the coupling of synaptic transmission and energy metabolism.
2. Material and Methods
All experiments were carried out in accordance with the US National Institutes of Health Guide for the care and use of laboratory animals and the Medical College of Wisconsin regulations. All efforts were made to minimize the number of animals and their suffering.
2.1. Cell Culture
Murine neuroblastoma (N2a) cells (ATCC, Manassas, VA, USA) were grown in Dulbecco’s modified Eagle’s medium supplemented with 10% fetal bovine serum, 50 units/mL penicillin, and 100 μg/mL streptomycin (Invitrogen, Carlsbad, CA, USA) at 37°C in a humidified atmosphere with 5% CO 2.
2.2. In silico analysis of promoters of murine NMDA receptor subunit genes
DNA sequences surrounding the transcription start points (TSPs) of N-methyl-D-aspartate (NMDA) receptor subunit genes (Grin1, Grin2a–d, Grin3a–b) were derived from the NCBI mouse genome database (Grin1 GenBank ID: NC_000068.7, Grin2a GenBank ID: NC_000082.6, Grin2b GenBank ID: NC_000072.6, Grin2c GenBank ID: NC_000077.6, Grin2d GenBank ID: NC_000073.6, Grin3a GenBank ID: NC_000070.6, and Grin3b GenBank ID: NC_000076.6). These promoter sequences encompassed 1 kb upstream and 1 kb downstream of the TSP of each gene analyzed. Computer-assisted search for NRF-2’s binding motif ‘GGAA’, or its complement ‘TTCC’, separated by up to 24 base pairs (bp) from another such NRF-2 binding motif, was conducted on each promoter.
Alignment of human, mouse, and rat promoter sequences were performed with NCBI’s Ensembl interface. Mouse NMDA receptor promoter sequences were compared with those of rat and human genomic sequences for conservation of the NRF-2 binding motif.
2.3. Electrophoretic mobility shift and supershift assays
Electrophoretic mobility shift assays (EMSA) for possible NRF-2 interactions with putative binding elements on all NMDA receptor subunit promoters were carried out with a few modifications from methods previously described [21]. Briefly, based on in silico analysis, oligonucleotide probes with a putative NRF-2 binding motif in a tandem repeat on each NMDA receptor subunit promoter were synthesized (Table 1A), annealed, and labeled by a Klenow fragment (Invitrogen, Grand Island, NY, USA) fill-in reaction with [α-32P] dATP (50 μCi/200 ng; Perkin-Elmer, Shelton, CT, USA). N2a nuclear extract was isolated using methods described previously [22]. Each labeled EMSA probe was incubated with 2 μg of calf thymus DNA and 15 μg of N2a nuclear extract. The probe reaction was processed for EMSA. Supershift assays were performed with 0.4 μg of NRF-2 specific antibody (polyclonal rabbit antibody, H-180, sc-22810, Santa Cruz Biotechnology, Santa Cruz, CA, USA) added to the probe/nuclear extract mixture and incubated for 20 min at 24°C. For competition, 100- fold excess of unlabeled oligonucleotides were incubated with nuclear extract before the addition of labeled oligonucleotides. Shift reactions were loaded onto 4.5% polyacrylamide gel (58:1, Acrylamide:Bisacrylamide) and run at 200 V for 4.2 h in 0.25X Tris-borate-EDTA buffer. Results were visualized by autoradiography and exposed on film. Rat cytochrome c oxidase subunit 6b (COX6b) with known NRF-2 binding site was designed as previously described [21] and used as a positive control. NRF-2 mutants with mutated sequences, as shown in Table 1B, were used as negative controls.
Table 1A.
EMSA Probes. Positions of probes are given relative to TSP. Putative NRF-2 binding sites are underlined.
| Gene Promoter | Position | EMSA Sequence |
|---|---|---|
| Grin1 | −565/−545 | F: 5′ TTTTCTGGGGGAAGGATATTGGTGATTTCCTTCT 3′ |
| R: 5′ TTTTAGAAGGAAATCACCAATATCCTTCCCCCAG 3′ | ||
| Grin2a | −334/−319 | F: 5′ TTTTAAATTTGGGGAATCTTGTGTGGAATTTGGA 3′ |
| R: 5′ TTTTTCCAAATTCCACACAAGATTCCCCAAATTT 3′ | ||
| Grin2b | −159/−133 | F: 5′ TTTTAGCTTTTCCCACCCCCTGGCTACCCCACTTCCCCCA 3′ |
| R: 5′ TTTTTGGGGGAAGTGGGGTAGCCAGGGGGTGGGAAAAGCT 3′ | ||
| Grin2c | −385/−368 | F: 5′ TTTTTATCTGGAAGCTTGAAAGTGGAAAGGCA 3′ |
| R: 5′ TTTTTGCCTTTCCACTTTCAAGCTTCCAGATA 3′ | ||
| Grin2d | −330/−314 | F: 5′ TTTTTGGGTTCCATCTTTCCCTTCCACTC 3′ |
| R: 5′ TTTTGAGTGGAAGGGAAAGATGGAACCCA 3′ | ||
| Grin3a | −598/−587 | F: 5′ TTTTGAAAAAGGAAGAGAGGAAGTAGAA 3′ |
| R: 5′ TTTTTTCTACTTCCTCTCTTCCTTTTTC 3′ | ||
| Grin3b | −183/−180 | F: 5′ TTTTAGTGTACTTTTCCCCCAACAAA 3′ |
| R: 5′ TTTTTTTGTTGGGGGAAAAGTACACT 3′ | ||
| COX6b | −47/−23 | F: 5′ TTTTTCCTCTTGCAGCTTCCGGCCAGTC 3′ |
| R: 5′ TTTTGACTGGCCGGAAGCTGCAAGAGGA 3′ |
Table 1B.
Mutant EMSA Probes. Positions of probes are given relative to TSP. Mutated NRF-2 binding sites are underlined.
| Gene Promoter | Position | Sequence |
|---|---|---|
| Grin1 | −565/−545 | F: 5′ TTTTCTGGGTTTTGGATATTGGTGATAAAATTCT 3′ |
| R: 5′ TTTTAGAATTTTATCACCAATATCCAAAACCCAG 3′ | ||
| Grin2b | −159/−133 | F: 5′ TTTTAGCTTAAAACACCCCCTGGCTACCCCACAAAACCCA 3′ |
| R: 5′ TTTTTGGGTTTTGTGGGGTAGCCAGGGGGTGTTTTAAGCT 3′ | ||
| Grin3a | −598/−587 | F: 5′ TTTTGAAAAATTTTGAGATTTTGTAGAA 3′ |
| R: 5′ TTTTTTCTACAAAATCTCAAAATTTTTC 3′ |
2.4. Chromatin immunoprecipitation (ChIP) assays in N2a Cells
ChIP assays were performed similar to those described previously [7]. Briefly, 1 × 10⁶ N2a cells were used for each immunoprecipitation reaction. Cells were fixed with 1% formaldehyde for 10 min at 24°C. Following forma ldehyde fixation, cells were resuspended in swelling buffer (5 mM PIPES, pH 8.0, 85 mM KCl, and 1% Nonidet P-40 (Sigma, St Louis, MO, USA), with protease inhibitors added right before use) and homogenized 10 times in a small pestle Dounce tissue homogenizer (5 mL). Nuclei were then isolated by centrifugation before being subjected to sonication in SDS lysis buffer (1% SDS, 10 mM EDTA, 50 mM Tris-HCl, pH 8.1 (Sigma)). The sonicated lysate was immunoprecipitated with either 1 μg of NRF-2 polyclonal rabbit antibody (H-180, Santa Cruz Biotechnology) or 2 μg of anti-nerve growth factor receptor (NGFR) p75 polyclonal goat antibody (C20, sc-6188, Santa Cruz Biotechnology). Semi-quantitative PCR was performed using 1/20th of precipitated chromatin. Primers encompassing putative NRF-2 tandem repeats near TSPs of NMDA receptor subunit genes (identified in in silico analysis) were designed (Table 2) as previously described [8]. COX6b promoter with NRF-2 binding site was used as a positive control, and exon 8 of NRF-1, a region of DNA that does not contain a NRF-2 binding site, was used as a negative control (Table 2). PCR reactions were carried out with DreamTaq polymerase (Thermo-Fisher Scientific, Waltham, MA, USA). Optimal use of cycling parameters (Table 2) and PCR additives (betaine) significantly improved the quality and reproducibility of ChIP. PCR products were visualized on 2% agarose gels stained with ethidium bromide.
Table 2.
Primers and conditions used for ChIP analysis.
| Gene Promoter | Position of PCR Product | Sequence | Cycling Conditions |
|---|---|---|---|
| Grin1 | −642/−418 | F: 5′ GCCTTGAACTCTAGCAATCCT 3′ | 94°: 30s, 57°: 30s, 72°: 45s. |
| R: 5′ GGAGGGAATGCATTGTGAAT 3′ | |||
| Grin2a | −467/−257 | F: 5′ TCGATAACTTGGTCCACGCACTTG 3′ | 94°: 30s, 57°: 30s, 72°: 45s. |
| R: 5′ TGGCATCCTCCTTCCTTCTCTCTT 3′ | |||
| Grin2b | −324/−91 | F: 5′ GGAGTGGTTTCAGTGTCAGTCTGC 3′ | 94°: 30s, 57°: 30s, 72°: 45s. |
| R: 5′ TAAGACTCTTGGCTGAGGCTGCTT 3′ | |||
| Grin2c | −471/−248 | F: 5′ AAAAGAAGGTCCCCCAGTGT 3′ | 94°: 30s, 57°: 30s, 72°: 45s. |
| R: 5′ TTGGGCCAGTTAATTTCGAG 3′ | |||
| Grin2d | −388/−151 | F: 5′ TCCTGGTTCCCACATTTCAT 3′ | 94°: 30s, 57°: 30s, 72°: 45s. |
| R: 5′ GGGAAAGTTGGGTGAGAGAA 3′ | |||
| Grin3a | −700/−499 | F: 5′ AACTTTGGCGCTCAGAACAGAACC 3′ | 94°: 30s, 57°: 30s, 72°: 45s. |
| R: 5′ AGCTGCCGAACCTGCTTCCTTT 3′ | |||
| Grin3b | −251/−50 | F: 5′ ATCTGATCAGCAAGACCCACAGGA 3′ | 94°: 30s, 57°: 30s, 72°: 45s. |
| R: 5′ TGAGGCAGGCACATCTGGTAGAAA 3′ | |||
| COX6b | −187/+44 | F: 5′ AAAGTGCGCAGGCGCTGGAG 3′ | 94°: 30s, 57°: 30s, 72°: 45s. |
| R: 5′ CCGAGACGCTGACAGCACCG 3′3 | |||
| Exon 8 of NRF-1 | F: 5′ GTGGAACAAAATTGGGCCAC 3′ | 94°: 30s, 57°: 30s, 72°: 45s. 3 | |
| R: 5′ CTGTTAAGGGCCATGGTGA 3′ |
2.5. Chromatin immunoprecipitation (ChIP) assays from Murine Visual Cortical Tissue
ChIP assays were performed on primary neurons similar to that described for N2a cells above. Briefly, 0.1 g of murine visual cortical tissue was used for each immunoprecipitation reaction. From fresh murine brain, the visual cortex was quickly dissected and cut into small pieces. The finely chopped visual cortical tissue was fixed with 2% formaldehyde for 20 min at 24°C. Following formaldehyde fixation, cells were resuspended in swelling buffer and homogenized as described above. Nuclei isolation and immunoprecipition, as well as the analysis of immunoprecipitated samples, including primers for positive and negative controls were identical to the ChIP protocol described for N2a cells above.
2.6. Construction and transfection of luciferase reporter vectors for promoter mutagenesis study
Luciferase reporter constructs of Grin1 and Grin2b gene promoters were made by PCR cloning their proximal promoter sequences using genomic DNA prepared from mouse N2a cells as a template. Digestion with restriction enzymes KpnI and HindIII for Grin1 and MluI and XhoI for Grin2b was performed, followed by ligation of the product directionally into pGL3 basic luciferase vector (E1751, Promega, Madison, WI, USA). Sequences of primers used for PCR cloning are provided in Table 3A. COX6b clone was used from our previous study as a positive control [21]. Site-directed mutations of putative tandem repeat of NRF-2 binding sites on each promoter was generated using QuikChange site-directed mutagenesis kit (Stratagene, La Jolla, CA, USA). Primers for mutagenesis are listed in Table 3B. All constructs were verified by sequencing.
Table 3A.
Primers used for promoter cloning analysis.
| Gene Promoter | Position | Primer |
|---|---|---|
| Grin1 | −719/+483 | F: 5′ CAGGGTACCTGTGGTGTTCCCCTCCCTCCA 3′ |
| R: 5′ CAGAAGCTTCCCAGGCCTTTCCAGGGACCA 3′ | ||
| Grin2b | −878/+248 | F: 5′ CAGACGCGTGCTCAAGAGGGAGAGAAATGGCTGC 3′ |
| R: 5′ CAGCTCGAGGCGTTCGGCAGCAGGAGAGG 3′ | ||
| COX6b | −291/+44 | F: 5′ TTGGTACCACTCTGCAGACAGCCTCAC |
| R: 5′ TTAAGCTTCGGAGCAGCGTTACTTCAAT |
Table 3B.
Primers used for promoter mutagenesis analysis. Mutated NRF-2 binding sites are underlined.
| Gene Promoter | Position | Primer |
|---|---|---|
| Mut. NRF-2 Grin1 | −576/−529 | F: 5′ CCCTATCAGAATGCAATCACCAATATCCTGCACCCAGCGGTATAGAGG 3′ |
| R: 5′ CCTCTATACCGCTGGGTGCAGGATATTGGTGATTGCATTCTGATAGGG 3′ | ||
| Mut NRF-2 Grin2b | −170/−122 | F: 5′ GGGTTAAGCTTTGTCCACCCCCTGGCTACCCCACTGCCCCCAGCTCATG 3′ |
| R: 5′ CATGAGCTGGGGGCAGTGGGGTAGCCAGGGGGTGGACAAAGCTTAACCC 3′ | ||
| Mut NRF-2 COX6b | −35/−32 | F: 5′ TCTCCTCTTGCAGCTAGAGGCCAGTCGGAATTCCG 3′ |
| R: 5′ CGGAATTCCGACTGGCCTCTAGCTGCAAGAGGAGA 3′ |
Each promoter construct was transfected into N2a cells in a 24-well plate using Lipofectamine 2000 (Invitrogen) and cell lysates harvested after 48 h. Each well received 0.6 μg of reporter construct and 0.06 μg of pRL-TK renilla luciferase vector (E2241, Promega), a vector with thymidine kinase (TK) promoter that constitutively expressed renilla luciferase. Transfected neurons were stimulated with KCl at a final concentration of 20 mM in the culture media for 5 h as previously described [7]. After 5 h of treatment, cell lysates were harvested and measured for luciferase activity as described previously [7]. Data from six independent transfections were averaged for each promoter construct.
2.7. Plasmid construction of NRF-2 shRNA, transfection, and KCl treatment
NRF-2 silencing was carried out using two small hairpin RNA (shRNA) sequences against murine NRF-2α that were cloned into the pBS/U6 parent vector. Target NRF-2α shRNA sequences were 5′-ATTGCCCAGCCAGTCACG -3′ and 5′-AGAAGACAGAAGTTCACCG -3′. The pBS/U6 empty parent vector was used as the negative control. The pLKO.1-puro-CMV-TurboGFP Positive Control Vector (SHC003, Sigma) containing turboGFP and puromycin resistance was used to visualize transfection efficiency and select for positively transfected cells.
For transfection, N2a cells were plated at 60% confluency in 6-well dishes. Cells were co-transfected the day after plating with either the NRF-2 shRNA construct (2 μg) and turboGFP (0.5 μg) vectors or the pBS/U6 empty vector (2 μg) and the turboGFP (0.5 μg) vector using 5 μl of JetPrime transfection reagent (PolyPlus Transfection, Illkirch, France) per well. Puromycin at a final concentration of 5 μg/mL was added to the culture medium 1.5 days after transfection to select for purely transfected cells. Green fluorescence was observed to monitor transfection efficiency. Transfection efficiency for N2a cells was around 75%, however puromycin selection effectively yielded 100% transfected cells. N2a cells transfected with shRNA against NRF-2 were further stimulated with KCl at a final concentration of 20 mM in the culture media for 5 h as previously described [7]. After 5 h of treatment, cells were harvested for RNA isolation.
2.8. NRF-2 over-expression and TTX treatment
Vectors expressing human NRF-2α and NRF-2β subunits were constructed by PCR cloning the human NRF-2α and NRF-2β from HeLa cell cDNA and human skeletal muscle cDNA library, respectively, and were described previously [19]. The primer pairs used to amplify NRF-2α and NRF-2β (Table 4) had added HindIII/KpnI and NotI/BamHI restriction sites to their products, respectively. Amplification was done with Taq polymerase and products were cloned into pGEMT-EZ using TA cloning Kit (Promega). Clones were picked and sequenced to verify correct DNA sequence for protein expression. The NRF-2α and NRF-2β cDNAs were then subcloned directionally into pcDNA3.1 vector by double restriction enzyme digest. The sequence of each plasmid construct was verified by sequencing.
Table 4.
NRF-2α and NRF-2β Cloning Primers
| Gene | Primer |
|---|---|
| NRF-2α | F: 5′ AAGCTTACTCCAGCCATGACTAAAAG 3′ |
| R: 5′ GGTACCAGCTATACTTGCTCTAAACAT 3′ | |
| NRF-2β | F: 5′ TTGCGGCCGCGATGTCCCTGGTAGATTTG 3′ |
| R: 5′ AAGGATCCTTAAACAGCTTCTTTATTAGTC 3′ |
For transfection, N2a cells were plated at 60% confluency in 6-well dishes. Cells were transfected the day after plating with either the NRF-2 over-expression construct (2 μg) vector, or the pcDNA3.1 empty (1.5 μg) and turboGFP (0.5 μg) vectors, using 5 μl of JetPrime transfection reagent per well. Green fluorescence was used to monitor transfection efficiency. Transfected N2a cells were impulse blocked for 3 days with TTX at a final concentration of 0.4 μM, starting the day after plating as previously described [7]. Four days after transfection, cells were harvested for RNA isolation.
2.9. RNA isolation and cDNA synthesis
Total RNA was isolated using TRIZOL (Invitrogen) according to the manufacturer’s instructions. 1 μg of total RNA was treated with Dnase I and the reaction stopped with heating at 65°C in the presence of EDTA. cDNA was synthesized using iScript cDNA synthesis kit (170-8891, BioRad, Hercules, CA, USA) according to the manufacturer’s instructions.
2.10. Real-time quantitative PCR
Real-time quantitative PCR was carried out in a Cepheid Smart Cycler Detection system (Cepheid, Sunnyvale, CA, USA) and/or the iCycler System (BioRad) using the IQ Sybr Green SuperMix (170-8880, BioRad) following the manufacturer’s protocols and as described previously [7]. The primer sequences used are shown in Table 5. Primers were optimized to yield 95%–105% reaction efficiency with PCR products run on agarose gel to verify correct amplification length. Melt curve analyses verified the formation of single desired PCR product in each PCR reaction. COX7c real time primer was used as a positive control. Gapdh and β-actin real-time primers were used as internal controls for silencing and over-expression experiments, respectively. The 2−ΔΔCT method was used to quantify the relative amount of transcripts [23].
Table 5.
Real Time Primers
| Gene | Primer |
|---|---|
| Grin1 | F: 5′ CGGCTCTTGGAAGATACAG 3′ |
| R: 5′ GAGTGAAGTGGTCGTTGG 3′ | |
| Grin2a | F: 5′ TAGACCTTAGCAGGCCCTCTC 3′ |
| R: 5′ GAGCTTTTGTTCCCCAAGAGT 3′ | |
| Grin2b | F: 5′ TCATGGTGTCAGTGTGGGCCTTCT 3′ |
| R: 5′ TTCTTGTCACTCAGGCCGGAAACC 3′ | |
| Grin2c | F: 5′ GTTGTAAGGGCTTCTGCATCGACAT 3′ |
| R: 5′ CGATCATACCATTCCACACACCACG 3′ | |
| Grin2d | F: 5′ TCAATGAGGATGGCTTTCTGG 3′ |
| R: 5′ CATAGAGGGTACTTGAGGCG 3′ | |
| Grin3a | F: 5′ GGGAAGGATTGTCATGGACTCGGG 3′ |
| R: 5′ AGCAGGGCATAAGCCTTCATCATCT 3′ | |
| Grin3b | F: 5′ GGCTGCACACCAGTCAGAGGTT 3′ |
| R: 5′ GAGCTGCTGGGGTCCCATGT 3′ | |
| COX7c | F: 5′ ATGTTGGGCCAGAGTATCCG 3′ |
| R: 5′ ACCCAGATCCAAAGTACACGG 3′ | |
| NRF2-α | F: 5′ CTCCCGCTACACCGACTAC 3′ |
| R: 5′ TCTGACCATTGTTTCCTGTTCTG 3′ | |
| NRF2-β | F: 5′ ACCAACCAGTGGGATGGGTCAG 3′ |
| R: 5′ GCACATTCCACCCGGCTCTCAAT 3′ | |
| Actb | F: 5′ GTGACGTTGACATCCGTAAAGA 3′ |
| R: 5′ GCCGGACTCATCGTACTCC 3′ | |
| Gapdh | F: 5′ AGGTCGGTGTGAACGGATTTG 3′ |
| R: 5′ GGGGTCGTTGATGGCAACA 3′ |
2.11. Western blot Analysis
Control, NRF-2 shRNA and over-expression samples were harvested in RIPA buffer (150 mM sodium chloride, 1.0% NP-40, 0.5% sodium deoxycholate, 0.1% sodium dodecyl sulphate, 50 mM Tris, pH 8.0) with a protease inhibitor cocktail (Protease Inhibitor Cocktail III, Research Products International Corp. (RPI), Mount Prospect, IL, USA) added just before use. Samples were loaded onto 10% SDS-PAGE gel and protein was electrophoretically transferred onto polyvinylidene difluoride membranes (Bio-Rad). Subsequent to blocking, blots were incubated in primary antibodies against NRF-2α (H-180, 1:1000, SantaCruz Biotechnology), NRF-2β (gift of Dr. Richard Scarpulla), GluN1 (1:1000; Millipore Chemicon, Billerica, MA, USA), GluN2A (1:5000; PhosphoSolutions, Aurora, CO, USA), and GluN2B (1:1000; PhosphoSolutions). β-actin (1:3000; Sigma) served as loading control. Secondary antibodies used were goat-anti-rabbit and goat-anti-mouse antibodies (Vector Laboratories, Burlingame, CA, USA). Blots were then reacted with ECL reagent (Pierce, Rockford, IL, USA) and exposed to autoradiographic film (RPI). Quantitative analyses of relative changes were done with an Alpha Imager (Alpha Innotech, San Leandro, CA, USA).
2.12. Statistical analysis
Significance among group means was determined by analysis of variance (ANOVA). Significance between two groups was analyzed by Student’s t-test. P-values of 0.05 or less were considered significant.
3. Results
3.1. In silico promoter analysis of NMDA receptor subunit genes
In silico analysis of the proximal promoters of murine NMDA receptor subunit genes, specifically the DNA sequence 1 kb upstream and 1 kb downstream of TSP, revealed the NRF-2 binding motif, ‘GGAA’, or its complement, ‘TTCC’, in a tandem repeat (separated by up to 24 bp) in all NMDA receptor subunit gene promoters except for Grin3b (see Table 1A for the binding motif of NRF-2).
3.2. In vitro binding of NRF-2 to NMDA receptor subunit promoters
The electrophoretic mobility shift assays (EMSA) and supershift assays were performed to determine NRF-2’s ability to bind its candidate site in vitro. As the promoter of Grin3b did not contain a NRF-2 tandem repeat, an oligonucleotide probe encompassing the single conserved NRF-2 binding site was used. Murine cytochrome c oxidase subunit 6b (COX6b) promoter, with a known NRF-2 binding site at position −47/−23 bp upstream of the TSP, served as the positive control. When incubated with N2a nuclear extract, COX6b formed specific DNA/NRF-2 shift and supershift complexes (Fig. 1A, lanes 1 and 3, respectively). When an excess of unlabeled COX6b probe was added as a competitor, no shift band was formed (Fig. 1A, lane 2). For NMDA receptor subunit gene promoters, only Grin1, Grin2b, and Grin3a probes gave positive shift and NRF-2 supershift bands. Specifically, shift bands for Grin1, Grin2b, and Grin3a were observed (Fig. 1A, lanes 4 and 9, Fig, 1B, lane 1, respectively) but were absent for Grin2a, Grin2c, Grin2d, and Grin3b (Fig. 1B, lanes 9–12). Shift bands for Grin1, Grin2b, and Grin3a were competed out by cold competitors (Fig. 1A, lanes 5 and 10, Fig. 1B, lane 2, respectively). Supershift bands with NRF-2 antibody were present for Grin1, Grin2b, and Grin3a (Fig. 1A, lanes 6 and 11, Fig. 1B, lane 3, respectively). An excess of unlabeled Grin1, Grin2b, and Grin3a probes with mutated NRF-2 binding sites were added to respective radiolabeled probes, and they did not compete out the respective shift reactions (Fig. 1A, lanes 7 and 12, Fig. 1B, lane 4, respectively). Labeled Grin1, Grin2b, and Grin3a probes were also incubated with NRF-2 antibody without N2a nuclear extract to serve as a control for antibody-to-oligo interaction, and they did not yield any shift or supershift bands (Fig. 1A, lanes 8 and 13, Fig. 1B, lane 5, respectively). Shift, competitor, and supershift reactions with mutated Grin1, Grin2b, and Grin3a probes did not reveal NRF-2 binding (Fig. 1A, lanes 14–19, Fig. 1B, lanes 6–8, respectively).
Fig. 1.

In vitro binding activity of NRF-2 to putative binding sites on NMDA receptor subunit promoters as determined with EMSA and supershift assays. (A–B) 32P- labeled oligonucleotides, excess unlabeled oligos as competitors, excess unlabeled mutant NRF-2 oligos as competitors, N2a nuclear extract, and NRF-2α antibodies are indicated by a + or a − sign. Arrowheads indicate specific NRF-2 shift, supershift, and non-specific complexes. (A) The positive control, Cox6b, shows a shift (A, lane 1) and a supershift (A, lane 3) band. When excess unlabeled competitor was added, it did not yield a band (A, lane 2). Grin1 and Grin2b promoters containing putative NRF-2 binding sites showed specific shift and supershift bands that were competed out by excess unlabeled competitors (A, lanes 4, 6, and 5; lanes 9, 11, and 10, respectively). The specific shift bands for Grin1 and Grin2b were not competed out by an excess of unlabeled mutant NRF-2 oligos (A, lanes 7 and 12, respectively). Labeled mutated NRF-2 sites on Grin1 and Grin2b were used as negative controls, and they did not yield specific bands (A, lanes 17–19; A, lanes 14–16, respectively). Using labeled probe and NRF2α antibody alone in the absence of nuclear extract did not result in a shift band for Grin1 or Grin2b (A, lanes 8 and 13, respectively). (B) Grin3a promoter containing putative NRF-2 binding site showed specific shift and supershift bands that were competed out by an excess of unlabeled competitors (B, lanes 1, 3, and 2, respectively). An excess of unlabeled mutant NRF-2 oligos was not able to compete (B, lane 4). Labeled mutant NRF-2 oligos did not yield specific shift or supershift bands (B, lanes 6–8). Labeled Grin3a oligo with NRF-2α antibody alone did not result in any band (B, lane 5). Labeled Grin2a, Grin2c, Grin2d, and Grin3b oligos did not yield specific shift bands (B, lanes 9–12, respectively).
3.3. In vivo interaction of NRF-2 with NMDA receptor subunit genes in N2a Cells
The chromatin immunoprecipitation (ChIP) assay was performed to verify NRF-2 protein interaction with NMDA receptor subunit gene promoters in vivo in N2a cells. Sonicated nuclear lysates from N2a cells were immunoprecipitated with NRF-2 antibody and the resulting DNA was subjected to PCR analysis using primers that encompassed the putative NRF-2 binding site identified by in silico analysis. As a control for the immunoprecipitation reaction, nerve growth factor receptor (NGFR) antibody was used. As an additional control to eliminate the possibility of a bead-to-DNA interaction, a “no antibody” control was used. As NRF-2 is known to regulate COX6b [21], primers against the COX6b gene promoter was used as a positive control for the immunoprecipitation, whereas exon 8 of NRF-1, a region of DNA that does not contain a NRF-2 binding site, was used as a negative control. As a positive control for the PCR reaction, 0.5% and 0.1% input DNA were used. Determination of NRF-2 binding to promoter regions was done by parallel PCR amplification of all controls and the immunoprecipitated samples.
As seen in Fig. 2A, agarose gel analysis of PCR products revealed specific bands for input controls in all the tested regions of the proximal NMDA receptor subunit gene promoters. Furthermore, the NRF-2 immunoprecipitated sample revealed an enriched band for COX6b positive control and for Grin1 and Grin2b, but not for exon 8 of NRF-1 negative control. An enriched band did not occur in the NGRF or “no antibody” negative controls. There was also no enrichment of DNA in the NRF-2 immunoprecipitated samples for Grin2a, Grin2c, Grin2d, Grin3a, and Grin3b.
Fig. 2.

In vivo ChIP assays for NRF-2 interaction with NMDA receptor subunits in N2a cells (A) and murine visual cortical neurons (B). Chromatin was precipitated with anti NRF-2α antibodies (NRF-2 IP lane), anti-nerve growth factor receptor p75 antibody (negative control, NGFR IP lane) or no antibody (negative control, No Ab lane). Control reactions for PCR were performed with 0.5% (Input 0.5% IP lane) and 0.1% (Input 0.1% IP lane) of input chromatin. Cox6B promoter was used as a positive control, and Exon 8 of NRF-1 was used as a negative control. Results indicate interactions of NRF-2 with Grin1 and Grin2b but not with Grin2a, Grin2c, Grin2d, Grin3a, or Grin3b in both N2a cells and murine visual cortical tissue.
3.4. In vivo interaction of NRF-2 with NMDA receptor subunit genes in murine visual cortex
To rule out the possibility that the ChIP data, especially the negative result for Grin3a, was not exclusive for N2a cells, ChIP assays were also performed with sonicated nuclear extract from visual cortical tissue of wild type C6BL/J6 mice. The nuclear extract was immunoprecipitated with NRF-2 antibody. Immunoprecipitations with NGFR antibody and a “no antibody” reaction were used as negative controls. Positive and negative controls for PCR analysis of immunoprecipitated products were similar to those of ChIP assays performed with N2a cell nuclear lysate described above.
As seen in Fig. 2B, agarose gel analysis of PCR products of the input control revealed specific bands in all the tested regions of the proximal NMDA receptor subunit gene promoters. NRF-2 immunoprecipitated samples revealed an enriched band for the COX6b positive control and for Grin1 and Grin2b gene promoters, but not for exon 8 of NRF-1 negative control. There was no enriched band in the NGRF and “no antibody” negative controls. Likewise, no enriched bands were found for Grin2a, Grin2c, Grin2d, Grin3a, and Grin3b in the NRF-2 immunoprecipitated samples.
3.5. Effect of mutated NRF-2 binding sites on Grin1, Grin2b, and COX6b promoters
Promoters of NMDA receptor subunit genes that were identified by in silico analysis to contain NRF-2 binding sites and found to bind to NRF-2 in vitro and in vivo were cloned into the pGL3 basic luciferase vector. Site-directed mutations of the putative NRF-2 binding sites on these NMDA receptor subunit gene promoters identified by specific EMSA shift and supershift reactions were constructed. Transfection of control promoter regions or mutated NRF-2 binding regions into N2a cells revealed a significant 26% decrease in promoter activity of the Grin1 promoter containing the mutated NRF-2 motif, and a significant 41% decrease in that of the mutated Grin2b promoter as compared to controls (P < 0.001 for all, Fig. 3). The COX6b promoter was used as a positive control. The COX6b promoter containing a mutated NRF-2 motif showed a significant decrease in promoter activity (P < 0.001, Fig. 3).
Fig. 3.

Site-directed mutational analysis of promoters of wild type (wt) and those with mutated NRF-2 binding site (mut) for Cox6b, Grin1, and Grin2b genes. Cox6b served as a positive control, and mutating the NRF-2 site resulted in a significant decrease in the luciferase activity as compared to the wild type. Similarly, mutating the NRF-2 binding sites on Grin1 and Grin2b genes resulted in significant decreases in luciferase activity. KCl depolarization significantly increased promoter activity in all wild types, but not in Cox6b, Grin1 and Grin2b promoters with mutated NRF-2 sites. N = 6 for each construct. ***= P < 0.001; X = NS. All mutants and wild type + KCl are compared to the wild type. All mutant + KCl are compared to mutants.
3.6. Effect of mutated NRF-2 binding sites on the response of Grin1 and Grin2b promoters to KCl stimulation
To verify that NRF-2 binding is necessary for the up-regulation of Grin1 and Grin2b transcripts by KCl stimulation, Grin1 and Grin2b promoters with or without mutated NRF-2 binding sites were cloned into the pGL3 basic vectors and transfected into N2a cells. As shown in Fig. 3, N2a cells transfected with wild type Grin1 or Grin2b promoters and subjected to KCl depolarizing stimulation showed a significant increase (143% and 144% for Grin1 and Grin2b, respectively) in promoter expression, as monitored by luciferase assays (P < 0.001 for both). This increase was abolished by mutating the NRF-2 binding site (Fig. 3), confirming a requirement for NRF-2 binding in the KCl depolarization-induced up-regulation of the Grin1 and Grin2b transcripts.
3.7. Effect of silencing NRF-2 by RNA interference
To determine the effect of silencing NRF-2α transcript on the expression of NMDA receptor subunits, plasmid vectors expressing small hairpin RNA (shRNA) against two target sequences of NRF-2α mRNA were used. These vectors were previously found to silence NRF-2α expression in N2a cells [19]. Analysis of cDNAs of N2a cells transfected with NRF-2α shRNA vectors was done using quantitative real-time PCR and the 2−ΔΔCT method. Gapdh was used as the internal control, and silenced NRF-2α samples were compared against the control vector samples. Silencing of NRF-2α resulted in a 58% decrease in levels of NRF-2α mRNA, with a 39% decrease in mRNA levels of the positive control, COX7c (P < 0.001 for both, Fig. 4B). Protein levels of NRF2α decreased significantly by 52% (P < 0.001, Fig. 4A). mRNA levels of Grin1 and Grin2B decreased significantly by 38.5% and 45%, respectively (P < 0.001 and P < 0.01, respectively; Fig. 4B), with protein levels decreasing by 87% and 83%, respectively (P < 0.001 for both, Fig. 4A). mRNA levels of the remaining NMDA receptor subunits were not significantly changed (Fig. 4B), and neither was the protein level of GluN2A (Fig. 4A).
Fig. 4.

Effect of RNA interference-mediated silencing of NRF-2α on the expression of COX and NMDA receptor subunit genes. (A) Western blots revealed a down-regulation of NRF-2α, GluN1 and GluN2B, but not GluN2A, protein in shRNA-transfected N2a cells. β-actin served as a loading control. (B) Real-time PCR revealed a down-regulation of transcripts in N2a cells transfected with NRF-2α shRNA as compared to control vectors. Grin1 and Grin2b mRNA levels decreased with NRF-2α silencing, but not those of Grin2a, Grin2c, Grin2d, Grin3a, and Grin3b. As a positive control, COX7c mRNA levels were also decreased with NRF-2α silencing. N = 6 for each data point; **= P < 0.01, ***= P < 0.001, and X = non-significant when compared to controls.
3.8. Effect of over-expressing NRF-2
To determine the effect of over-expressing NRF-2 transcript on the transcript levels of NMDA receptor subunits, plasmid over-expression vectors containing human NRF-2α and human NRF-2β were co-transfected into N2a cells. β-actin was used as the internal control. Over-expression of NRF-2α and β resulted in an approximately 30-fold and 15-fold increase in NRF-2α and β subunit transcripts, respectively (P < 0.001 for both; Fig. 5B), and a 3.5-fold and 4.25-fold increase in their protein levels, respectively (P < 0.001 for both; Fig. 5A). As a positive control, over-expression resulted in a 145.5% increase in COX7c transcript levels (P < 0.001, Fig. 5C). Over-expression of NRF-2 also resulted in a significant increase of 158.6% and 221.7% in the mRNA level of Grin1 and Grin2b, respectively (P < 0.001 for both; Fig. 5C), with a significant 422% and 376% increase (P < 0.001 for both), respectively, in their protein levels (Fig. 5A). mRNA levels of the remaining NMDA receptor subunits (Grin2a, Grin2c, Grin2d, Grin3a, and Grin3b did not change significantly (Fig. 5C), neither did the protein level of GluN2A (Fig. 5A).
Fig. 5.

Effect of NRF-2α and β over-expression on the transcript and protein levels of COX and NMDA receptor subunit genes. (A) Western blots revealed an up-regulation of NRF-2α and NRF-2β with NRF-2α/β over-expression. GluN1 and GluN2B, but not GluN2A, protein levels increased significantly with NRF-2α/β over-expression. β-actin served as a loading control. (B) Real-time PCR revealed an up-regulation of NRF-2α and β mRNA with NRF-2α/β over-expression as compared to control vectors. (C) Grin1 and Grin2b, but not Grin2a, Grin2c, Grin2d, Grin3a, and Grin3b mRNA levels also increased with over-expression. As a positive control, COX7c mRNA levels increased with NRF-2α/β over-expression. N = 6 for each data point; ***= P < 0.001 and X = non-significant when compared to control.
3.9. Silencing NRF-2 abolished KCl-induced transcript up-regulation of Grin1 and Grin2b
We have previously shown that COX subunits are up-regulated in response to KCl, and that this up-regulation is dependent on NRF-2 function. To determine the response of Grin1 and Grin2b mRNA to KCl after NRF-2 silencing, N2a control cells and cells transfected with NRF-2α shRNA were subjected to 20 mM KCl for 5 h. As seen in Fig. 6A, depolarizing stimuli in control cells resulted in a 225% and 254% increase in Grin1 and Grin2b transcript levels, respectively (P < 0.001 for both). In the presence of NRF-2α shRNA, however, 20 mM KCl treatment for 5 h failed to increase Grin1 and Grin2b transcript levels (Fig. 6A). Transcript levels of COX7c positive control increased significantly (145%, P < 0.01; Fig. 6A) with KCl depolarization, but was abolished with shRNA treatment. Transcript levels of Grin2a and Grin3a increased significantly with KCl treatment (P < 0.001 for both; Fig. 6A) that remained as such in the presence of NRF-2α shRNA treatment (Fig. 6A).
Fig. 6.

Effect of KCl or TTX treatment in the presence of NRF-2 silencing or over-expression, respectively, on the transcript levels of Grin1, Grin2b, COX7c, and Grin2a. (A) N2a cells treated for 5 h with 20 mM KCl revealed an up-regulation of all transcripts as compared to controls. In the presence of shRNA against NRF-2α, 5 h treatment with 20 mM KCl failed to up-regulate the transcripts of Grin1, Grin2b, and COX7c, but it did up-regulate those of Grin2a and Grin3a. (B) N2a cells treated for 3 days with 0.4 μM TTX revealed a down-regulation of all tested transcripts as compared to controls. Over-expression of NRF-2α and β rescued the down-regulation of the COX7c, Grin1, and Grin2b transcripts, but not those of Grin2a and Grin3a. N = 6 for each data point; *= P < 0.05, **= P < 0.01, and ***= P < 0.001 when compared to controls; ### = P < 0.001 and X = non-significant when compared to KCl− or TTX-treated samples.
3.10. Over-expression of NRF-2 rescued tetrodotoxin-induced transcript reduction of Grin1 and Grin2b
Our lab has previously shown that 0.4 μM TTX decreases levels of COX subunit transcript levels, as well as transcript levels of the Grin1 and Grin2b subunits of the NMDA receptors [7]. To determine if NRF-2 over-expression could rescue both COX subunit and Grin1 and Grin2b subunit transcript levels, vectors expressing NRF-2 α and β subunits were transfected into N2a cells that were later subjected to 0.4 μM TTX treatment for 3 days. Control cells exposed to TTX showed a significant decrease of 35%, 21%, and 52% in transcript levels of the COX7c, Grin1, and Grin2b subunits, respectively (P < 0.01, P < 0.05, and P < 0.001, respectively; Fig. 6B). Cells that were transfected with NRF-2 α and β over-expression vectors rescued the down-regulation seen with TTX treatment, with an increase in COX7c, Grin1, and Grin2b of 132%, 143%, and 167%, respectively, as compared to controls (P < 0.001 for all as compared to TTX alone; Fig. 6B). As a negative control, transcript levels of Grin2a and Grin3a decreased significantly with TTX treatment (Fig. 6B) and were not rescued by an over-expression of NRF-2α/β (Fig. 6B).
3.11. Homology of NRF-2 Binding Sites
The functional NRF-2 binding sites are conserved between mouse and rat for Grin1, and among mouse, human, and rat for Grin2b (Fig. 7).
Fig. 7.
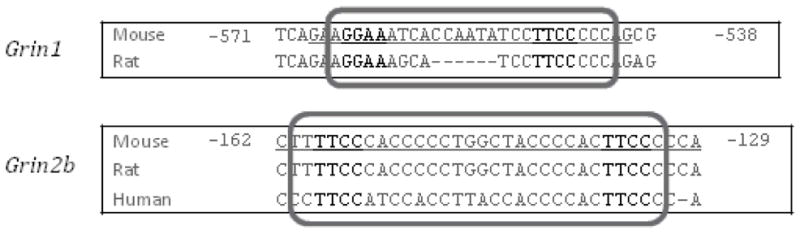
Aligned partial sequences of Grin1 and Grin2b promoters from mouse, rat, and human showed conserved NRF-2 binding sites.
4. Discussion
Using multiple approaches, including EMSA shift and supershift assays, ChIP in both N2a and primary visual cortical neurons, and promoter mutational analysis, the present study documents for the first time that NRF-2 functionally regulates the expression of NMDA receptor subunits GluN1 and GluN2B (Grin1 and Grin2b, respectively). Silencing of NRF-2 resulted in a concurrent decrease in mRNA and protein levels of Grin1 (GluN1), Grin2b (GluN2B), and COX7c, whereas over-expression of NRF-2 resulted in a concurrent increase in these transcript and protein levels. Furthermore, NRF-2 regulatory sites tested in this study are conserved between mice and rats, and, in the case of Grin2b, with humans.
In neurons, there exists an intimate link between NRF-2, energy metabolism, and neuronal activity. NRF-2’s pattern of distribution in the monkey visual cortex is almost identical to that of COX [15, 17, 18], an enzyme critical for energy production in neurons, under normal and functionally deprived states. Such closeness in distribution pattern with COX has not yet been seen with any other transcription factor. If neuronal activity is blocked in adult macaque monkeys by monocular injections of TTX, a toxin that inhibits voltage-dependent sodium channels, there is a parallel reduction in mRNA and protein levels of both NRF-2 and COX in deprived visual cortical neurons. Increased or blockade of neuronal activity causes a transcriptional up or down-regulation, respectively, of both NRF-2 α and β subunits [16, 24], with increased neuronal activity also causing a nuclear translocation of both subunits [14]. The link between NRF-2, energy metabolism, and neuronal activity at the molecular level is revealed by our previous report that NRF-2 regulates all 13 subunits of COX [19, 21], and by the current novel finding that NRF-2 regulates both GluN1 and GluN2B subunits of the NMDA receptors.
GluN1 subunit is expressed in all neurons and is obligatory for the formation of functional NMDA receptors. Most NMDA receptors are composed of two GluN1 and two GluN2A or GluN2B subunits [2]. Of the GluN2A and GluN2B subtypes, the GluN1/GluN2A receptor confers a lower affinity for glutamate and faster kinetics. It is widely expressed in the adult brain. The GluN1/GluN2B subtype is present in the neonatal and adult brain. It is associated with long-term potentiation [25], a feature of learning and memory. GluN1/GluN2B receptors have slower channel kinetics and lower open probability than GluN1/GluN2A receptors. Once activated, GluN1/GluN2B receptors allow for the entry of large amounts of cations, particularly Ca2+. The entry of Ca2+ through GluN2B receptors, combined with the receptor’s direct interactions with downstream signaling proteins, is responsible for learning and memory [25, 26] and, when in excess, excitatory neurotoxicity [27]. The proper function and regulation of the GluN2B gene is critical to neuronal survival, and disruption of its expression in mice causes perinatal lethality [28]. On the other hand, disruption of the GluN2A gene allows for viability [28]. Thus, NRF-2 regulates two critical subunits of NMDA receptors, GluN1 and GluN2B.
The present study found that NRF-2 does not regulate the expression of Grin2a, Grin2c–d, and Grin3a–b genes, and our previous study indicates that NRF-1 does not regulate these subunits either [7]. GluN2D is expressed prenatally while GluN2C is expressed in a distinct spatial pattern in the adult. The GluN3A–B subunits have reduced surface expression in both the neonatal and adult brains [29, 30]. Functional studies to determine the identity of regulatory elements for these genes have not yet been reported.
Neuronal activity is a highly energy intensive process, with the most energy consuming step being the constant repolarization of the membrane potential through active pumping out of cations that enter via excitatory neurotransmitter receptors. GluN1/2B receptors play a critical role in neuronal activity, neuronal plasticity, and the proper functioning of neurons. The GluN2B subunit is required for the proper trafficking of NMDA receptors to the cell surface [31], and its direct interactions with downstream signaling proteins is responsible for some of its effects [26]. Furthermore, the critical role of GluN1/2B receptors in neuronal development, plasticity, and functioning cannot be substituted or replaced by GluN1/2A [32]. Thus, GluN1/GluN2B containing receptors are important regulators of neuronal activity, and NRF-2 plays a vital role in this regulation and in coordinating synaptic transmission with energy generation.
NRF-2 regulates the same NMDA receptor subunits as nuclear respiratory factor 1 (NRF-1) [7], a transcription factor that also regulates all 13 subunits of COX [8]. Like NRF-2, NRF-1 links energy metabolism to neuronal activity. How do these two factors operate together to mediate such co-regulation? Three mechanisms are possible: complementary, concurrent and parallel, and a combination of complementary and concurrent/parallel mechanisms. In the complementary mechanism, NRF-2 regulates NMDA receptor subunit genes complementary to those regulated by NRF-1, whereas in the concurrent and parallel mechanism, NRF-2 and NRF-1 jointly regulate the same subunit genes in a parallel fashion (both are stimulatory). In a combination of the complementary and concurrent/parallel mechanisms, a subset of subunit genes controlled by NRF-2 is also concurrently controlled by NRF-1. This study documents that the mechanism used to co-regulate energy metabolism (COX) and neuronal activity (NMDA receptors) by NRF-2 and NRF-1 is the concurrent and parallel mechanism (see Fig. 8). We have verified in previous reports that silencing either NRF-1 or NRF-2 did not affect the expression of the other [8, 19]. Thus, NRF-2 and NRF-1 operate independently of each other. A possible benefit of the concurrent and parallel mechanism is safety – ensuring that genes important for neuronal functioning are dually regulated. This mitigates possible detrimental effects of either failure or dysfunction of NRF-1 or NRF-2.
Fig. 8.
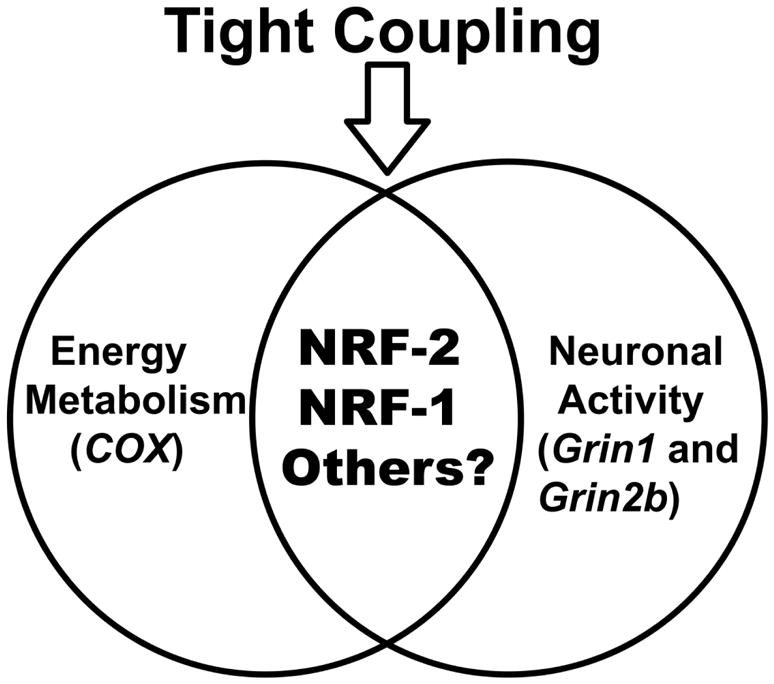
Venn diagram depicting that NRF-2, NRF-1, and perhaps other transcription factors mediate the tight coupling between neuronal activity (NMDA receptors) and energy metabolism (cytochrome c oxidase) at the molecular level.
It is unlikely that the two transcription factors exist solely for redundancy. Knockout of either transcription factor is embryonically lethal. Whereas NRF-2 and NRF-1 both co-regulate energy metabolism and neuronal activity, and each is regulated by neuronal activity, there may be subtle differences. NRF-2 has a virtually identical pattern of distribution as COX in the macaque visual cortex [15, 17, 18], whereas NRF-1 does not [unpublished observations]. It is possible that NRF-1 is co-regulating neuronal activity and energy metabolism at a basal level, while NRF-2 closely monitors changes in neuronal activity, and therefore, in energy demand, to affect its target genes. Distinct subtle differences in the roles of the two transcription factors that may lead to the fine tuning of Grin1 and Grin2b expression under different neuronal activity or metabolic conditions, is important, as the GluN1/2B receptor is critical for normal function but, when activated in excess, is responsible for excitotoxicty and neuronal death.
NRF-2 and NRF-1 mediate the tight coupling of neuronal activity to energy metabolism, but it is possible that there are other transcription factors that also mediate this coupling. Transcription factors such as those in the specificity family and CREB, as well as transcription coactivators, such as peroxisome proliferator-activated receptor-γ coactivator 1α (PGC-1α), known to stimulate a powerful induction of both NRF-1 and NRF-2 [33], may be involved in such regulation. Research is underway to explore such possibilities.
Highlights.
NRF-2 functionally regulates critical Grin1 and Grin2b subunits of NMDA receptors
Silencing NRF-2 prevented KCl-induced up-regulation of Grin1, Grin2b, and COX
Over-expressing NRF-2 rescued TTX-induced down-regulation of Grin1, Grin2b, and COX
NRF-2 (GABP) transcriptionally coregulates energy metabolism and neuronal activity
NRF-2 and NRF-1 regulate NMDA receptors and COX in a concurrent and parallel manner
Acknowledgments
It gives us great pleasure to thank Dr. Richard Scarpulla for his generous gift of NRF-2β antibody and Dr. Sakkapol Ongwijitwat for constructing the NRF-2α shRNA and the NRF-2α and β over-expression vectors. Supported by NIH Grant R01 EY018441.
Abbreviations
- NRF-2/GABP
Nuclear respiratory factor 2/GA binding protein
- Grin
Gene name for NMDA receptor
Footnotes
Publisher's Disclaimer: This is a PDF file of an unedited manuscript that has been accepted for publication. As a service to our customers we are providing this early version of the manuscript. The manuscript will undergo copyediting, typesetting, and review of the resulting proof before it is published in its final citable form. Please note that during the production process errors may be discovered which could affect the content, and all legal disclaimers that apply to the journal pertain.
References
- 1.McBain CJ, Mayer ML. N-methyl-D-aspartic acid receptor structure and function. Physiol Rev. 1994;74:723–760. doi: 10.1152/physrev.1994.74.3.723. [DOI] [PubMed] [Google Scholar]
- 2.Behe P, Stern P, Wyllie DJ, Nassar M, Schoepfer R, Colquhoun D. Determination of NMDA NR1 subunit copy number in recombinant NMDA receptors. Proc Biol Sci. 1995;262:205–213. doi: 10.1098/rspb.1995.0197. [DOI] [PubMed] [Google Scholar]
- 3.Hollmann M, Heinemann S. Cloned glutamate receptors. Annu Rev Neurosci. 1994;17:31–108. doi: 10.1146/annurev.ne.17.030194.000335. [DOI] [PubMed] [Google Scholar]
- 4.Nakanishi S. Molecular diversity of glutamate receptors and implications for brain function. Science. 1992;258:597–603. doi: 10.1126/science.1329206. [DOI] [PubMed] [Google Scholar]
- 5.Blahos J, 2nd, Wenthold RJ. Relationship between N-methyl-D-aspartate receptor NR1 splice variants and NR2 subunits. J Biol Chem. 1996;271:15669–15674. doi: 10.1074/jbc.271.26.15669. [DOI] [PubMed] [Google Scholar]
- 6.Cull-Candy S, Brickley S, Farrant M. NMDA receptor subunits: diversity, development and disease. Curr Opin Neurobiol. 2001;11:327–335. doi: 10.1016/s0959-4388(00)00215-4. [DOI] [PubMed] [Google Scholar]
- 7.Dhar SS, Wong-Riley MT. Coupling of energy metabolism and synaptic transmission at the transcriptional level: role of nuclear respiratory factor 1 in regulating both cytochrome c oxidase and NMDA glutamate receptor subunit genes. J Neurosci. 2009;29:483–492. doi: 10.1523/JNEUROSCI.3704-08.2009. [DOI] [PMC free article] [PubMed] [Google Scholar]
- 8.Dhar SS, Ongwijitwat S, Wong-Riley MT. Nuclear respiratory factor 1 regulates all ten nuclear-encoded subunits of cytochrome c oxidase in neurons. J Biol Chem. 2008;283:3120–3129. doi: 10.1074/jbc.M707587200. [DOI] [PMC free article] [PubMed] [Google Scholar]
- 9.Wong-Riley MT. Cytochrome oxidase: an endogenous metabolic marker for neuronal activity. Trends Neurosci. 1989;12:94–101. doi: 10.1016/0166-2236(89)90165-3. [DOI] [PubMed] [Google Scholar]
- 10.Rosmarin AG, Resendes KK, Yang Z, McMillan JN, Fleming SL. GA-binding protein transcription factor: a review of GABP as an integrator of intracellular signaling and protein-protein interactions. Blood Cells Mol Dis. 2004;32:143–154. doi: 10.1016/j.bcmd.2003.09.005. [DOI] [PubMed] [Google Scholar]
- 11.Villena JA, Vinas O, Mampel T, Iglesias R, Giralt M, Villarroya F. Regulation of mitochondrial biogenesis in brown adipose tissue: nuclear respiratory factor-2/GA-binding protein is responsible for the transcriptional regulation of the gene for the mitochondrial ATP synthase beta subunit. Biochem J. 1998;331(Pt 1):121–127. doi: 10.1042/bj3310121. [DOI] [PMC free article] [PubMed] [Google Scholar]
- 12.Sowa Y, Shiio Y, Fujita T, Matsumoto T, Okuyama Y, Kato D, Inoue J, Sawada J, Goto M, Watanabe H, Handa H, Sakai T. Retinoblastoma binding factor 1 site in the core promoter region of the human RB gene is activated by hGABP/E4TF1. Cancer Res. 1997;57:3145–3148. [PubMed] [Google Scholar]
- 13.Curcic D, Glibetic M, Larson DE, Sells BH. GA-binding protein is involved in altered expression of ribosomal protein L32 gene. J Cell Biochem. 1997;65:287–307. [PubMed] [Google Scholar]
- 14.Yang SJ, Liang HL, Ning G, Wong-Riley MT. Ultrastructural study of depolarization-induced translocation of NRF-2 transcription factor in cultured rat visual cortical neurons. Eur J Neurosci. 2004;19:1153–1162. doi: 10.1111/j.1460-9568.2004.03250.x. [DOI] [PubMed] [Google Scholar]
- 15.Wong-Riley MT, Yang SJ, Liang HL, Ning G, Jacobs P. Quantitative immuno-electron microscopic analysis of nuclear respiratory factor 2 alpha and beta subunits: Normal distribution and activity-dependent regulation in mammalian visual cortex. Vis Neurosci. 2005;22:1–18. doi: 10.1017/S0952523805221016. [DOI] [PubMed] [Google Scholar]
- 16.Zhang C, Wong-Riley MT. Depolarizing stimulation upregulates GA-binding protein in neurons: a transcription factor involved in the bigenomic expression of cytochrome oxidase subunits. Eur J Neurosci. 2000;12:1013–1023. doi: 10.1046/j.1460-9568.2000.00997.x. [DOI] [PubMed] [Google Scholar]
- 17.Nie F, Wong-Riley M. Nuclear respiratory factor-2 subunit protein: correlation with cytochrome oxydase and regulation by functional activity in the monkey primary visual cortex. J Comp Neurol. 1999;404:310–320. doi: 10.1002/(sici)1096-9861(19990215)404:3<310::aid-cne3>3.0.co;2-4. [DOI] [PubMed] [Google Scholar]
- 18.Guo A, Nie F, Wong-Riley M. Human nuclear respiratory factor 2 alpha subunit cDNA: isolation, subcloning, sequencing, and in situ hybridization of transcripts in normal and monocularly deprived macaque visual system. J Comp Neurol. 2000;417:221–232. doi: 10.1002/(sici)1096-9861(20000207)417:2<221::aid-cne7>3.0.co;2-4. [DOI] [PubMed] [Google Scholar]
- 19.Ongwijitwat S, Liang HL, Graboyes EM, Wong-Riley MT. Nuclear respiratory factor 2 senses changing cellular energy demands and its silencing down-regulates cytochrome oxidase and other target gene mRNAs. Gene. 2006;374:39–49. doi: 10.1016/j.gene.2006.01.009. [DOI] [PubMed] [Google Scholar]
- 20.Ongwijitwat S, Wong-Riley MT. Functional analysis of the rat cytochrome c oxidase subunit 6A1 promoter in primary neurons. Gene. 2004;337:163–171. doi: 10.1016/j.gene.2004.04.024. [DOI] [PubMed] [Google Scholar]
- 21.Ongwijitwat S, Wong-Riley MT. Is nuclear respiratory factor 2 a master transcriptional coordinator for all ten nuclear-encoded cytochrome c oxidase subunits in neurons? Gene. 2005;360:65–77. doi: 10.1016/j.gene.2005.06.015. [DOI] [PubMed] [Google Scholar]
- 22.Abmayr SM, Yao T, Parmely T, Workman JL. Preparation of nuclear and cytoplasmic extracts from mammalian cells. Curr Protoc Mol Biol, Chapter. 2006;12(Unit 12):11. doi: 10.1002/0471142727.mb1201s75. [DOI] [PubMed] [Google Scholar]
- 23.Livak KJ, Schmittgen TD. Analysis of relative gene expression data using real-time quantitative PCR and the 2(-Delta Delta C(T)) Method. Methods. 2001;25:402–408. doi: 10.1006/meth.2001.1262. [DOI] [PubMed] [Google Scholar]
- 24.Liang HL, Wong-Riley MT. Activity-dependent regulation of nuclear respiratory factor-1, nuclear respiratory factor-2, and peroxisome proliferator-activated receptor gamma coactivator-1 in neurons. Neuroreport. 2006;17:401–405. doi: 10.1097/01.wnr.0000204980.98876.11. [DOI] [PubMed] [Google Scholar]
- 25.Tang YP, Shimizu E, Dube GR, Rampon C, Kerchner GA, Zhuo M, Liu G, Tsien JZ. Genetic enhancement of learning and memory in mice. Nature. 1999;401:63–69. doi: 10.1038/43432. [DOI] [PubMed] [Google Scholar]
- 26.El Gaamouch F, Buisson A, Moustie O, Lemieux M, Labrecque S, Bontempi B, De Koninck P, Nicole O. Interaction Between alphaCaMKII and GluN2B Controls ERK-Dependent Plasticity. J Neurosci. 2012;32:10767–10779. doi: 10.1523/JNEUROSCI.5622-11.2012. [DOI] [PMC free article] [PubMed] [Google Scholar]
- 27.Liu Y, Wong TP, Aarts M, Rooyakkers A, Liu L, Lai TW, Wu DC, Lu J, Tymianski M, Craig AM, Wang YT. NMDA receptor subunits have differential roles in mediating excitotoxic neuronal death both in vitro and in vivo. J Neurosci. 2007;27:2846–2857. doi: 10.1523/JNEUROSCI.0116-07.2007. [DOI] [PMC free article] [PubMed] [Google Scholar]
- 28.Sprengel R, Suchanek B, Amico C, Brusa R, Burnashev N, Rozov A, Hvalby O, Jensen V, Paulsen O, Andersen P, Kim JJ, Thompson RF, Sun W, Webster LC, Grant SG, Eilers J, Konnerth A, Li J, McNamara JO, Seeburg PH. Importance of the intracellular domain of NR2 subunits for NMDA receptor function in vivo. Cell. 1998;92:279–289. doi: 10.1016/s0092-8674(00)80921-6. [DOI] [PubMed] [Google Scholar]
- 29.Cull-Candy SG, Leszkiewicz DN. Role of distinct NMDA receptor subtypes at central synapses. Sci STKE. 2004;2004:re16. doi: 10.1126/stke.2552004re16. [DOI] [PubMed] [Google Scholar]
- 30.Pina-Crespo JC, Talantova M, Micu I, States B, Chen HS, Tu S, Nakanishi N, Tong G, Zhang D, Heinemann SF, Zamponi GW, Stys PK, Lipton SA. Excitatory glycine responses of CNS myelin mediated by NR1/NR3 “NMDA” receptor subunits. J Neurosci. 2010;30:11501–11505. doi: 10.1523/JNEUROSCI.1593-10.2010. [DOI] [PMC free article] [PubMed] [Google Scholar]
- 31.She K, Ferreira JS, Carvalho AL, Craig AM. Glutamate Binding to the GluN2B Subunit Controls Surface Trafficking of N-Methyl-D-aspartate (NMDA) Receptors. J Biol Chem. 2012;287:27432–27445. doi: 10.1074/jbc.M112.345108. [DOI] [PMC free article] [PubMed] [Google Scholar]
- 32.Wang CC, Held RG, Chang SC, Yang L, Delpire E, Ghosh A, Hall BJ. A critical role for GluN2B-containing NMDA receptors in cortical development and function. Neuron. 2011;72:789–805. doi: 10.1016/j.neuron.2011.09.023. [DOI] [PubMed] [Google Scholar]
- 33.Wu Z, Puigserver P, Andersson U, Zhang C, Adelmant G, Mootha V, Troy A, Cinti S, Lowell B, Scarpulla RC, Spiegelman BM. Mechanisms controlling mitochondrial biogenesis and respiration through the thermogenic coactivator PGC-1. Cell. 1999;98:115–124. doi: 10.1016/S0092-8674(00)80611-X. [DOI] [PubMed] [Google Scholar]