

Abstract
Tuberous sclerosis complex (TSC) is an autosomal dominant disorder caused by mutations in either the TSC1 or TSC2 genes and characterized by developmental brain abnormalities. We defined the spectrum of brain abnormalities in fetal TSC brain ranging from 23 to 38 gestational weeks. We hypothesized (i) prenatal activation of the target‐of‐rapamycin complex 1 (TORC1) signaling pathway; and (ii) activation of inflammatory pathways in fetal brain lesions. Immunocytochemical analysis of cortical tubers, as well as subependymal lesions in all cases confirmed the cell‐associated activation of the TORC1 signaling pathway in both the cortical tubers and subependymal lesions (including a congenital subependymal giant cell astrocytoma) with expression of pS6, p4EBP1 and c‐myc proteins, as well as of p70 S6 kinase 1. The lesions contained macrophages and T‐lymphocytes; giant cells within the lesions expressed inflammatory response markers including major histocompatibility complex class I and II, Toll‐like receptors (TLR) 2 and 4 and receptor for advanced glycation end products (RAGE). These observations indicate that brain malformations in TSC are likely a consequence of increased TORC1 activation during embryonic brain development. We also provide evidence supporting the possible immunogenicity of giant cells and the early activation of inflammatory pathways in TSC brain.
Keywords: development, giant cells, major histocompatibility complex (MHC) class I, microglia, phosphorylated ribosomal protein S6, TORC1 signaling, tubers
Introduction
Tuberous sclerosis complex (TSC) is an autosomal dominant disorder caused by TSC1 or TSC2 mutations 14, 36 and characterized by neurobehavioral disabilities and intractable epilepsy 8, 12, 27. TSC is associated with the presence of developmental brain lesions including cortical tubers 17, 27, subependymal nodules and subependymal giant cell astrocytomas (SEGAs) 13, 25. The prenatal diagnosis of TSC is often based on the detection of cardiac rhabdomyomas. However, with the recent advances in both fetal ultrasonography and magnetic resonance imaging (MRI), an increasing number of brain lesions can be detected during the prenatal period 11, 15, 41. These imaging studies indicate that tubers may form during the early stages of embryonic brain development, most likely between weeks 10 and 20 of gestation, but do not provide any information about tuber histopathology or the pathogenic mechanisms leading to tuber development. Autopsy studies offer more insight into the complexity and multifocality of TSC brain pathology 25. To date, only few autopsy cases of fetal TSC have been reported 9, 29.
Cell‐associated activation of the target of rapamycin (TOR) complex 1 (TORC1) pathway has been described in tubers 4, 6, 24. Nonetheless, the cellular mechanisms underlying the seizures and cognitive impairments in TSC patients remain largely unknown 17, 40. Recently, particular attention has been focused on the role of proinflammatory cytokines that could predispose to seizures and to progressive cognitive dysfunction [for review, see 2, 38].
Here, we report the neuropathological features of TSC in fetal brain from 23 to 38 weeks gestation. The aim of the study was twofold 1: to clarify whether TORC1 activation occurs in specific cell types in fetal TSC brain and 2 to clarify whether the expression of inflammatory molecules and the activation of inflammatory pathways are a feature of fetal TSC cerebral lesions.
Methods
Human tissue specimens
The specimens included in this study were obtained from the brain collections of the Departments of Neuropathology at the Academic Medical Center, University of Amsterdam and the University Medical Centre, St Radboud, Nijmegen (The Netherlands), The Service d'anatomie pathologique, CHI de Creteil and the Hospital Robert Debre, Paris (France), the University of Calgary and Alberta Children's Hospital, Calgary (Canada), and the University of Pennsylvania Medical Center, Philadelphia (USA). The specimens were obtained following post‐mortem examination at gestational week (GW) 23 (monozygotic twins; male), 27 (female), 32 (female), 34 (female) and 38 (male). We also included age (gestation)‐matched control fetal brain tissue obtained from spontaneous or therapeutic abortions; only specimens displaying a normal cortical structure for the corresponding age and without any significant brain pathology were included. In each case, informed consent was obtained for the brain autopsy, and tissue was used in a manner compliant with the Declaration of Helsinki. Human tissue studies were approved by the University of Pennsylvania Institutional Review Board and Committee on Human Research.
Histology and immunhistochemistry
Pathological examination was carried out on hematoxylin and eosin (HE) stained paraffin‐embedded tissue. Immunohistochemistry (see Table 1) was carried out as previously described 3. Single‐label immunohistochemistry was developed using the Powervision kit (Immunologic, Duiven, the Netherlands) with 3,3‐diaminobenzidine (Sigma, St. Louis, MO, USA) as chromogen. For double‐labeling studies, sections were incubated with primary antibodies against Ser235/236 phosphorylated ribosomal protein S6 (pS6; monoclonal rabbit, Cell Signaling Technology, Inc., Danvers, MA, USA; 1:50 dilution) and human leukocyte antigen (HLA) class I (HLA‐I; mouse clone HC‐10; 1:200), followed by the Alexa Fluor® 568‐conjugated anti‐rabbit IgG and the Alexa Fluor® 488‐conjugated anti‐mouse IgG (both 1:100, Molecular Probes, Bleiswijk, the Netherlands) secondary antibodies. Incubations were carried out for 2 hours at room temperature. Sections were analyzed using a MRC1024 laser scanning confocal microscope equipped with an argon‐ion laser (Bio‐Rad, Hercules, CA, USA).
Table 1.
Immunocytochemistry: primary antibodies.
| Antigen | Primary antibody | Source | Dilution |
|---|---|---|---|
| GFAP | Polyclonal rabbit | DAKO, Glostrup, Denmark | 1:4000 |
| GFAPδ. | Polyclonal rabbit | a | 1:500 |
| Vimentin | Mouse clone V9 | DAKO | 1:1000 |
| Nestin | Mouse clone 10C2 | Chemicon, Temecula, CA | 1:200 |
| Synaptophysin | Mouse clone SY38 | DAKO | 1:200 |
| Neurofilament | Mouse clone 2F11 | DAKO | 1:50 |
| HLA‐DP, DQ, DR (HLA‐II) | Mouse clone CR3/43 | DAKO | 1:100 |
| HLA class I (HLA‐I) | Mouse clone HC‐10 | b | 1:200 |
| CD68 | Mouse clone PG‐M1 | DAKO | 1:200 |
| CD3 | Mouse clone, F7.2.38 | DAKO | 1:200 |
| CD8 | Mouse clone, C8/144B | DAKO | 1:100 |
| CD4 | Mouse clone, 4B12 | Neomarkers, Duiven, The Netherlands | 1:100 |
| CD20 | Mouse clone, L26 | DAKO | 1:400 |
| Granzym B | Mouse clone, GrB‐7 | Monosan | 1:100 |
| TLR2 | Polyclonal goat | R & D systems, Abingdon UK | 1:1:00 |
| TLR4 | Polyclonal rabbit | Santa Cruz, Santa Cruz, CA, USA | 1:50 |
| Advanced glycation end products (RAGE) | Polyclonal goat | Biologo, Kronshagen, Germany | 1:200 |
| Phospho‐S6 ribosomal protein (Ser235/236; pS6) | Monoclonal rabbit | Cell Signaling Technology, Beverly, MA, USA | 1:50 |
| Phospho‐p70 S6 kinase 1 (Thr389; pS6K) | Monoclonal mouse | Cell Signaling | 1:50 |
| Phosphorylated eukaryotic initiation factor 4E binding protein 1 (Thr37/46; p4EBP1) | Monoclonal rabbit | Cell Signaling | 1:50 |
| c‐Myc | Mouse clone, 9E10 | Abcam, Cambridge, MA, USA | 1:250 |
Kindly provided by Dr. E.M. Hol (Department of Astrocyte Biology & Neurodegeneration, Netherlands Institute for Neuroscience).
Kindly provided by Dr. J. Neefjes (Netherlands Cancer Institute), which recognizes HLA‐A, B and C.
GFAP = glial fibrillary acidic protein; HLA = human leukocyte antigen; MHC = major histocompatibility complex; TLR = toll‐like receptor.
DNA analysis
TSC1 and TSC2 mutation analysis was performed by sequence analysis of all coding exons and exon/intron boundaries. Mutations are described according to the Human Genome Variation Society nomenclature (Accession number NM_000548.3; 35).
For loss of heterozygosity (LOH) analysis at the TSC2 locus the lesion, identified on HE and pS6 stained sections, was excised and DNA was isolated from the excised paraffin‐embedded material using the BiOstic® FFPE Tissue DNA Isolation Kit (MOBIO Laboratories, Inc., Carlsbad, CA, USA). Polymerase chain reaction (PCR) amplification was performed in a 25‐μl reaction volume with 2.5 μL 10× PCR buffer (Invitrogen, Breda, the Netherlands), 0.8 μM deoxynucleotide triphosphates (Pharmacia, Freiburg, Germany), 1.5 μM MgCl2 (Invitrogen), 0.05 %/W‐1, 1.2 μM of each primer (forward: 5′‐CCCCCTTCTCATCTCAGGTT‐3′; reverse: 5′‐CTCCACCTGCCTGTCACTCT‐3′), 0.02 units of Taq polymerase (Invitrogen) and 30–100 ng of extracted DNA. PCR was performed as follows: initial denaturation at 94°C for 5 min, followed by 40 cycles of denaturation at 95°C for 1 min, annealing at 60°C for 1 min, and extension at 72°C for 30 s, and final extension at 72°C for 10 minutes. Amplified fragments were dissected from 1.5% agarose gels and purified using the Invisorb® Spin DNA extraction Kit (Invitek, Berlin, Germany) following the manufacturer's protocol. Purified PCR products were sequenced using the Big Dye Terminator Cycle Sequencing Kit (Perkin Elmer Biosystems, Foster City, CA, USA).
Results
In all cases the diagnosis was made prenatally on the basis of the detection of cardiac rhabdomyoma, which was confirmed at autopsy and histologic examination. In one case, routine prenatal ultrasound at 22 weeks gestation also revealed a right frontal intracerebral lesion (diameter 3 cm; not shown) in one fetus of a monozygotic twin pregnancy. MRI (22 weeks; Figure 1A) confirmed the presence of the lesion in the right frontal lobe and showed multiple subependymal lesions in the co‐twin (Figure 1B). The lesions were hypointense on T2‐weighted MRI, most likely because of the hypercellularity of the lesion and the high water concentration of the immature brain. Hypointensity, as detected by T2‐weighted MRI has been reported previously in infants with SEGA 16, 33. The pregnancy was terminated at 23 weeks and an autopsy was performed.
Figure 1.

Prenatal magnetic resonance imaging of fetal tuberous sclerosis complex brain. Monozygotic twin pregnancy (22 gestation weeks) showing a large intracerebral lesion (right frontal) in one fetus (A) and subependymal lesions in the co‐twin (B). The lesions are hypointense on the T2‐weighted image in reference to the cerebral cortex.
Histopathology
In each case, microscopic examination of the fetal brain sections revealed a cerebral architecture relatively appropriate for the corresponding gestational age (23, 27, 32, 34 and 38 weeks). However, multiple focal cortical tubers, as well as subependymal nodular lesions, were detected in different brain regions in all cases.
In one 23‐week fetus, a focal lesion mainly composed of large bizarre cells with the appearance of gemistocytic astrocyte‐like balloon‐type cells (large cells with eccentric nuclei and eosinophilic cytoplasm; resembling giant cells in adult TSC brain) was identified in the deep white matter adjacent to the germinal matrix (Figure 2B–E). These cells were localized under the cortical plate (CP), which had normal cellular architecture for the gestational age (Figure 2D). In the same fetus, subependymal nodular lesions, mainly composed of plump cells with eosinophilic cytoplasm, were also observed (Figure 2A). In the twin 23‐week fetus, microscopic examination confirmed the presence of a large SEGA and composed of giant cells and small germinal matrix‐like cells with scant cytoplasm (Figure 2F). The cerebellum and brain stem were normal.
Figure 2.
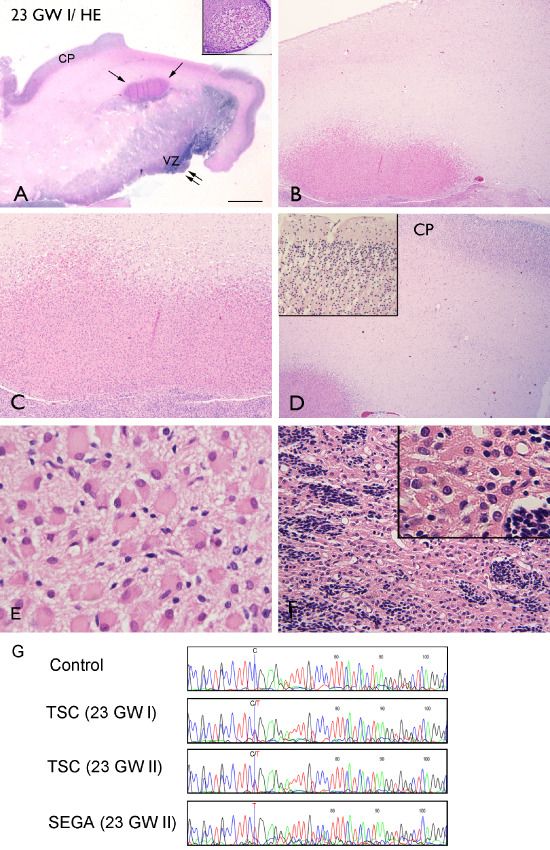
Hematoxylin and eosin staining, monozygotic twin pregnancy at 23‐weeks gestation; TSC2 germline mutation. A. Low‐magnification image of a focal, eosinophilic lesion in the deep white matter adjacent to the germinal matrix (arrows) and a subependymal nodular lesion (double arrows; insert) from a 23‐week fetus (23 GW I); B–D. Lesion is mainly composed of large dysmorphic cells with the appearance of giant cells (large cells with eccentric nuclei and eosinophilic cytoplasm). The CP displayed a normal cellular architecture for the gestational age (insert in D). E. High magnification of giant cells in the subcortical lesion. F. Large lesion resembling a SEGA and composed of giant cells and small, germinal matrix‐like cells with scant cytoplasm. G. TSC2 c.2713C > T (p.R905W) mutation detected in leukocyte DNA from monozygotic twins (23 GW I and II) compared with a control leukocyte DNA sample. The line represents nucleotide 2713 in TSC2. The wild‐type allele is absent in DNA isolated from the SEGA (bottom). Scale bar (in A): A: 5 mm; B, D: 500 μm; C: 250 μm; F: 125 μm; E: 50 μm. CP = cortical plate; GW = gestational week; MRI = magnetic resonance imaging; SEGA = subependymal giant cell astrocytoma; TSC = tuberous sclerosis complex; VZ = ventricular zone.
In the 27‐week case, multiple lesions consisting of giant cells and germinal matrix cells were observed in the deep white matter adjacent to the germinal matrix (Figure 3A–C). In this case, single giant cells were also detected, scattered throughout the subcortical white matter (Figure 3B,C). Nonetheless, the overlying cortex showed normal architecture for the corresponding gestational age. Multiple lesions consisting of giant cells were also observed in the 32‐ and 34‐week fetal brains (Figure 3D–I). These cells were often located deep in the white matter and arranged in longitudinal cell clusters. In the 32‐ and 34‐week cases, we observed regions of disorganized cortical lamination with abnormal cell types, including large, dysmorphic neuroglial cells with the appearance of giant cells (Figure 3H). Similar neuropathological features were observed in the 38‐week case and in both cases large, dysmorphic neuroglial giant cells were also detected in the molecular zone (layer 1) of the cortex (Figure 3I). We did not observe dysmorphic or hypertrophic neurons in any of the cases in the cortex. Table 2 summarizes the histopathological findings in TSC fetal brain.
Figure 3.

27‐ 32‐ and 34‐week fetal TSC brain. A–C. Fetal brain (27 GW) with a focal lesion consisting of giant cells and germinal matrix cells (arrows) in the deep white matter adjacent to the germinal matrix. D–F. Fetal brain (32 GW) with multiple lesions consisting of giant cells. These cells were located in the deep white matter and often arranged in longitudinal cell clusters (F). H and I. Fetal brain (H, 34 GW; I, 38 GW) showing disorganized cortical lamination with abnormal cell types, including large, bizarre neuroglial cells with the appearance of giant cells (arrows indicate giant cells in the subpial region, molecular zone). J. High magnification of giant cells; insert in J shows positivity for nestin (38 GW). Scale bar (in A): A: 5 mm; B, D: 500 μm; C, E: 250 μm; F–I: 125 μm; J: 50 μm. CP = cortical plate; GW = gestational week; TSC = tuberous sclerosis complex; VZ = ventricular zone.
Table 2.
Histopathological findings in tuberous sclerosis complex fetal brain.
| Pathology | 23 GW | 23 GW | 27 GW | 32 GW | 34 GW | 38 GW |
|---|---|---|---|---|---|---|
| Tubers/giant cells | + subcortical | + subcortical | + subcortical | + subcortical/cortical | + subcortical/cortical | + subcortical/cortical |
| Subependymal nodular lesions | + | + | + | + | + | + |
| Subependymal giant cell astrocytomas | + | − | − | − | − | − |
| Cortical dyslamination | − | − | − | + | + | + |
| Dysmorphic/hypertrophic neurons | − | − | − | − | − | − |
| Calcifications | − | − | − | − | − | − |
GW = gestational weeks.
DNA analysis
A de novo germline TSC2 c.2713C>T (p.R905W) missense mutation was identified in DNA isolated from skin biopsies from both twins, confirming the diagnosis of TSC. This mutation has been identified previously in other patients/families with TSC (see http://www.LOVD.nl/TSC2), although in our case, the mutation was shown to be de novo and was therefore an independent event. Sequence analysis of DNA isolated from a large SEGA detected in one fetus (Figure 1F) revealed LOH at the TSC2 locus (Figure 1G).
Immunohistochemical analysis
The large, bizarre neuroglial cells with the appearance of giant cells in the subcortical/cortical lesions, as well as in the subependymal nodules, expressed vimentin, glial fibrillary acidic protein (GFAP; Figures 4A and 6A) and nestin (insert in Figure 3J), but did not display synaptophysin or neurofilament immunoreactivity, except in a few of the giant cells in the 38‐week case (not shown). GFAP immunoreactivity was detected using a GFAP antibody, recognizing all GFAP isoforms (Figure 4A, insert), as well as an antibody specific for the GFAP δ isoform (Figure 4F).
Figure 4.
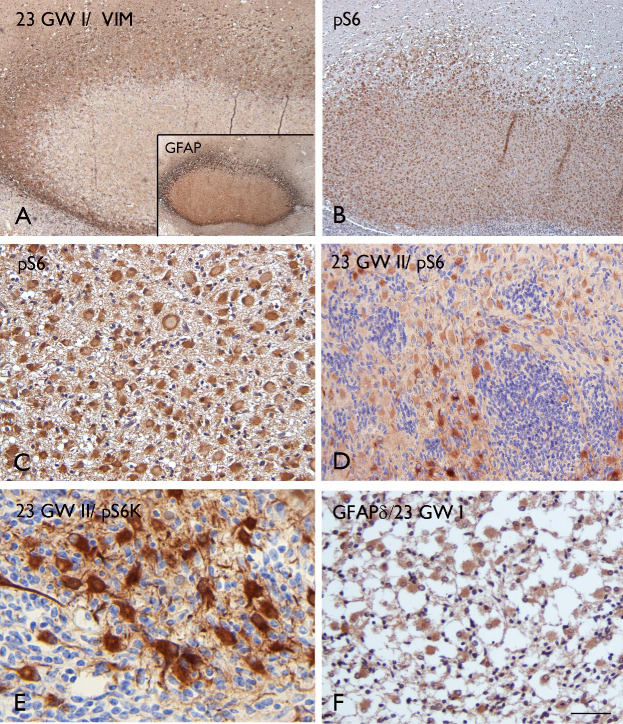
Immunohistochemical features of 23‐week fetal TSC lesions. A. VIM staining in the nodular subcortical lesion (23 GW I); insert: GFAP expression in the same lesion (pan‐GFAP antibody) with a pattern similar to VIM, showing robust expression at the periphery of the lesion. B–D. Strong and homogeneous staining of pS6 in the focal lesion of one twin fetus (23 GW I) as well as in the giant cells within the lesion of the co‐twin (23 GW II). E. Expression of pS6K in giant cells within the lesion from twin II GW 23. F. GFAPδ staining in the subependymal nodular lesion (23 GW I). Scale bar (in A): A, B: 250 μm; C, F: 80 μm; D: 160 μm; E: 50 μm. GFAP = glial fibrillary acidic protein; GW = gestational week; TSC = tuberous sclerosis complex; VIM = vimentin.
Figure 6.

Immunohistochemical features of a 34‐week fetal TSC tuber specimen. A. VIM staining showing strong immunoreactivity in giant cells within the tuber (insert). B–C. Strong pS6 staining in giant cells within the dysplastic cortex (B; insert in B), as well as in giant cells within the subependymal nodular lesion (C; insert in C). D. Expression of pS6K in giant cells within the subependymal nodule. E. Expression of p4EBP1 in giant cells within the white matter. F. c‐Myc expression in giant cells. Scale bar (in A): A–C: 160 μm; D: 80 μm; E: 50 μm; F: 25 μm. TSC = tuberous sclerosis complex; VIM = vimentin.
In all cases, strong cytoplasmic immunoreactivity for pS6, a marker of TORC1 activation, was observed in the majority of giant cells (Figures 4, 5, 6). In the large lesion resembling a SEGA (23 GW) and composed of giant cells and small germinal matrix‐like cells, only the giant cells displayed immunoreactivity for pS6 (Figure 4D). The pS6 staining allowed the detection of small clusters of giant cells as well as single giant cells scattered throughout the subcortical white matter (Figure 5A,D,E) and in the molecular layer (Figures 5F and 6B). In addition, we observed expression of Thr389‐phosphophorylated p70 S6 kinase 1 (pS6K), Thr37/46‐phosphorylated eukaryotic initiation factor 4E binding protein 1 (p4EBP1) and c‐myc, a downstream transcriptional activator of mTOR (Figures 4E and 6D–F). We did not detect immunoreactivity for pS6, pS6K, p4EBP1 or c‐myc in normal appearing perituberal cortex or in age‐matched control specimens.
Figure 5.

Immunohistochemical features of TSC fetal lesions at 27 and 32 GW. A (27 GW): pS6 staining showing a cluster of positive giant cells in the white matter. B–F (32 GW): pS6 staining showing positive giant cells in the subependymal nodular lesion (B; low magnification in the insert), in the in the white matter (C–E; arrows in E show a small cluster of positive giant cells) and in the molecular layer (arrows and insert). Scale bar (in A): A: 80 μm; B: 320 μm; C–F: 160 μm. GW = gestational week; TSC = tuberous sclerosis complex.
The nodular lesions in the the subcortical white matter, as well as the large cells within the cortex and in the subependymal nodules were also positive for major histocompatibility complex (MHC) class I and II antigen (HLA‐I and HLA‐II; Figures 7, 8, 9). Similar to the pS6 staining, HLA‐I was detected in small clusters or singleton giant cells scattered throughout the subcortical white matter and molecular layer (Figure 8A–F). We observed co‐localization of HLA‐I and pS6 (insert in Figure 7C), but the large HLA‐I and II positive cells did not display CD68 immunoreactivity. Nonetheless, CD68 positive cells were observed within the lesions, surrounding the giant cells (Figures 7H and 9D). In addition, a few CD3 immunoreactive cells (T‐lymphocytes) were detected within the nodular lesions containing the large cells (Figures 7I, 8G and 9D, insert). CD8 (T‐cytotoxic/suppressor immunophenotype) and occasionally granzyme B immunoreactivity was observed within the lesions (insert in Figure 7I); CD4‐positive cells and B‐lymphocytes (CD20 positive cells) were not found (data not shown). No CD3, CD4, CD8 and CD20‐positive cells were observed in the brain parenchyma (white matter and CP) of age‐matched control specimens; only a few CD68‐immunoreactive cells were found closely associated with blood vessels and MHC‐I‐II immunoreactivity was restricted to the meninges, choroid plexus and blood vessels within the subependymal zone.
Figure 7.
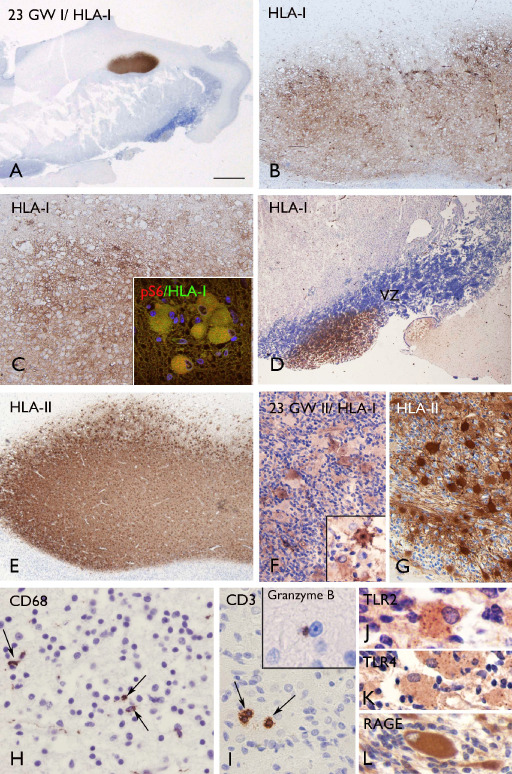
Expression of inflammatory molecules and inflammatory cells in TSC fetal tuber specimens at 23 GW. A–D (23 GW I): HLA‐I staining showing strong expression in the focal lesion in the deep white matter (A–C; arrows in A) and in the subependymal nodular lesion (D). Insert in C: merged image showing co‐localization of HLA‐I (green) with pS6 (red). E–G (23 GW I): HLA‐II staining showing expression in a focal lesion, as well as in the giant cells within the lesion of the co‐twin (23 GW II; insert in F: high magnification). H. CD68 staining showing positive cells within the lesion. I. CD3 immunoreactive cells (T‐lymphocytes) within the nodular lesion and occasional granzyme B immunoreactivity (insert). J–L. TLR2, TLR4 and RAGE expression in giant cells. Scale bar (in A): A: 5 mm; B, D, E: 250 μm; C: 125 μm; F–G: 80 μm; H–I: 40 μm; J–L: 25 μm. GW = gestational week; HLA = human leukocyte antigen; RAGE = receptor for advanced glycation end products; TSC = tuberous sclerosis complex; TLR = toll‐like receptor.
Figure 8.

Inflammatory molecules and inflammatory cells in 32‐week fetal TSC tuber specimen. A–F. HLA‐I staining in small clusters or single cells scattered throughout the cortex and subcortical white matter. These cells were also detected in the subpial region (molecular zone; arrows in E). G. CD3 immunoreactive cells (T‐lymphocytes) within the lesion. Scale bar (in A): A–B: 500 μm; C: 80 μm; D–F: 160 μm; F–G: 80 μm; G: 40 μm. HLA = human leukocyte antigen; TSC = tuberous sclerosis complex.
Figure 9.
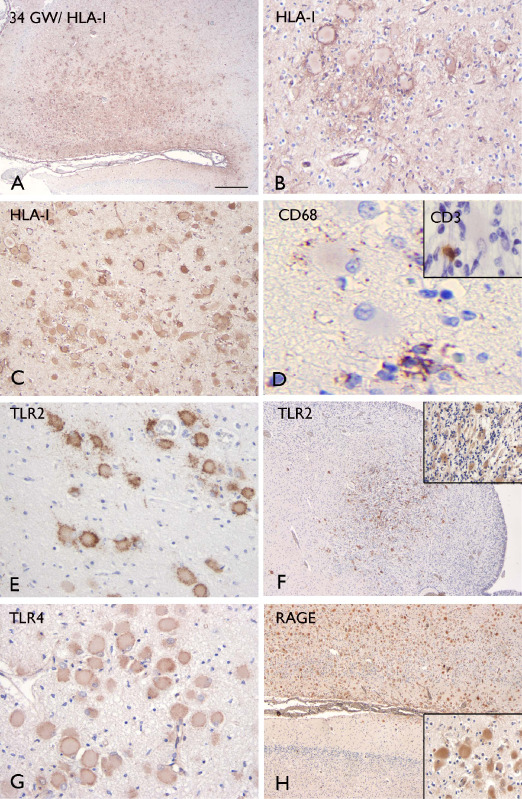
Inflammatory molecules and inflammatory cells in a 34‐week fetal TSC tuber specimen. A–C. Strong HLA‐I staining in giant cells within the dysplastic cortex (A–B) and the white matter (C). D. CD68 staining, showing positive cells surrounding the giant cells; insert in D shows CD3 immunoreactive cells (T‐lymphocytes) within the same lesion. E–F. TLR2 staining in giant cells within the white matter and in the subependymal nodular lesion (insert: high magnification). G. TLR4 staining in giant cells within the white matter. H. RAGE staining in giant cells (insert) within the dysplastic cortex. Scale bar (in A): A, F, H: 300 μm; B, E, G: 80 μm; C: 160 μm; D: 20 μm. HLA = human leukocyte antigen; RAGE = receptor for advanced glycation end products; TLR = toll‐like receptors; TSC = tuberous sclerosis complex.
In addition, the giant cells at 23 and 34 weeks, displayed immunoreactivity for TLR2, TLR4 and receptor for advanced glycation end products (RAGE) (Figures 7J–L and 9E–H). TLR2, TLR4 and RAGE‐immunopositive cells were not detected in normal appearing perituberal cortex or in age‐matched control specimens. Table 3 summarizes the immunocytochemical features of giant cells in fetal TSC brain.
Table 3.
Immunocytochemical features of fetal tubers.
| Protein expression in giant cells | 23 GW | 23 GW | 27 GW | 32 GW | 34 GW | 38 GW |
|---|---|---|---|---|---|---|
| GFAP | + | + | + | + | + | + |
| GFAPδ. | + | + | + | + | + | + |
| Vimentin | + | + | + | + | + | + |
| Nestin | + | + | + | + | + | + |
| Synaptophysin | – | – | – | – | – | +* |
| Neurofilament | – | – | – | – | – | – |
| HLA class I (HLA‐I) | + | + | + | + | + | + |
| TLR2 | + | + | + | + | + | + |
| TLR4 | + | + | + | + | + | + |
| RAGE | + | + | + | + | + | + |
| pS6 | + | + | + | + | + | + |
| pS6K | + | + | + | + | + | + |
| p4EBP1 | + | + | + | + | + | + |
| c‐Myc | + | + | + | + | + | + |
Immunoreactivity: –, not present; +, present (moderate to strong), >30% positive cells; +*, few positive cells (<10%).
GW = gestational weeks; GFAP = glial fibrillary acidic protein.
Discussion
The present study provides information about the spectrum of neuropathological abnormalities in TSC fetal brain. In two cases (monozygotic twins; with de novo germline mutations in TSC2) after autopsy (performed at 23 GW), we detected cortical tubers and subependymal nodules that showed increased TORC1 activity, a characteristic of TSC‐associated lesions. Although monozygotic, the twins displayed distinct patterns of brain lesions. One twin had a large frontal lesion with features of a SEGA. Congenital SEGA are rarely detected in fetal and neonatal periods 26, 30, 31. Raju and colleagues 31 reported a case in which a SEGA was identified in utero at 19 weeks and confirmed by post‐mortem examination after 33 GW. However, in this case, genetic testing for TSC1 and TSC2 mutations was not performed. Our case is one of the youngest cases with genetically proven TSC examined at autopsy. The tumor was composed by sheets of large, plump glial cells with homogeneously eosinophilic cytoplasm, eccentrically located nuclei and prominent nucleoli that expressed intermediate filament proteins, such as vimentin, nestin and GFAP (including the GFAP δ isoform 23, which is known to be expressed in neuroglial progenitor cells during brain development). These cells were intermingled with small germinal matrix‐like cells, which did not express any of the neural stem cell and glial markers tested. The similarity of the immuno‐phenotype of the giant cells in the SEGA and similar cells in the subependymal nodules and subcortical/cortical lesions observed in the other fetal cases, supports the hypothesis that these cells share a functionally related neuroglial progenitor cell 20. In the 23‐ and 27‐week cases, multiple clusters of giant cells were detected in the deep white matter, adjacent to the germinal matrix, whereas in the 32‐, 34‐ and 38‐week cases, these cells were noted in the CP and molecular layer. These observations are consistent with abnormal migration of the dysplastic cells from the germinal zone. Moreover, the absence of dysmorphic neurons in our study, as well as in previously described TSC fetal cases 9, 29, may suggest that in the temporal evolution of these lesions, the giant cells appear before dysmorphic neurons.
Inactivating TSC1 or TSC2 mutations in neuroglial progenitor cells lead to constitutive activation of the TORC1 signaling cascade, as indicated by increased phosphorylation of S6K and S6 18, and cell‐associated activation of the TORC1 pathway has been detected postnatally in the giant cells in tubers and SEGA 4, 5, 6, 10, 24. In this study, we provide evidence of cell‐associated activation of TORC1 in fetal brain, providing support for the important role of TORC1 hyperactivation in the pathogenesis of TSC brain lesions. We show in different fetal cases (ranging from 23 GW to 34 GW), increased S6K, S6 and 4EBP1 phosphorylation, and increased expression of c‐myc (a downstream transcriptional activator of mTOR expressed in surgically resected cortical tubers; 28) in the giant cells in subependymal nodules, subcortical and cortical lesions (resembling tubers), as well as in the giant cells in the congenital SEGA (23 GW). In addition, the pattern of pS6 staining highlights the complexity of TSC pathology. We detected many small clusters and even isolated, single giant cells scattered throughout the fetal TSC brain. Interestingly, TORC1 activation was not detected in the small, germinal matrix‐like cells within the brain lesions, supporting the hypothesis that a second‐hit mutation in a single progenitor cell gives rise to progeny with hyperactivated TORC1 and subsequent cytomegaly, causing abnormal migration and disrupted cortical lamination [for review see 27]. These microscopic cytoarchitectural alterations, originating in fetal TSC brain, persist throughout development. Accordingly, subtle abnormalities have been also detected in adult TSC brains and may underlie the complex neurological disabilities encountered in TSC patients 22
Loss of TSC1‐TSC2 function, with subsequent constitutive activation of TORC1, is believed to result from bi‐allelic TSC1 or TSC2 gene inactivation. Many TSC‐associated tumors, show LOH at either the TSC1 or TSC2 locus 1, 10. In our study, we screened the population of pS6 positive giant cells in the 23 GW SEGA for LOH at the TSC2 locus. The detection of LOH in this lesion supports the two‐hit model for the pathogenesis of SEGA during fetal brain development.
There is an increasing amount of evidence that suggests that activation of both the innate and adaptive immune system occurs in epileptic human tissue, including cortical tubers from TSC patients undergoing surgery for intractable epilepsy 7 [for reviews see 2, 37]. Whether the activation of inflammatory processes is intrinsic to these lesions or is induced by seizure activity is still a matter of debate. Fetal seizures are rare; however, there have been a few reports of prenatal diagnosis of fetal seizure‐like activity detected by the mother and documented by ultrasonography 19, 34. Seizure‐like activity was not reported in the fetal cases included in this study. We demonstrate, for the first time, that MHC class I and II molecules are expressed in the giant cells from different types of TSC‐associated brain lesions in fetal cases ranging from 23 to 34 GW. We did not detect MHC class I or II immunoreactivity in normal‐appearing peri‐tuberal cortex or in age‐matched control specimens. The activation of TORC1 signaling observed in the giant cells could contribute to the inflammatory response as TOR has been shown to influence both the innate and adaptive immune response 21, 32, 39. Expression of HLA‐I was detected in the same small clusters of cells and single giant cells as pS6. These cells and cell clusters were scattered throughout the subcortical white matter at 23 and 27 GW, as well as in the CP and molecular layer at 32, 34 and 38 GW. These observations suggest that the giant cells may have a role as antigen presenting cells. Whether the expression of MHC class I molecules promotes the accumulation of CD8 positive T cells, as has been observed postnatally in cortical tubers 6, 7, deserves further investigation. CD8 positive T cells, as well as CD68 positive cells (microglia/macrophage cells), were detected within the fetal lesions, surrounding the giant cells. Finally, we provide evidence of activation of the TLR/RAGE pathways in fetal TSC brain. TLR2, TLR4 and RAGE expression was detected in giant cells at different developmental ages, including 23 GW. Interestingly, different TLR/RAGE pathways have recently been suggested to play a role in the mechanisms underlying the intrinsic high epileptogenicity of focal developmental lesions and as causative factor in the epilepsy‐associated autistic like behavior 42; for reviews see 2, 37].
Conclusions
Autopsy findings confirmed the complexity of the brain abnormalities encountered in fetal brain in TSC patients, showing the presence of small clusters of morphologically abnormal cells, as well as single abnormal cells, scattered throughout the cortex and subcortical white matter. These cells show activation of TORC1, supporting the concept that increased TORC1 activity during embryonic brain development underlies the formation of brain lesions in TSC patients. This suggests that a therapeutic window for prenatal intervention in TSC with TOR inhibitors will be just prior or during the critical period of brain lesion formation.
In addition, this study provides evidence for the immunogenicity of giant cells and the prenatal activation of key inflammatory pathways in developing TSC brain lesions. These observations support the role of immune‐inflammatory responses in the dynamic changes occurring over time in TSC lesions (including calcification, cystic change), which may contribute to the pathogenesis of seizures and cognitive impairment in TSC patients.
Acknowledgments
This work was supported by the the National Epilepsy Fund – “Power of the Small”, the Hersenstichting Nederland (NEF 09‐05, EA), Stichting Kinderen Kankervrij (KIKA, EA), EU‐FP7‐project N 202167 (EA), EU FP7 project DEVELAGE (Grant Agreement N 278486; to EA and HA), the National Institute of Neurological Disease and Stroke at the National Institutes of Health (NS045022), the PENN‐Pfizer Collaborative Program and Department of Defense CDMRP TSC Initiative (to PBC). The authors are grateful to Dr. S. Al‐Nasiry (Department of Obstetrics and Gynecology, UMC Radboud, Nijmegen, The Netherlands), Dr M. Sinico (Service d'anatomie pathologique, CHI de Creteil, Creteil, France) and Dr. F. Encha‐Razavi (Service Histologie‐Embryologie‐Cytogénétique, Groupe Hospitalier Necker Enfants‐Malades, Paris Cedex, France) for the selection of the cases and to Dr. M. van Wattingen (Department of Radiology, AMC, Amsterdam, The Netherlands) for advice on the MRI data and to Dr. Robert Fraser, Department of Pathology, IWK Children's Hospital, Halifax, Canada, for referring one of the cases to HBS and LFS for neuropathological examination.
The authors declare that they have no conflict of interest.
References
- 1. Al‐Saleem T, Wessner LL, Scheithauer BW, Patterson K, Roach ES, Dreyer SJ et al (1998) Malignant tumors of the kidney, brain, and soft tissues in children and young adults with the tuberous sclerosis complex. Cancer 83:2208–2216. [PubMed] [Google Scholar]
- 2. Aronica E, Crino PB (2011) Inflammation in epilepsy: clinical observations. Epilepsia 52(Suppl. 3):26–32. [DOI] [PubMed] [Google Scholar]
- 3. Aronica E, Gorter JA, van Jansen GH, van Veelen CW, Rijen PC, Ramkema M, Troost D (2003) Expression and cell distribution of group I and group II metabotropic glutamate receptor subtypes in taylor‐type focal cortical dysplasia. Epilepsia 44:785– 795. [DOI] [PubMed] [Google Scholar]
- 4. Baybis M, Yu J, Lee A, Golden JA, Weiner H, McKhann G, 2nd et al (2004) mTOR cascade activation distinguishes tubers from focal cortical dysplasia. Ann Neurol 56:478–487. [DOI] [PubMed] [Google Scholar]
- 5. Boer K, Troost D, Spliet WG, Redeker S, Crino PB, Aronica E (2007) A neuropathological study of two autopsy cases of syndromic hemimegalencephaly. Neuropathol Appl Neurobiol 33:455–470. [DOI] [PubMed] [Google Scholar]
- 6. Boer K, Jansen K, Nellist M, van den Redeker M, Ouweland AMW, Spliet WGM et al (2008) Inflammatory processes in cortical tubers and subependymal giant cell tumors of tuberous sclerosis complex. Epilepsy Res 78:7–21. [DOI] [PubMed] [Google Scholar]
- 7. Boer K, Crino PB, Gorter JA, Nellist M, Jansen FE, Spliet WG et al (2010) Gene expression analysis of tuberous sclerosis complex cortical tubers reveals increased expression of adhesion and inflammatory factors. Brain Pathol 20:704–719. [DOI] [PMC free article] [PubMed] [Google Scholar]
- 8. Bolton PF (2004) Neuroepileptic correlates of autistic symptomatology in tuberous sclerosis. Ment Retard Dev Disabil Res Rev 2:126–131. [DOI] [PubMed] [Google Scholar]
- 9. Bordarier C, Lellouch‐Tubiana A, Robain O (1994) Cardiac rhabdomyoma and tuberous sclerosis in three fetuses: a neuropathological study. Brain Dev 16:467–471. [DOI] [PubMed] [Google Scholar]
- 10. Chan JA, Zhang H, Roberts PS, Jozwiak S, Wieslawa G, Lewin‐Kowalik J et al (2004) Pathogenesis of tuberous sclerosis subependymal giant cell astrocytomas: biallelic inactivation of TSC1 or TSC2 leads to mTOR activation. J Neuropathol Exp Neurol 63:1236–1242. [DOI] [PubMed] [Google Scholar]
- 11. Chen CP, Liu YP, Huang JK, Chang TY, Chen MR, Chiu NC, Wang W (2005) Contribution of ultrafast magnetic resonance imaging in prenatal diagnosis of sonographically undetected cerebral tuberous sclerosis associated with cardiac rhabdomyomas. Prenat Diagn 25:523–524. [DOI] [PubMed] [Google Scholar]
- 12. Curatolo P, Verdecchia M, Bombardieri R (2002) Tuberous sclerosis complex: a review of neurological aspects. Eur J Paed Neurol 6:15–23. [DOI] [PubMed] [Google Scholar]
- 13. DiMario FJ, Jr (2004) Brain abnormalities in tuberous sclerosis complex. J Child Neurol 19:650–657. [DOI] [PubMed] [Google Scholar]
- 14. Consortium ECTS (1993) Identification and characterization of the tuberous sclerosis gene on chromosome 16. The European Chromosome 16 Tuberous Sclerosis Consortium. Cell 75:1305–1315. [DOI] [PubMed] [Google Scholar]
- 15. Glenn OA (2010) MR imaging of the fetal brain. Ped Radiol 40:68–81. [DOI] [PMC free article] [PubMed] [Google Scholar]
- 16. Hahn JS, Bejar R, Gladson CL (1991) Neonatal subependymal giant cell astrocytoma associated with tuberous sclerosis: MRI, CT, and ultrasound correlation. Neurology 41:124–128. [DOI] [PubMed] [Google Scholar]
- 17. Holmes GL, Stafstrom CE, Tuberous Sclerosis Study G (2007) Tuberous sclerosis complex and epilepsy: recent developments and future challenges. Epilepsia 48:617–630. [DOI] [PubMed] [Google Scholar]
- 18. Huang J, Manning BD (2008) The TSC1‐TSC2 complex: a molecular switchboard controlling cell growth. Biochem J 412:179–190. [DOI] [PMC free article] [PubMed] [Google Scholar]
- 19. Jung E, Lee BY, Huh CY (2008) Prenatal diagnosis of fetal seizure: a case report. J Korean Med Sci 23:906–908. [DOI] [PMC free article] [PubMed] [Google Scholar]
- 20. Lee A, Maldonado M, Baybis M, Walsh CA, Scheithauer B, Yeung R et al (2003) Markers of cellular proliferation are expressed in cortical tubers. Ann Neurol 53:668–673. [DOI] [PubMed] [Google Scholar]
- 21. Lim HK, Choi YA, Park W, Lee T, Ryu SH, Kim SY et al (2003) Phosphatidic acid regulates systemic inflammatory responses by modulating the Akt‐mammalian target of rapamycin‐p70 S6 kinase 1 pathway. J Biol Chem 278:45117–45127. [DOI] [PubMed] [Google Scholar]
- 22. Marcotte L, Aronica E, Baybis M, Crino PB (2012) Cytoarchitectural alterations are widespread in cerebral cortex in tuberous sclerosis complex. Acta Neuropathol 123:685–693. [DOI] [PubMed] [Google Scholar]
- 23. Middeldorp J, Boer K, Sluijs JA, De Filippis L, Encha‐Razavi F, Vescovi AL et al (2010) GFAPdelta in radial glia and subventricular zone progenitors in the developing human cortex. Development 137:313–321. [DOI] [PubMed] [Google Scholar]
- 24. Miyata H, Chiang AC, Vinters HV (2004) Insulin signaling pathways in cortical dysplasia and TSC‐tubers: tissue microarray analysis. Ann Neurol 56:510–519. [DOI] [PubMed] [Google Scholar]
- 25. Mizuguchi M, Takashima S (2001) Neuropathology of tuberous sclerosis. Brain Dev 23:508–515. [DOI] [PubMed] [Google Scholar]
- 26. Oikawa S, Sakamoto K, Kobayashi N (1994) A neonatal huge subependymal giant cell astrocytoma: case report. Neurosurgery 35:748–750. [DOI] [PubMed] [Google Scholar]
- 27. Orlova KA, Crino PB (2010) The tuberous sclerosis complex. Ann N Y Acad Sci 1184:87–105. [DOI] [PMC free article] [PubMed] [Google Scholar]
- 28. Orlova KA, Tsai V, Baybis M, Heuer GG, Sisodiya S, Thom M et al (2010) Early progenitor cell marker expression distinguishes type II from type I focal cortical dysplasias. J Neuropathol Exp Neurol 69:850–863. [DOI] [PMC free article] [PubMed] [Google Scholar]
- 29. Park SH, Pepkowitz SH, Kerfoot C, De Rosa MJ, Poukens V, Wienecke R et al (1997) Tuberous sclerosis in a 20‐week gestation fetus: immunohistochemical study. Acta Neuropathol 94:180–186. [DOI] [PubMed] [Google Scholar]
- 30. Phi JH, Park SH, Chae JH, Hong KH, Park SS, Kang JH et al (2008) Congenital subependymal giant cell astrocytoma: clinical considerations and expression of radial glial cell markers in giant cells. Childs Nerv Syst 24:1499–1503. [DOI] [PubMed] [Google Scholar]
- 31. Raju GP, Urion DK, Sahin M (2007) Neonatal subependymal giant cell astrocytoma: new case and review of literature. Pediatr Neurol 36:128–131. [DOI] [PubMed] [Google Scholar]
- 32. Schmitz F, Heit A, Dreher S, Eisenacher K, Mages J, Haas T et al (2008) Mammalian target of rapamycin (mTOR) orchestrates the defense program of innate immune cells. Eur J Immunol 38:2981–2992. [DOI] [PubMed] [Google Scholar]
- 33. Tien RD, Hesselink JR, Duberg A (1990) Rare subependymal giant‐cell astrocytoma in a neonate with tuberous sclerosis. Am J Neuroradiol 11:1251–1252. [PMC free article] [PubMed] [Google Scholar]
- 34. Usta IM, Adra AM, Nassar AH (2007) Ultrasonographic diagnosis of fetal seizures: a case report and review of the literature. BJOG 114:1031–1033. [DOI] [PubMed] [Google Scholar]
- 35. van den Ouweland AM, Elfferich P, Zonnenberg BA, Arts WF, Kleefstra T, Nellist MD et al (2011) Characterisation of TSC1 promoter deletions in tuberous sclerosis complex patients. Eur J Hum Genet 19:157–163. [DOI] [PMC free article] [PubMed] [Google Scholar]
- 36. van Slegtenhorst M, de Hoogt R, Hermans C, Nellist M, Janssen B, Verhoef S et al (1997) Identification of the tuberous sclerosis gene TSC1 on chromosome 9q34. Science 277:805–808. [DOI] [PubMed] [Google Scholar]
- 37. Vezzani A, Aronica E, Mazarati A, Pittman QJ (2011) Epilepsy and brain inflammation. Exp Neurol 10.1016/j.expneurol.2011.09.033. [DOI] [PubMed] [Google Scholar]
- 38. Vezzani A, Maroso M, Balosso S, Sanchez MA, Bartfai T (2011) IL‐1 receptor/toll‐like receptor signaling in infection, inflammation, stress and neurodegeneration couples hyperexcitability and seizures. Brain Behav Immun 25:1281–1289. [DOI] [PubMed] [Google Scholar]
- 39. Weichhart T, Saemann MD (2009) The multiple facets of mTOR in immunity. Trend Immunol 30:218–226. [DOI] [PubMed] [Google Scholar]
- 40. Wong M (2008) Mechanisms of epileptogenesis in tuberous sclerosis complex and related malformations of cortical development with abnormal glioneuronal proliferation. Epilepsia 49:8–21. [DOI] [PMC free article] [PubMed] [Google Scholar]
- 41. Wortmann SB, Reimer A, Creemers JW, Mullaart RA (2008) Prenatal diagnosis of cerebral lesions in tuberous sclerosis complex (TSC). Case report and review of the literature. Eur J Paediatr Neurol 12:123–126. [DOI] [PubMed] [Google Scholar]
- 42. Zurolo E, Iyer A, Maroso M, Carbonell C, Anink JJ, Ravizza T et al (2011) Activation of toll‐like receptor, RAGE and HMGB1 signalling in malformations of cortical development. Brain 134(Pt 4):1015–1032. [DOI] [PubMed] [Google Scholar]