Abstract
Angiogenesis is a key step in the pathophysiology of tumor growth and metastatic spread. Recently, dynamic contrast-enhanced magnetic resonance imaging (DCE-MRI) has emerged as a method for assessing angiogenesis both during the initial diagnosis and for follow up of anti-angiogenic therapies. In this review, we discuss the technical aspects of implementing DCE-MRI in clinical practice with emphasis on acquisition methods and analytic techniques.
Keywords: pathologic angiogenesis, angiogenic inhibitors, magnetic resonance imaging
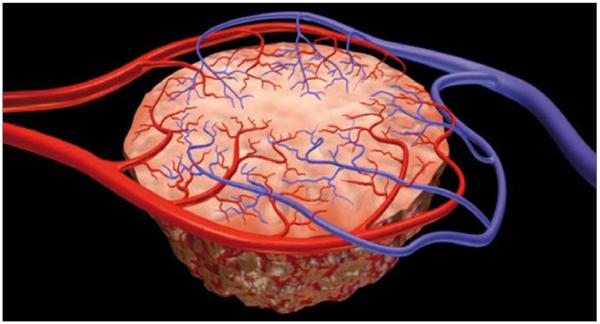
Angiogenesis is the process of new vessel formation from the preexisting “host” vasculature and it occurs physiologically under stringent regulation during embryogenesis, wound healing and menstruation. It also plays a role in pathological conditions such as diabetic retinopathy, rheumatoid arthritis, psoriasis, cardiovascular vulnerable plaques, infections and cancer, where it can become unregulated. Angiogenesis is an essential step in tumor growth and metastases; tumors can only grow to a diameter of ~2–3 mm based on the diffusion limits of O2 in tissue (1). Normal microcirculation within tissues is organized in a hierarchical system of arterioles, capillaries and venules which are arranged to provide sufficient nutrients to maintain normal homeostasis. As tumors grow, the demand for nutrients increases and new vessels are formed. In the newly formed tumor microcirculation, the normal hierarchy is lost and the microcirculation is disorganized, with irregular, tortuous, fragile vessels which are highly permeable (Fig. 1). Permeability is increased because of structural abnormalities in the endothelial lining including large gaps or channels between and within endothelial cells, discontinuous basement membranes and loosely adherent pericytes, resulting in large fenestrations capable of leaking large proteins. Moreover, such vessels express a variety of surface markers associated with their activated angiogenic state. In tumor angiogenesis, several mediators play significant roles such as vascular endothelial growth factor (VEGF), VEGF receptors, integrins, matrix met-allo-proteinases, tyrosine kinases and G protein-coupled receptors.
Figure 1.
Illustration demonstrates anarchic and disorganized nature of tumor vessels.
Dynamic contrast-enhanced magnetic resonance imaging
Conventional contrast-enhanced magnetic resonance imaging (MRI) displays a single snapshot of tumor enhancement after contrast administration; although the anatomical information derived from such images is valuable, it lacks functional information. Dynamic contrast-enhanced magnetic resonance imaging (DCE-MRI), which relies on fast MRI sequences obtained before, during and after the rapid intravenous (IV) administration of a gadolinium (Gd) based contrast agent is analogous to a movie and is an emerging imaging method to assess tumor angiogenesis. DCE-MRI enables the depiction of physiologic alterations as well as morphologic changes. IV contrast agents used for both conventional and DCE MRI are mainly low molecular weight contrast media (e.g., Gd-DTPA; molecular weight, 567 Daltons). During DCE-MRI, tumors demonstrate rapid, intense enhancement followed by a relatively rapid washout compared to normal tissue (2).
Image acquisition for DCE-MRI and data analysis
The U. S. National Cancer Institute guidelines for acquiring DCE-MRI to assess tumor vascularity require a minimum of three sections through the tumor and imaging volume that includes a region outside the tumor, such as an artery or muscle for normalization (3). Quantity of the injected contrast material should be standardized according to the patient’s body weight and preferentially should be injected at a constant rate with a power injector. In our institution, we perform DCE-MRI on a 1.5 Tesla magnet (except for brain and prostate, for which we use a 3 Tesla magnet) using 3D spoiled gradient echo sequences. The imaging parameters for various body parts are summarized in Table. After injection, serial image sets are obtained at temporal resolutions ranging from 2–15 seconds for 5–10 minutes post-injection.
Table.
Parameters used for DCE-MRI of several body parts at the U. S. National Cancer Institute
| Organ/site | TR/TE (ms) |
Slice thickness (mm) |
Image matrix |
Flip angle (°) |
Number of slices |
Number of set of images |
Contrast injection timing and rate |
Comments | |
|---|---|---|---|---|---|---|---|---|---|
| Brain | Unenhanced T1 map | 6/2 | 5 | 256 × 256 | 5 | 28 | - | - | - |
| DCE-MRI | 6/2 | 5 | 256 × 256 | 15 | 840 | 30 | 10 unenhanced sets are acquired before CM injection |
Continuous scanning | |
| Abdomen, chest, pelvis |
Unenhanced T1 map | 9/4 | 5 | 264×288 | 5 | 54 | - | - | - |
| DCE-MRI | 9/4 | 5 | 264×288 | 15 | 1242 | 23 | 3 unenhanced sets are acquired before CM injection |
Images are obtained every 30 seconds with breath-hold |
|
| Prostate | Unenhanced T1 map | 6/2 | 6 | 256 × 256 | 5 | 10 | - | - | - |
| DCE-MRI | 6/2 | 6 | 256 × 256 | 15 | 1000 | 100 | 3 unenhanced sets are acquired before CM injection |
Continuous scanning | |
| Breast | Unenhanced T1 map | 6/4 | 5 | 264 × 288 | 5 | 34 | - | - | - |
| DCE-MRI | 6/4 | 5 | 264 × 288 | 15 | 510 | 15 | 3 unenhanced sets are acquired before CM injection |
Continuous scanning |
DCE-MRI, dynamic contrast-enhanced magnetic resonance imaging; TR, repetition time; TE, echo time; CM, contrast material.
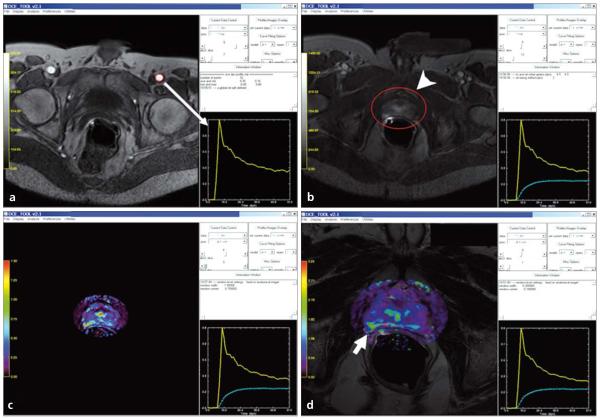
Signal intensity (SI) enhancement patterns on T1W images can be evaluated by two different analysis techniques: Semi-quantitative techniques describe the shape of the SI vs. time curve, its onset time, gradient of upslope of enhancement curves, maximum SI and washout gradient. Semi-quantitative methods have the advantage of being simple to perform and enable the straightforward calculation of SI changes. However, this method depends on SI which is notoriously dependent on scanning conditions (e.g., MRI vendor, pulse sequence, scaling). In order to avoid these issues SI should be converted into Gd concentration by applying a T1 map to the precontrast tumor images. Additionally, semi-quantitative techniques have not intrinsic physiologic meaning. Quantitative techniques depend on Gd concentration curves over time and use pharmacokinetic models to calculate permeability constants. Dynamic imaging data obtained with DCE-MRI can generate curves which are mathematically fit to two compartment pharmacokinetic models. For functional analysis of tissue microcirculation, Tofts et al. proposed in a consensus paper the kinetic parameters Ktrans (transendothelial transport of contrast medium from vascular compartment to the tumor interstitium [washin]), kep (reverse transport parameter of contrast medium back into the vascular space [washout]), fpV (plasma volume fraction compared to whole tissue volume) and Ve (extravascular, extra-cellular volume fraction of the tumor; the fraction of tumor volume occupied by extravascular extracellular space [EES]) to describe tumor and tissue permeability (Fig. 2) (4). Physiologically, the value of Ktrans is tissue dependent; Ktrans will indicate the tissue perfusion per unit volume, if the contrast uptake of the tissue is flow limited; on the other hand, Ktrans indicates the tissue permeability, if the uptake is permeability limited. In majority of tumors, Ktrans indicates a combination of both flow and permeability properties of the tissue and high Ktrans values usually reflect both high permeability and high perfusion. This is a fundamental limitation of DCE-MRI, namely the parameters it generates are inherently ambiguous with regard to their physiologic significance. Size of the contrast agent used may also affect Ktrans value; with macromolecular contrast agents (albumin-Gd-DTPA, dextran-Gd complexes, Gd-viral particles, Gd-liposomes, Gd-dendrimers etc.) Ktrans decreases reflecting the permeability status of the tissue for larger macro-molecules (5). Since tumor vessels tend to have larger pore sizes than normal vessels, DCE-MRI with macromolecular contrast agents may be more definitive for tumor vs. other conditions such as inflammation. However, a limitation of DCE-MRI with macromolecules is that the overall enhancement is reduced leading to signal to noise ratio (SNR) reductions. The arterial input function (AIF) can be used in conjunction with a two compartment model to insure that the DCE parameters are not influenced by contrast injection rates or the cardiovascular condition of the patient. The AIF optimizes the kinetic analysis by measuring the signal from an artery near the tumor and adjusting the results according to the quality of the AIF. If, however, there are artifacts introduced during acquisition of the AIF, it can propagate additional errors into the analysis (Fig. 3) (6).
Figure 2.
Illustration of two-compartment model demonstrates the exchange of contrast between plasma and extravascular extracellular space.
Figure 3.
a–d. Screen captures of quantitative analysis of prostate DCE-MRI on DCE-Tool (Philips Healthcare, Cleveland, Ohio, USA). First, an arterial input function (yellow graph) is defined by using the left femoral artery (red circle) (arrow) (a); secondly, a tumor region of interest containing tumor is selected (arrowhead) and a contrast uptake delay time is calculated (dashed green graph) (b); then kinetic parameter maps are obtained (c), which can be overlaid with T2W images (d): overlaid color-coded Ktrans map and T2W image delineates the tumor lesion located at the right peripheral zone of the prostate (short arrow, d).
Clinical applications
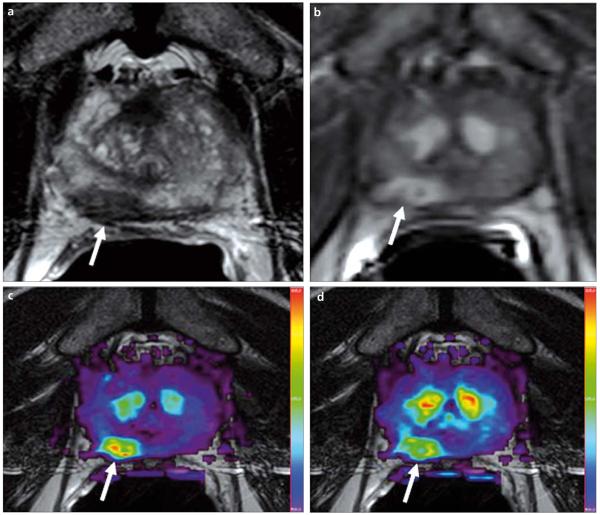
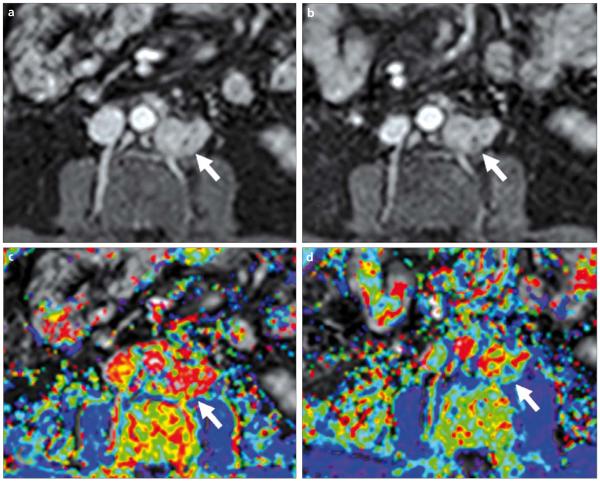
DCE-MRI has been used for several clinical situations including for the initial diagnosis and staging of tumors (7-9). Recently DCE-MRI has been used as a biomarker for monitoring response to conventional chemotherapy and/or antiangiogenic therapy, as well as to radiotherapy and embolotherapy for various cancer types such as breast, prostate, colon, and gynecologic malignancies (10-18). These studies employing DCE-MRI underscore its potential as a noninvasive biomarker for tumor angiogenesis but further clinical studies in larger patient populations with appropriate validation are needed (Figs. 4-6).
Figure 4.
a–d. A 69-year-old male with prostate cancer. Axial T2W MR image demonstrates a low signal intensity focus at the right mid peripheral zone (arrow) (a). The lesion shows increased enhancement on axial T1W DCE-MR image (b); fusion of color-coded Ktrans (c) and Kep (d) maps delineate the tumor lesion (arrows).
Figure 6.
a-d. A 57-year-old male with metastatic prostate cancer to the retroperitoneal lymph nodes. DCE-MR images were obtained before (a, c) and after (b, d) anti-angiogenic therapy. T1W images (upper row) reveal subtle changes within the lesion. Ktrans color maps (lower row) show significant reduction in values, consistent with response to anti-angiogenic therapy (arrows).
Challenges
Implementation of DCE-MRI into clinical imaging protocols poses several challenges. DCE-MRI is being performed more frequently than it was 5 years ago, but there is currently no consensus on which imaging protocol should be used. Moreover, institutions often use their own analysis tool to evaluate the data and greater standardization for quantification is needed. It is critical that repeatability and reproducibility studies be performed to determine the magnitude of the effect that can be measured. For instance, it is not uncommon for two DCE-MRI studies to vary in their results by 20%. In that case, a 40% drug effect is needed to measure a blood flow or permeability difference after therapy. DCE-MRI is also limited in organs with physiologic motion such as the lungs and liver, and breath holding, deformation registration or navigator pulses may be needed to correct this (19, 20). Importantly, there is no adequate validation methodology for DCE-MRI, specifically for assessing the response to antiangiogenic treatment, since DCE-MRI is a “live” physiologic assay and many of the in vitro assays (e.g., mean vascular density [MVD]) are “static”. Despite its limitations, MVD based on factor VIII, CD34 staining, vascular maturation index, quantification of serum and tumoral VEGF and other angiogenic mediators has been used to validate DCE-MRI. The tumor vasculature is intrinsically heterogeneous and, as a result, whole tumor regions of interest (ROIs) may not demonstrate responses to antiangiogenic therapy that occur in some parts of the tumor but not in other parts (6). Finally, DCE-MRI may not be feasible for some patient groups, especially individuals with renal failure (due to the risk of nephrogenic systemic fibrosis), those with implanted metallic devices (cardiac pacemakers, prosthetic valves, intracranial aneurysmal clips, shrapnel injury) and those with severe claustrophobia.
Future directions
Although DCE-MRI is not a perfect test for angiogenesis, it is nonetheless a promising and readily available tool, which can serve as a biomarker for monitoring response to angiogenic inhibitor therapies. DCE-MRI with low molecular weight contrast agents can be readily integrated into the clinical work flow and can be considered an “off-the-shelf” technique. Comparisons between centers, however, may be limited. On the other hand, performing DCE-MRI with macromolecular contrast agents, which do not leak as easily as low molecular weight agents, may be more specific for tumor angiogenesis and may therefore provide better response assessment to therapy. Moreover, “selective” targeted DCE-MRI can be potentially performed by targeting epitopes expressed specifically on areas of activated endothelium found at sites of angiogenesis; integrins are the most studied among those target epitopes and although it is a relatively new DCE-MRI approach, several preclinical research studies have focused on exploiting this target as an imaging biomarker.
Conclusion
Angiogenesis is a key step in tumor growth and metastatic spread. Recently DCE-MRI has emerged as a functional method for the assessment of angio-genesis for both initial diagnosis and for follow-up of anti-angiogenic drug therapy. Application of consistent methodologies for image acquisition and data analysis together with better validation strategies will increase the value of DCE-MRI as a functional imaging method.
Figure 5.
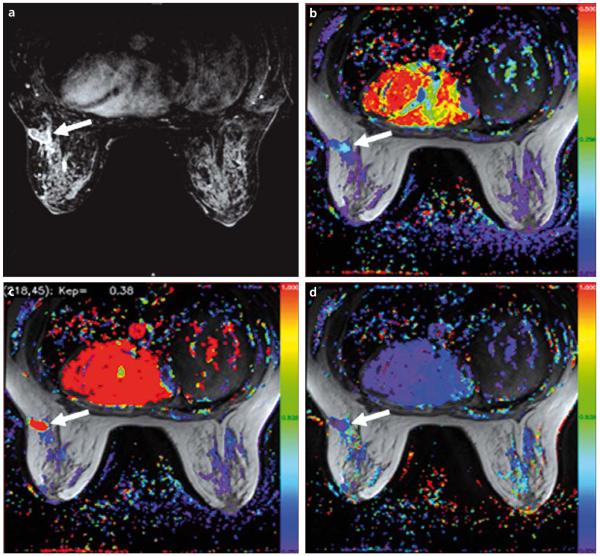
a–d. A 43-year-old female with breast cancer. Axial T1W DCE-MR image demonstrates an enhancing lesion in the left breast (arrow) (a). Color-coded Ktrans (b), Kep (c) and Ve (d) maps delineate the tumor (arrows).
References
- 1.Folkman J. Tumor angiogenesis: therapeutic implications. N Engl J Med. 1971;285:1182–1186. doi: 10.1056/NEJM197111182852108. [DOI] [PubMed] [Google Scholar]
- 2.Choyke PL, Dwyer AJ, Knopp MV. Functional tumor imaging with dynamic contrast-enhanced magnetic resonance imaging. J Magn Reson Imaging. 2003;17:509–520. doi: 10.1002/jmri.10304. [DOI] [PubMed] [Google Scholar]
- 3.NCI CIP guidelines. http://imaging.cancer.gov/clinicaltrials/guideline.
- 4.Tofts PS, Brix G, Buckley DL, et al. Estimating kinetic parameters from dynamic contrast-enhanced T1-weighted MRI of a diffusable tracer: standardized quantities and symbols. J Magn Reson Imaging. 1999;10:223–232. doi: 10.1002/(sici)1522-2586(199909)10:3<223::aid-jmri2>3.0.co;2-s. [DOI] [PubMed] [Google Scholar]
- 5.De Lussanet QG, Langereis S, Beets-Tan RG, et al. Dynamic contrast-enhanced MR imaging: kinetic parameters and molecular weight of dendritic contrast agents in tumor angiogenesis in mice. Radiology. 2005;235:65–72. doi: 10.1148/radiol.2351040411. [DOI] [PubMed] [Google Scholar]
- 6.Padhani AR, Leach MO. Antivascular cancer treatments: functional assessments by dynamic contrast-enhanced magnetic resonance imaging. Abdom Imaging. 2005;30:324–341. doi: 10.1007/s00261-004-0265-5. [DOI] [PubMed] [Google Scholar]
- 7.Liu PF, Krestin GP, Huch RA, Göhde SC, Caduff RF, Debatin JF. MRI of the uterus, uterine cervix, and vagina: diagnostic performance of dynamic contrast-enhanced fast multiplanar gradient-echo imaging in comparison with fast spin-echo T2- weighted pulse imaging. Eur Radiol. 1998;8:1433–1440. doi: 10.1007/s003300050569. [DOI] [PubMed] [Google Scholar]
- 8.Jager GJ, Ruijter ET, van de Kaa CA, et al. Dynamic TurboFLASH subtraction technique for contrast-enhanced MR imaging of the prostate: correlation with histopathologic results. Radiology. 1997;203:645–652. doi: 10.1148/radiology.203.3.9169683. [DOI] [PubMed] [Google Scholar]
- 9.Ocak I, Bernardo M, Metzger G, et al. Dynamic contrast-enhanced MRI of prostate cancer at 3 T: a study of pharmacokinetic parameters. AJR Am J Roentgenol. 2007;189:849. doi: 10.2214/AJR.06.1329. [DOI] [PubMed] [Google Scholar]
- 10.Barentsz JO, Berger-Hartog O, Witjes JA, et al. Evaluation of chemotherapy in advanced urinary bladder cancer with fast dynamic contrast-enhanced MR imaging. Radiology. 1998;207:791–797. doi: 10.1148/radiology.207.3.9609906. [DOI] [PubMed] [Google Scholar]
- 11.Reddick WE, Taylor JS, Fletcher BD. Dynamic MR imaging (DEMRI) of microcirculation in bone sarcoma. J Magn Reson Imaging. 1999;10:277–285. doi: 10.1002/(sici)1522-2586(199909)10:3<277::aid-jmri8>3.0.co;2-s. [DOI] [PubMed] [Google Scholar]
- 12.Devries AF, Griebel J, Kremser C, et al. Tumor microcirculation evaluated by dynamic magnetic resonance imaging predicts therapy outcome for primary rectal carcinoma. Cancer Res. 2001;61:2513–2516. [PubMed] [Google Scholar]
- 13.Hayes C, Padhani AR, Leach MO. Assessing changes in tumour vascular function using dynamic contrast-enhanced magnetic resonance imaging. NMR Biomed. 2002;15:154–163. doi: 10.1002/nbm.756. [DOI] [PubMed] [Google Scholar]
- 14.Mayr NA, Yuh WT, Arnholt JC, et al. Pixel analysis of MR perfusion imaging in predicting radiation therapy outcome in cervical cancer. J Magn Reson Imaging. 2000;12:1027–1033. doi: 10.1002/1522-2586(200012)12:6<1027::aid-jmri31>3.0.co;2-5. [DOI] [PubMed] [Google Scholar]
- 15.Thukral A, Thomasson DM, Chow CK, et al. Inflammatory breast cancer: dynamic contrast-enhanced MR in patients receiving bevacizumab--initial experience. Radiology. 2007;244:727–735. doi: 10.1148/radiol.2443060926. [DOI] [PubMed] [Google Scholar]
- 16.Wedam SB, Low JA, Yang SX, et al. Antiangiogenic and antitumor effects of bevacizumab in patients with inflammatory and locally advanced breast cancer. J Clin Oncol. 2006;24:769–777. doi: 10.1200/JCO.2005.03.4645. [DOI] [PubMed] [Google Scholar]
- 17.Kosaka N, Uematsu H, Kimura H, et al. Assessment of the vascularity of uterine leiomyomas using double-echo dynamic perfusion-weighted MRI with the firstpass pharmacokinetic model: correlation with histopathology. Invest Radiol. 2007;42:629–635. doi: 10.1097/RLI.0b013e318059ae69. [DOI] [PubMed] [Google Scholar]
- 18.Hoskin PJ, Saunders MI, Goodchild K, Powell ME, Taylor NJ, Baddeley H. Dynamic contrast enhanced magnetic resonance scanning as a predictor of response to accelerated radiotherapy for advanced head and neck cancer. Br J Radiol. 1999;72:1093–1098. doi: 10.1259/bjr.72.863.10700827. [DOI] [PubMed] [Google Scholar]
- 19.Taylor NJ, Lankester KJ, Stirling JJ, et al. Application, of navigator techniques to breath-hold DCE-MRI studies of the liver; Proceedings of the International Society of Magnetic Resonance in Medicine, 11th Scientific Meeting; Toronto, Canada. 2003.p. 1306. [Google Scholar]
- 20.Castro MA, Yao J, Turkbey B, Pang Y, Choyke PL, Thomasson D. Improvement of DCE-MR images to study liver cancer by means of a deformable registration algorithm. RSNA; Chicago, USA: 2008. p. 691. [Google Scholar]


