

ABSTRACT
Strain tolerance to toxic metabolites is an important trait for many biotechnological applications, such as the production of solvents as biofuels or commodity chemicals. Engineering a complex cellular phenotype, such as solvent tolerance, requires the coordinated and tuned expression of several genes. Using combinations of heat shock proteins (HSPs), we engineered a semisynthetic stress response system in Escherichia coli capable of tolerating high levels of toxic solvents. Simultaneous overexpression of the HSPs GrpE and GroESL resulted in a 2-fold increase in viable cells (CFU) after exposure to 5% (vol/vol) ethanol for 24 h. Co-overexpression of GroESL and ClpB on coexisting plasmids resulted in 1,130%, 78%, and 25% increases in CFU after 24 h in 5% ethanol, 1% n-butanol, and 1% i-butanol, respectively. Co-overexpression of GrpE, GroESL, and ClpB on a single plasmid produced 200%, 390%, and 78% increases in CFU after 24 h in 7% ethanol, 1% n-butanol, or 25% 1,2,4-butanetriol, respectively. Overexpression of other autologous HSPs (DnaK, DnaJ, IbpA, and IbpB) alone or in combinations failed to improve tolerance. Expression levels of HSP genes, tuned through inducible promoters and the plasmid copy number, affected the effectiveness of the engineered stress response system. Taken together, these data demonstrate that tuned co-overexpression of GroES, GroEL, ClpB, and GrpE can be engaged to engineer a semisynthetic stress response system capable of greatly increasing the tolerance of E. coli to solvents and provides a starting platform for engineering customized tolerance to a wide variety of toxic chemicals.
IMPORTANCE
Microbial production of useful chemicals is often limited by the toxicity of desired products, feedstock impurities, and undesired side products. Improving tolerance is an essential step in the development of practical platform organisms for production of a wide range of chemicals. By overexpressing autologous heat shock proteins in Escherichia coli, we have developed a modular semisynthetic stress response system capable of improving tolerance to ethanol, n-butanol, and potentially other toxic solvents. Using this system, we demonstrate that a practical stress response system requires both tuning of individual gene components and a reliable framework for gene expression. This system can be used to seek out new interacting partners to improve the tolerance phenotype and can be used in the development of more robust solvent production strains.
Introduction
Solvent tolerance is a complex, multigenic phenotype stemming from interactions of a variety of cellular programs and remains a limiting factor for the production of chemicals and biofuels from renewable resources (1–4). Improving tolerance in an organism requires a complex response utilizing simultaneous modifications to multiple genes and pathways. Due not only to the individual complexity of responses to stress but also to the interconnected nature of those responses, multigenic approaches utilizing a better understanding of those processes are essential to producing a more tolerant organism. Microorganisms engage several mechanisms for resolving solvent stress (1–3). The general stress response system is typically the first line of defense against a large number of stresses, including heat, cold, and solvent stress (5). The ubiquitous heat shock proteins (HSPs), the primary members of the general stress response system, play an essential role in the folding and transport of proteins, as well as remediation of damaged or misfolded proteins (Fig. 1). The Escherichia coli GroEL protein forms a set of two heptameric rings that are capped by the GroES protein, also in a heptameric conformation (Fig. 1). Upon binding of an unfolded or misfolded protein to the hydrophobic interior of the GroEL cylindrical structure, the GroES heptamer seals the compartment and causes the bound substrate protein to be released from the wall for a folding attempt. ATP is consumed upon release of the folded protein. The DnaK system, comprised of the chaperone DnaK and its cochaperones, DnaJ and GrpE, works on partially folded nascent proteins as well as denatured proteins (6). In this system, DnaJ binds to unfolded proteins facilitating interaction with DnaK, which hydrolyzes ATP to refold proteins (7). GrpE acts as a nucleotide exchange factor, removing the bound ADP, thus allowing a new ATP molecule to bind to DnaK and the folded protein to be released from the complex (8). The ClpB chaperone acts as a method to disaggregate proteins. The majority of the Clp proteins in E. coli function as part of a proteolytic system with ClpP (9). ClpB, however, acts specifically as part the DnaKJE multichaperone system to disaggregate proteins and allow their refolding (45).
FIG 1 .
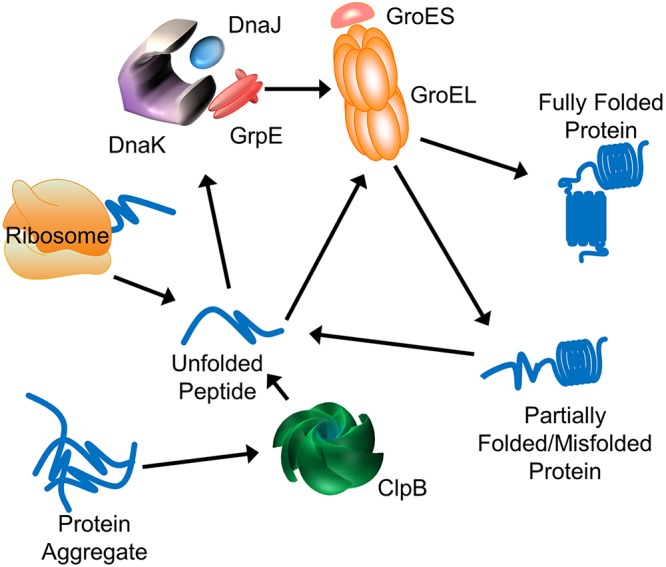
Schematic for folding pathways of both nascent and misfolded proteins in E. coli. The GroESL and DnaKJE systems function in folding of a wide variety of proteins, while ClpB functions to break apart protein aggregates, allowing for proper refolding.
HSPs have been identified as part of the solvent stress response in a variety of organisms, including Clostridium acetobutylicum and Lactobacillus brevis (10–13). It has been shown that overexpression of autologous GroESL in C. acetobutylicum results in both improved solvent tolerance and improved solvent production (14). Although upregulation of HSPs in response to solvent stress has been identified, studies using genomic libraries have often failed to identify them as overexpression targets (15, 16). More recently, transcriptional upregulation of HSP genes has been identified in tolerance enrichment studies for ethanol in E. coli (17). Additionally, transcriptional studies have identified upregulation of HSP genes in response to n-butanol (18) or i-butanol (18, 19) stress in E. coli. Finally, HSP genes were shown to be upregulated upon carboxylic acid (butyric and acetic) stress (e.g., see reference 10). Thus, HSP genes appear to be upregulated upon a broad variety of toxic chemical stresses. Heterologous HSPs have also been used to improve organic solvent tolerance in E. coli (20, 21).
Overexpression of combinations of autologous HSPs has been used to improve soluble protein yields of recombinantly expressed proteins in E. coli (22, 23). Chaperone systems, including GroESL, DnaKJE, ClpB, and the small heat shock proteins IbpA and IbpB, were overexpressed using a multiplasmid system to regulate their expression to stoichiometrically appropriate levels based on their presumed mechanisms of action. Expression levels were modulated by inducible promoters and the plasmid copy number. The resulting chaperone-based strategy, when combined with a modified protocol to allow for longer protein folding times, greatly increased soluble protein fractions (24). However, the system did not perform consistently, and different combinations of HSPs were needed for each of the recombinant proteins examined. Additionally, a substrate-optimized GroESL complex to further specialize the role of chaperones in folding recombinant proteins has been produced (25). This system successfully improved folding for a single protein, green fluorescent protein (GFP), but caused decreases in the more general function of GroESL within the cell.
We have recently demonstrated that overexpression of the E. coli GroESL proteins improved tolerance to a variety of toxic solvents, apparently in a solvent-agnostic manner (26). Using a plasmid-based expression system, we showed significant increases in growth and survivability in the presence of several toxic alcohols: ethanol, butanetriol (BT), and n-, i-, and 2-butanol. These results suggest that HSPs can be engaged to improve solvent tolerance in E. coli. In this study, we hypothesized that overexpression of other HSPs in E. coli could produce an improved solvent tolerance phenotype and that combinations of those HSPs could produce an additive or possibly supra-additive tolerance effect. Based on the biology of the HSP response, we examined the expression of GrpE and ClpB alone and in combination with the GroESL system. The two genes of the GroESL system were expressed from their stress-responsive native promoter, which was previously shown to be best for achieving enhanced tolerance (26). Expression of GrpE and ClpB was tuned based on the inducible lac promoter (Plac) and the plasmid copy number. We show that tuned coexpression of combinations of these four genes can be used as a foundation to build a customized engineered system to achieve tolerance to toxic chemicals.
RESULTS
Co-overexpression of GroESL with GrpE or GrpE with ClpB imparts enhanced ethanol tolerance.
We desired to test the hypothesis that co-overexpression of multiple HSPs could cooperate to provide additive benefits above single gene overexpression. We have previously shown that GroESL overexpression (by 25- to 70-fold) can improve solvent tolerance when overexpressed from its native promoter (26). Here we explored beneficial interactions and cooperative function when HSP genes are overexpressed in tandem. We chose to examine the combination of grpE, clpB, and the groESL operon. All members of the protein folding cascade (Fig. 1) were examined as overexpression targets. Of the HSPs examined, ClpB and GrpE demonstrated the most significant improvements in tolerance when overexpressed, and the data shown here present those results. Other HSPs, specifically DnaK, DnaJ, IbpA, and IbpB, when overexpressed alone or in combination with members of the cascade failed to produce improvements and often decreased survival (see below). The first combination examined was the three-gene combination: the groESL operon, expressed by its native promoter on a medium-copy-number vector (pAC-ESN; 15 copies/cell [27]) (Table 1), and the grpE gene expressed under Plac on a high-copy-number plasmid (pZE-GL, 50 to 70 copies/cell [28]) (Table 1 and Fig. 2). Enhanced expression of GrpE was accomplished by induction with 0.1 mM isopropyl-β-d-thiogalactopyranoside (IPTG) (see below). When grown in 5% ethanol with 3% ethanol pretreatment, MG1655(pZE-GL, pAC-Ctl) and MG1655(pZE-Ctl, pAC-ESN) reached higher final optical densities, of 0.356 and 0.384, respectively, compared to a final optical density of 0.314 for the control (P = 0.007 and P = 0.005, respectively). We note that this growth assay is a stringent test to assess tolerance under active growth conditions, but this does not imply that these strains would reach these relatively low cell densities. The co-overexpression strain, MG1655(pZE-GL, pAC-ESN), demonstrated the highest final optical density (0.441) at 24 h (P = 0.002). All test strains were growing after 24 h of exposure to 5% ethanol, while the control strains appeared to have plateaued. Combined overexpression of GrpE and GroESL demonstrates the ability of HSPs to cooperate in enhancing tolerance above their individual contributions.
TABLE 1 .
Plasmids used in this work
| Plasmid | Antibiotic resistancea | Gene(s) expressed (promoterb) | Origin of replication | Copy no. (37°C) | Previous name or source (reference) |
|---|---|---|---|---|---|
| pAC-Ctl | Cmr Tcr | p15A | 15 | pACYC184c (23) | |
| pAC-ESN | Cmr | groES groEL (nat) | p15A | pAC-groESL (22) | |
| pZE-Ctl | Kmr | ColE1 | 5–70 | pZE23MCSd (24) | |
| pZE-GL | Kmr | grpE (lac) | ColE1 | This study | |
| pZE-CL | Kmr | clpB (lac) | ColE1 | This study | |
| pZS-Ctl | Apr | SC101 | 10–12 | pZS13Lucd (24) | |
| pZS-GL | Apr | grpE (lac) | SC101 | This study | |
| pZS-CL | Apr | clpB (lac) | SC101 | This study | |
| pZS-ESN | Apr | groES groEL (nat) | SC101 | This study | |
| pZS-CLGL | Apr | clpB (lac) grpE (lac) | SC101 | This study | |
| pZS-CL GLESN | Apr | clpB (lac) grpE (lac) | SC101 | This study | |
| groES groEL (nat) |
Cmr, chloramphenicol resistance; Apr, ampicillin; Kmr, kanamycin resistance.
nat, native promoter; lac, lac promoter.
NEB (New England Biolabs), Beverly, MA.
Expressys, Ruelzheim, Germany.
FIG 2 .
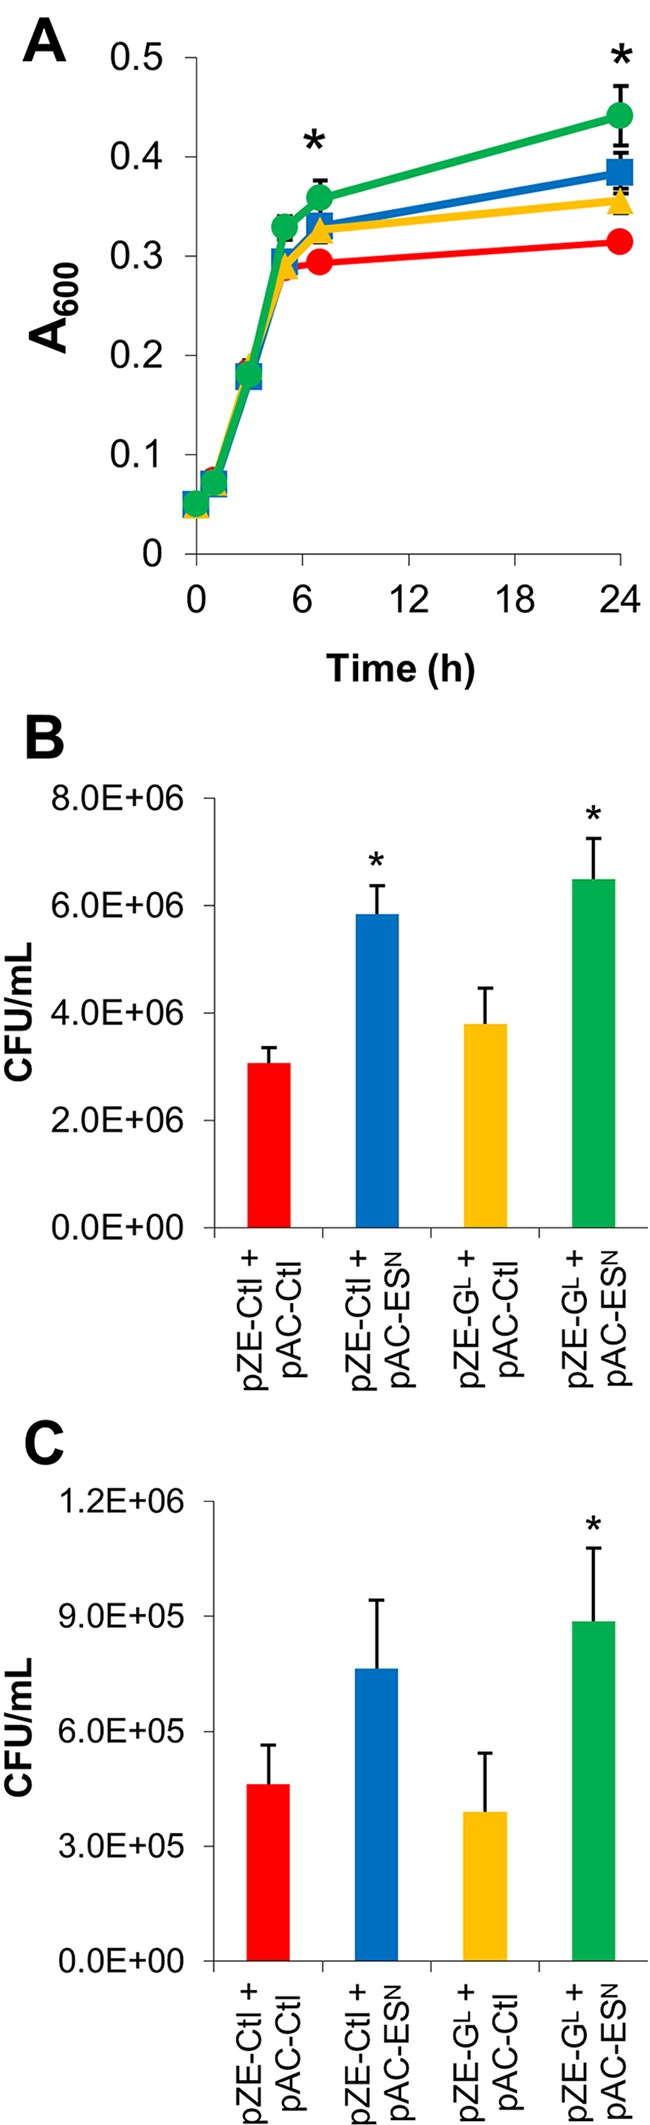
Tolerance assays for co-overexpression of autologous GroESL and GrpE with growth in 5% ethanol with 0.1 mM IPTG and a 3% ethanol pretreatment. (A) A600 growth-based measurements over 48 h for control (red), GroESL overexpression (blue), GrpE overexpression (yellow), and GroESL and GrpE overexpression (green) strains. “*” indicates a statistically significant increase of MG1655(pZE-GL, pAC-ESN), MG1655(pZE-GL, pAC-Ctl), and MG1655(pZE-Ctl, pAC-ESN) over MG1655(pZE-Ctl, pAC-Ctl) (P < 0.05). (B) Viable cell counts (CFU/ml) performed after 24 h of growth in the presence of 5% ethanol. “*” indicates a statistically significant increase from the control strain, MG1655(pZE-Ctl, pAC-Ctl) (P < 0.05). (C) Viable cell counts (CFU/ml) performed after 48 h growth in the presence of 5% ethanol. “*” indicates a statistically significant increase from MG1655(pZE-Ctl, pAC-Ctl) (P < 0.05). Data are from 3 biological replicates. Error bars indicate standard errors between replicates.
Tolerance was also tested using the 24-h cell viability (CFU) assay (Fig. 2B), which is meant to capture the ability of cells to survive and presumably produce a product under severe solvent stress conditions. Co-overexpression of GrpE and GroESL produced a 2.1-fold increase in the number of CFU/ml over that for the double-plasmid control. Overexpression of GroESL alone produces a 1.9-fold increase in CFU/ml, representing a significant improvement from results for the control, but no statistically significant difference was observed between the overexpression of GroESL and the combination of GroESL and GrpE. Overexpression of GrpE alone did not produce a significant difference from results for the double control. This same trend was observed after 48 h of exposure to 5% ethanol: overexpression of GroESL and GrpE produced a 1.9-fold increase in viable cells over the number for the double-plasmid control, and GroESL alone produced a 1.7-fold increase (Fig. 2C). Although the combination of GroESL and GrpE overexpression resulted in increased cell density and growth above those of the control, their combination failed to produce a significant increase in the CFU counts compared to the overexpression of GroESL alone. This difference highlights the importance of utilizing multiple assays to test tolerance. Cell density measurements allow for observation of cell growth under a high stress load, while viable cell counts provide a picture of the actual survival of a strain when exposed to a toxic solvent.
Next, we examined co-overexpression of ClpB and GrpE, whereby each gene was expressed on its own plasmid (pZE-CL and pZS-GL) and under control of Plac (Fig. 3A). In this part of the study, we aimed to modulate the level of expression of these genes by varying the IPTG concentration and the copy numbers of the plasmids employed and then assess the impact of these modulated expression levels on ethanol tolerance. In this system, the best induction level we examined was seen with 0.1 mM IPTG (Fig. 3). With 0.1 mM IPTG, the double-plasmid control, MG1655(pZE-Ctl, pZS-Ctl), produced approximately 3 doublings and reached a final A600 value of 0.4 in 5% ethanol. The co-overexpression strain, MG1655(pZE-CL, pZS-GL), demonstrated a higher growth rate, reaching an A600 of 0.5 in the first 7 h of growth, and reached a final optical density of 0.548 at 24 h. Each of the individual gene expression sets, MG1655(pZE-CL, pZS-Ctl) and MG1655(pZE-Ctl, pZS-GL), however, performed worse than the double-plasmid control. This represented a significant increase for the dual-expression system over all other combinations with greater than 99% confidence. The supraadditive effect indicates a cooperative effect achieved by the overexpression of both genes that is not observed with their independent expression. Effects such as this further serve to highlight the necessity for screening combinations of genes rather than individual members to identify optimal improvements for complex cellular properties. The need to integrate multiple genes is an important feature of solvent tolerance and other complex phenotypes. Single gene mutations or integrations have produced only small increases in tolerance (2). Only through examinations of multiple genes can large steps forward be made in the development of more-tolerant organisms.
FIG 3 .
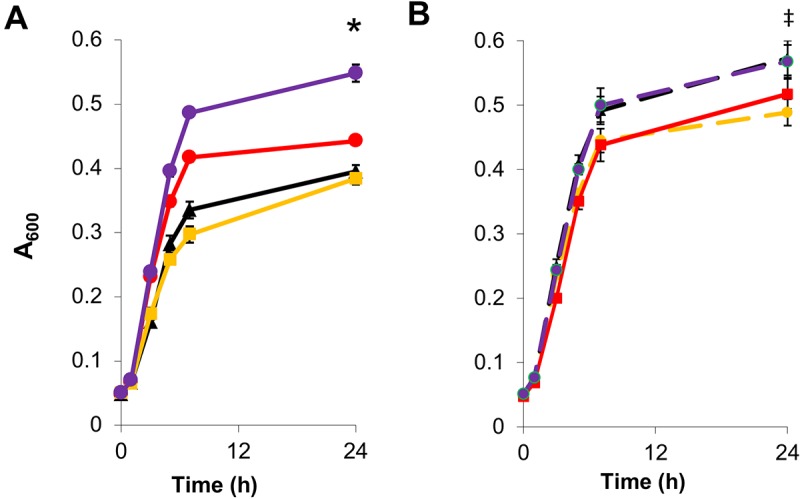
Impact of expression levels of clpB and grpE on cell growth under ethanol stress (5%) with IPTG induction. (A) ClpB overexpressed on the high-copy-number ColE1 ori-containing vector and GrpE overexpressed on the low-copy-number pSC101 ori-containing vector with 0.1 mM IPTG. MG1655(pZE-Ctl, pZS-Ctl) (red), MG1655,(pZE-CL, pZS-Ctl) (black), MG1655(pZE-Ctl, pZS-GL) (yellow), and MG1655(pZE-CL, pZS-GL) (purple) were used. “*” indicates a statistically significant increase of MG1655(pZE-CL, pZS-GL) compared to MG1655(pZE-Ctl, pZS-Ctl) (P < 0.001). (B) ClpB overexpressed on the low-copy-number pSC101 ori-containing vector and GrpE overexpressed on the high-copy-number ColE1 ori-containing vector with 0.1 mM IPTG. MG1655(pZE-Ctl, pZS-Ctl) (red), MG1655(pZE-Ctl, pZS-CL) (black dashed), MG1655(pZE-GL, pZS-Ctl) (yellow dashed), and MG1655(pZE-GL, pZS-CL) (purple dashed). “‡” indicates a statistically significant increase of MG1655(pZE-GL, pZS-CL) and MG1655(pZE-Ctl, pZS-CL) compared to MG1655(pZE-Ctl, pZS-Ctl) (P < 0.05).
In order to interrogate the cause for the various phenotypes observed with the induction levels and copy numbers of the expression vectors, using quantitative reverse transcription-PCR (Q-RT-PCR), we examined the mRNA expression levels of clpB and grpE in the ClpB and GrpE overexpression strains (see Text S1 in the supplemental material). These data indicate that higher levels of expression of both clpB and grpE are necessary to produce the best tolerance phenotypes observed.
Expression of other autologous HSPs failed to improve the tolerance phenotype.
Other HSP members were also examined, including overexpression of the E. coli autologous genes ibpA, ibpB, dnaK, and dnaJ. Overexpression of these genes alone and in combination with other HSP genes failed to produce significant improvements in tolerance for any of the strains examined and in several cases significantly reduced the tolerance of the strain (data not shown). A summary of the genes and solvent combinations tested is provided in Table 2. Previous attempts to overexpress the DnaKJ operon have been unsuccessful in both E. coli (29) and C. acetobutylicum (14). These HSPs, although routinely identified as being upregulated during stress (10, 13, 19, 30), fail to produce improvements to tolerance or growth when overexpressed. This important finding further reflects the need for careful regulation of stress response genes aiming to achieve a desirable outcome and highlights the possibility of negative effects on cell growth resulting from misregulated expression of HSP genes. In other words, the fact that several HSP genes are routinely identified as overexpressed upon exposure to toxic chemicals does not imply that overexpression of these genes will lead to a tolerant phenotype. Several HSPs, including GroESL and DnaK, have been identified as regulatory elements both in the regulation of the general stress response through RpoH and in regulation of the cell cycle (31–33). This is a complicating factor, and thus development of a tunable HSP system for developing solvent tolerance requires careful screening of HSP genes and control of their expression level.
TABLE 2 .
Effects of HSP overexpression on tolerance
| Alcohol tested | Tolerance with overexpression of HSPa |
|||||
|---|---|---|---|---|---|---|
| GroESLb | DnaK | DnaJ | GrpE | IbpABb | ClpB | |
| Ethanol | +c | − | − | +c | − | +c |
| n-Butanol | + | N | N | + | N | + |
| i-Butanol | +d | N | N | − | N | +d |
| 1,2,4-Butanetriol | + | N | N | + | N | + |
“+” indicates improved tolerance; “−” indicates that tolerance was not improved; N, not tested.
Tested only as operons (individual genes not tested).
Tested both individually and in combination for ethanol tolerance; both showed improvements.
Beneficial for i-butanol tolerance when expressed using three-plasmid system [MG1655(pZE-Ctl, pAC-ESN, pZS-CL)] but not when tested on a single plasmid [MG1655(pZS-CLGLESN)].
Coexisting plasmids enable rapid screening of combinations of genes but may impose additional stress on cells.
We next examined combinations of all four genes: grpE, groES, groEL, and clpB. As before, groESL was overexpressed on pAC-ESN (pA15 origin of replication; 15 copies/cell [27]) (Table 1) using its native promoter, grpE was overexpressed on pZE-GL (ColE1 origin of replication; 50 to 70 copies/cell [28]) (Table 1) under Plac, and clpB was overexpressed under Plac using pZS-CL (pSC101 origin of replication; 10 to 12 copies/cell [28]) (Table 1). The plasmids selected for these studies were chosen based upon the work examining each gene individually and previously examined combinations. Based on our work with GroESL (26), we chose to express the groESL genes from their native promoter using a plasmid with the pA15 origin of replication, while the expression of grpE and clpB on plasmids with the ColE1 and SC101 origins of replication was based on our work examining combinations of those genes alone. Induction with IPTG using the Plac promoter enables tunable expression of HSP genes, as shown in other applications (24). These strains were examined for both growth (Fig. 4A) and CFU-based viability (Fig. 4B) under 5% ethanol stress with a 3% ethanol pretreatment and 0.1 mM IPTG induction. The best performers using growth as a measure of tolerance were the combinations pZE-GL, pAC-ESN, pZS-Ctl and pZE-Ctl, pAC-ESN, pZS-CL, both of which produced statistically significant increases from results for the plasmid control (P < 0.001 and P < 0.001, respectively). It was also observed that MG1655(pZE-Ctl, pAC-Ctl, pZS-CL) and MG1655(pZE-Ctl, pAC-ESN, pZS-Ctl) performed better than the triple-plasmid control strain MG1655(pZE-Ctl, pAC-Ctl, pZS-Ctl) (P = 0.033 and P < 0.001, respectively), but their average cell density was less than those for the combinations listed above. The remaining combinations were also examined; however, the resulting growth was comparable to or lower than the control data (see Fig. S1 in the supplemental material). For comparison purposes, the four strains presented in Fig. 4 were also grown without a stressor in order to assess the effects of overexpression of these HSP genes on cell growth rather than tolerance (see Fig. S2). These data show that overexpression of HSPs produces growth comparable to or below those of the plasmid control strains, thus showing that the benefit is related to solvent tolerance rather than cell growth.
FIG 4 .
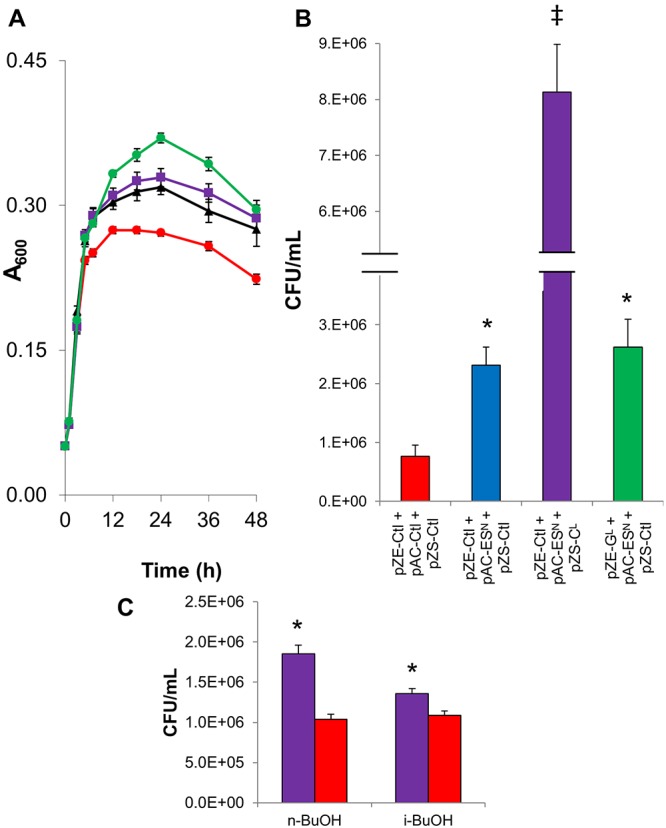
Ethanol tolerance assays for simultaneous overexpression of GrpE, GroESL, and ClpB using a three-plasmid system. GrpE was overexpressed on a ColE1 ori-containing vector, GroESL was expressed on a pA15 ori-containing vector, and ClpB was overexpressed on a pSC101 ori-containing vector. Samples were grown in 5% ethanol with a 3% ethanol pretreatment and induction with 0.1 mM IPTG. (A) Growth (A600) data. MG1655(pZE-Ctl, pAC-Ctl, pZS-Ctl) (red), MG1655(pZE-Ctl, pAC-Ctl, pZS-CL) (black), MG1655(pZE-GL, pAC-ESN, pZS-Ctl) (green), and MG1655(pZE-Ctl, pAC-ESN, pZS-CL) (purple). (B) Viable cell counts (CFU/ml). “*”indicates a statistically significant increase from results for the plasmid control, MG1655(pZE-Ctl, pAC-Ctl, pZS-Ctl) (P < 0.005). “‡” indicates a statistically significant increase from results for all other strains examined (P < 0.05). CFU were determined after 24 h of exposure to 5% ethanol. Remaining combinations of plasmids are presented in Fig. S1 in the supplemental material. (C) Viable cell counts (CFU/ml) in 1% n-butanol and 1% i-butanol for MG1655(pZE-Ctl, pAC-ESN, pZS-CL) (purple) and MG1655(pZE-Ctl, pAC-Ctl, pZS-Ctl) (red). “*” indicates a statistically significant increase from results for the plasmid control (P < 0.005). Data are from 3 biological replicates; error bars indicate standard errors.
Viability assays based on measurement of CFU after 24 and 48 h of growth under 5% ethanol resulted in statistically significant higher number of viable cells in MG1655(pZE-GL, pAC-ESN, pZS-Ctl), MG1655(pZE-Ctl, pAC-ESN, pZS-Ctl), and MG1655(pZE-Ctl, pAC-ESN, pZS-CL) than in the triple plasmid control (Fig. 4B) (P = 0.002, P < 0.001, and P < 0.001, respectively). MG1655(pZE-Ctl, pAC-ESN, pZS-CL) produced 10.1-fold more CFU than the control and 3.1-fold more CFU than MG1655(pZE-GL, pAC-ESN, pZS-Ctl), indicating significant increases (P < 0.001 for both). The remaining plasmid combinations performed comparably to or worse than the triple-plasmid control. It should be noted that the increases observed could be the result of mutations; however, due to the short time frame in which the cells were exposed to the stress (48 h), it is unlikely that any significant mutations could accumulate and do so consistently for all biological replicates. We additionally examined the effect of n-butanol and i-butanol stress on the best-performing strain, namely, MG1655(pZE-Ctl, pAC-ESN, pZS-CL). This strain produced a 78% increase (P < 0.001) in viable cells over results for MG1655(pZE-Ctl, pAC-Ctl, pZS-Ctl) in 1% n-butanol and a 25% increase in 1% i-butanol (Fig. 4C). Thus, the tolerant phenotype is not restricted to ethanol.
Although combinations of HSPs, notably GrpE and GroESL or GroESL and ClpB, were shown to provide additive effects when co-overexpressed, combinations of all four genes expressed from three plasmids decreased growth and survival compared to results with the triple-plasmid control strain. This effect indicates that although these genes can cooperate, as evidenced by the combinations demonstrated to improve tolerance of all three combinations of GroESL, ClpB, and GrpE overexpression, their expression on three coexisting plasmids produced too much stress for the cell to properly tolerate ethanol exposure. To investigate the origin of this stress, we examined the impact of antibiotics on cell growth (see Text S2 in the supplemental material) and integrated the genes into a single expression vector. Cultures without antibiotics improved cell densities achieved by all strains but resulted in a decrease in CFU when plated on antibiotic-containing plates. Also, the three-plasmid, 4-gene expression strain performed only comparably to the control in growth and significantly worse in numbers of CFU, indicating that the presence of three antibiotics was not limiting the strain’s performance.
Tandem groES, groEL, grpE, and clpB overexpression from a single plasmid improves ethanol, 1,2,4-butanetriol, and n-butanol tolerance.
To reduce the strain imposed on cells for maintaining three coexisting plasmids, we cloned the four genes expressing GrpE, GroESL, and ClpB into a single vector (pZS-CLGLESN) which was cloned into MG1655. The tolerance of this strain was then compared to those of a plasmid control (pZS-Ctl), strains containing overexpression plasmids for each gene (pZS-CL, pZS-GL, and pZS-ESN), and the previously successful (26) GroESL overexpression strain (carrying pAC-ESN) (Fig. 5A). Tolerance assays were performed in a higher concentration of ethanol (7%), which we hypothesized constitutes a more stringent performance test. MG1655(pZS-CLGLESN) improved the CFU counts by 2-fold over those of the control and 26% over those of MG1655(pZS-CL), both in a statistically significant way (Fig. 5A). The overexpression strains (based on the vector pZS) for each individual gene, encoding ClpB, GrpE, and GroESL, improved CFU-based tolerance versus that of the control by 59% (P < 0.001), 15% (P = 0.038), and 27% (P = 0.006). CFU counts from MG1655(pAC-ESN) demonstrated a 38% increase (P = 0.001) from those of the control strain.
FIG 5 .

(A) Viable cell counts (CFU/ml) performed after 24 h of culture in 7% ethanol for the 4-gene, single-plasmid overexpression system and 0.1 mM IPTG induction. (B) Numbers of CFU/ml, measured after 24 h of culture in 1% n-butanol, 1% i-butanol, and 25% 1,2,4-butanetriol (BT). MG1655(pZS-CLGL ESN) (green) and MG1655(pZS13Luc) (red) were used. Results are from 3 biological replicates; error bars indicate standard errors between replicates. “*” indicates a statistically significant improvement over the control strain, MG1655(pZS-Ctl) (P < 0.05). “**” indicates a statistically significant increase above results for the overexpression strain MG1655(pZS-CLGLESN). “‡” indicates a statistically significant increase over results for all other strains examined (P < 0.05).
Additionally, we examined the effect of overexpression of GrpE, GroESL, and ClpB on CFU-based tolerance to n-butanol, BT, and i-butanol (Fig. 5B). Previously, we have demonstrated that overexpression of GroESL using the plasmid pAC-ESN produced increased tolerance to a variety of alcohols, including ethanol, n-butanol, BT, and i-butanol (26). MG1655(pZS-CLGLESN) produced a 3.9-fold increase (P < 0.001) in numbers of CFU compared to results for the plasmid control when grown in 1% n-butanol and a 78% increase in 25% BT (P = 0.007). However, in 1% i-butanol the control strain proved to be much more tolerant. MG1655(pZS CLGLESN) maintained only 20% of the surviving viable cells compared to the control. When ClpB and GroESL were overexpressed using the three-plasmid system, a 25% increase in survival under i-butanol stress was observed, as already discussed (Fig. 4C). This was lower than the improvements observed for those strains under ethanol and n-butanol stress (Fig. 4). This consistently less effective response to i-butanol stress suggests that this combinations of genes under these expression conditions may be suboptimal for handling i-butanol stress.
DISCUSSION
The current model for the protein refolding cascade describes DnaKJ and GrpE, along with GroESL, acting to fold both nascent and misfolded proteins, while disaggregation is performed in a parallel pathway by ClpB, with the resulting proteins fed into the refolding cascade (6, 22, 34). These systems then operate either in series or in parallel, indicating that upregulation of each step of the system might allow for a more active and in turn more beneficial stress response system. Our method of including the most beneficial genes, shown by upregulation of those genes individually, in a semisynthetic response system allows for the use of HSPs simultaneously producing a more efficient protein refolding system. Considering the role of GroESL as a multipurpose chaperone shown to interact with up to half of the soluble protein in E. coli (35) and ClpB being responsible for the breakdown of damaged and misfolded proteins, this combination fits well with the expectation that a more robust protein refolding system is beneficial for cell survival under solvent stress.
Since the DnaKJE, GroESL, and ClpB systems are known to operate independently while part of the protein disaggregation and refolding system, these proteins must act in a coordinated manner, requiring particular ratios of each protein to the other to function properly (36). To that end, variation of expression levels of each of the genes in our semisynthetic stress response system allowed us to examine the impact of different expression levels of these genes on the strain’s effectiveness at tolerating solvent stress. This need for specific expression ratios dictates that an effective system be tuned to the appropriate level required for a particular solvent. The effects of tuning the expression levels and ratios of various HSP genes was also observed by de Marco (23) in the use of these proteins for improved heterologous, recombinant protein expression in E. coli, since each individual protein expressed required a different combination to generate improved protein expression.
Increases in tolerance to ethanol and n-butanol indicate that the co-overexpression of these four HSP genes examined here (Fig. 4 and 5) results in beneficial effects for surviving high levels of toxic solvent exposure. In view of the success of GroESL (26), lack of benefit for i-butanol tolerance with the four-HSP-gene overexpression is surprising. This further demonstrates the complexity of the tolerance phenotype and highlights the need for tailored resistance to each solvent. The additive effect resulting from HSP co-overexpression indicates that this system could be used in a practical setting for improving tolerance during production of ethanol, n-butanol, and potentially other useful but toxic solvents.
The use of a multiplasmid system allows us to regulate the expression level of each gene separately and to examine diverse expression levels; however, it also provides new difficulties in elucidating useful genes for increased alcohol tolerance. In particular, the presence of plasmids is known to cause an upregulation of the stress response system (37), which could potentially influence the expression levels of the genes that we have overexpressed, as well as other genes that may be responsible for regulation of the stress response cascade and other cellular responses to stress. However, maintaining the expression systems on a plasmid also provides some unique benefits, including the ability to test wide variation in expression levels, efficiently test the combinatorial effect of various genes, and investigate genetic libraries to screen for new functional partners. As indicated previously, the metabolic burden of three expression vectors likely plays a significant role in the effectiveness of our tolerance system. By reducing this burden, we were able to produce significant improvements in survival with high concentrations of ethanol (7%), BT (25%), and n-butanol exposure (1%). Although we could not identify improvements in tolerance in our three-plasmid-containing strain with overexpression of the four genes examined, we have consistently demonstrated that two-plasmid systems do not appear to significantly affect cell activities, and thus screening for combinations of genes using an established expression platform, such as the pZS-CLGLESN plasmid, still allows for examination of combinations of genes prior to their integration into any future tolerance system.
An important aspect of developing a tolerant organism is defining an appropriate assay for measuring tolerance. From an industrial perspective, solvent tolerance is an important aim because solvent titers for many production strains are limited by cell survival, let alone growth. Therefore, increasing cell productivity and viability in higher solvent concentrations is essential for making a successful industrial process. To that end, we have found that using cell growth as a sole measure is not sufficient for demonstrating solvent tolerance. Instead, we have chosen to examine both cell growth using a model assay and cell viability (by CFU), the latter likely being a more useful metric of potential industrial performance.
The improvement in both growth and survival generated by overexpressing combinations of HSPs represents significant improvements over other reported E. coli strains engineered for ethanol/alcohol tolerance. We have compared our GroESL overexpression strain 10-β(pAC-ESN) to previously reported engineered strains (26). Our comparisons indicated improvements from previous efforts to generate solvent tolerance (17, 38–40). Here, our four-gene overexpression strain MG1655(pZS-CLGLESN) has been found to show a significant improvement to overexpression of GroESL alone using MG1655(pAC-ESN) in both ethanol and n-butanol tolerance. Improvements over our previous strain represent steps forward from the other engineered strains we have compared it against. Also, if HSP overexpression not only can impart solvent tolerance but also can improve solvent production titers, as we have shown previously (14), MG1655(pZS-CLGLESN) may represent a strong platform strain for solvent production. These growth experiments, however, represent increased tolerance under laboratory conditions only, and further optimization of the system will be essential for the development of strains suitable for industrial applications.
For the development of practical industrial production strains, it will be necessary to further optimize and enhance the synthetic HSP systems we presented here. This will include optimization of the choice of HSP and partner genes that can be overexpressed, tuning of the expression levels for these genes, and integration of the system into the chromosome or the employment of a plasmid expression system that does not require complex maintenance under production conditions. To identify other partner genes that add to the effects of the currently developed system of four HSP genes, multiple coexisting genomic libraries can be employed in strain MG1655(pZS-CLGLESN) using the CoGeL technology we have recently developed (16). This technology will allow us to identify new cooperating or interacting partner genes. To optimize the expression levels, several powerful genomic tools have been described in the last few years. An important approach for tuning the expression of multiple genes is to employ combinatorial engineering based on libraries of tunable intergenic regions (41). Another approach is multiplex automated genome engineering (MAGE) technology (42), which enables the optimization of complex pathways or in our case an HSP-based synthetic program.
MATERIALS AND METHODS
Bacterial strain, plasmids, and primers.
The wild-type (WT) E. coli strain MG1655 was used in this study. Plasmids are listed in Table 1. Primers used are listed in Table S1 in the supplemental material.
Analytical methods.
Cell growth was determined by measuring the absorbance at 600 nm (A600) with a Beckman Coulter DU730 spectrophotometer. Samples were diluted in the appropriate medium to ensure an absorbance below 0.50.
Growth conditions.
E. coli strains were grown aerobically in liquid Luria-Bertani (LB) medium and on agar-solidified LB at 37°C. The medium was supplemented with the appropriate antibiotics unless otherwise indicated: ampicillin at 50 µg/ml, chloramphenicol at 35 µg/ml, and kanamycin at 25 µg/ml. All solvent concentrations in media are reported as percentages (vol/vol). Frozen stocks were prepared from overnight cultures and were stored in 15% glycerol at −85°C.
DNA isolation, manipulation, and cell transformations.
Isolation of plasmid DNA was performed using the Gerard Biotech (Oxford, OH) Hurricane miniprep kit (H240M). Transformations were carried out using electrocompetent E. coli MG1655 cells. All cloning enzymes were used according to the supplier’s protocols (NEB). PCR products and digests were purified using the Qiagen (Valencia, CA) PCR purification kit (2810).
Plasmid constructs.
The E. coli clpB gene was amplified from MG1655 genomic DNA via PCR in two separate reactions with the primers Eco-clpB KpnI F and Eco-clpB XmaI R and the primers Eco-clpB F KpnI and Eco-clpB SphI R. The PCR product flanked by the KpnI and XmaI sites was then cloned under Plac of the plasmid pZE-Ctl, producing pZE-CL. The nomenclature used here identifies the plasmid origin of replication by the first section (pZE, pZS, or pAC), the gene overexpressed by the letter in standard font (C [clpB], G [grpE], or ES [groESL]), and the regulatory elements as a superscript letter (superscript L [Plac] or superscript N [native promoter]). The clpB PCR product flanked by KpnI and SphI sites was cloned under Plac of pZS-Ctl, producing pZS-CL.
The E. coli grpE gene was amplified from MG1655 genomic DNA via PCR in two separate reactions using the primers Eco-grpE KpnI F and Eco-grpE XmaI R and the primers Eco-grpE F KpnI and Eco-grpE SphI R. The PCR product flanked by KpnI and XmaI sites was then cloned under Plac of the plasmid pZE-Ctl, producing pZE-GL. The grpE PCR product flanked by KpnI and SphI sites was cloned under Plac of pZS-Ctl, producing pZS-GL.
The E. coli genes groES and groEL, including their native regulatory elements, were PCR amplified from MG1655 DNA using the primers Eco-groESL SalI F and Eco-groESL SalI R. Additionally, the pZS-Ctl plasmid was PCR amplified using the primers pZS13-No pLac F and pZS13-No pLac R to exclude Plac and introduce desirable restriction sites. The resulting product was then self-ligated to produce pZS13-No pLac, to be used for construction of pZS-ESN. Finally, the groESL genes were cloned into the SalI sites of pZS13-No pLac to produce pZS-ESN.
To integrate multiple genes onto the single vector, plasmid pZS-CL was PCR amplified with the primers pZS-CL PstI F and pZS-CL SmaI F and self-ligated to integrate the new restriction digest sites. Additionally, the grpE gene, under control of Plac from pZE-GL, was amplified using the primers pLac-grpE PstI F and pLac-grpE PstI R. This product was then cloned into the PstI site engineered into the pZS-CL PCR product, producing pZS-CL grpE. Finally, a linear blunt-ended PCR product containing the groESL genes was amplified using Eco-groESL F and Eco-groESL R from E. coli MG1655 chromosomal DNA. This product was then blunt end cloned into a blunt-ended SacI digest of pZS-CLGL, producing pZS-CLGLESN.
Alcohol tolerance assays.
We employed 4 different alcohol tolerance assays as described previously (26). Two growth assays were used to measure growth under high ethanol stress starting from a low cell density (A600 = 0.05) with or without 3% ethanol pretreatment. The ethanol pretreatment was meant to simulate the continuous accumulation of toxic solvents in a fermentation broth and more pertinently the process of fed-batch operation, where the cells would be exposed to prior stress in later cycles. This would simulate the effects of increasing solvent stress experienced under solvent-producing conditions in extended batch or repeated fed-batch fermentations typically employed in the industrial setting. Although this assay may not directly represent a practical fermentation, it served as a measure of tolerance under high stress since the starting cell density is so low. Two viability assays were also used, with and without ethanol pretreatment as before, where CFU were measured after 24 and 48 h of solvent exposure to assess cellular production under stress. Cultures were serially diluted in 10-fold steps in LB medium containing no antibiotics. The dilution level was determined based on A600 measurements of the samples. Fifty microliters of the final dilution was then plated on an agar solidified LB plate containing appropriate antibiotics. CFU were measured after 18 to 24 h of growth at 37°C. This assay serves as a better measure of potential industrial use because it is a direct measure of cells that are still biologically active during solvent exposure.
Q-RT-PCR.
RNA was isolated from samples of cultures after 6 h of exposure to 5% ethanol and induced as described above. RNA isolation was performed using the Qiagen RNeasy minikit (74106; Qiagen) according to the manufacturer’s protocols, including the optional DNase digestion. Reverse transcription and Q-RT-PCR were then carried out as described previously (43). The housekeeping gene ihfB was chosen for calculation of differential expression (44). Data were collected from five biological replicates. Primers used are listed in Table S1 in the supplemental material.
Statistical analysis.
Data were statistically treated with an unpaired t test, and 95% confidence intervals for cell density, CFU, and mRNA fold differences were calculated to demonstrate a statistically significant difference in means of the samples.
SUPPLEMENTAL MATERIAL
Ethanol tolerance assays for simultaneous overexpression of GrpE, GroESL, and ClpB using a three-plasmid system. GrpE was overexpressed on a ColE1 ori-containing vector, GroESL was expressed on a pA15 ori-containing vector, and ClpB was overexpressed on a pSC101 ori-containing vector. Samples were grown in 5% ethanol with a 3% ethanol pretreatment and induction with 0.1 mM IPTG. (A) A600 measurements for remaining plasmid combinations over 48 h of exposure. MG1655(pZE-Ctl, pAC-Ctl, pZS-Ctl) (red; for comparison), MG1655(pZE-Ctl, pAC-ESN, pZS-Ctl) (blue), MG1655(pZE-GL, pAC-Ctl, pZS-CL) (purple dashed), MG1655(pZE-GL, pAC-Ctl, pZS-Ctl) (yellow), and MG1655(pZE-GL, pAC-ESN, pZS-CL) (green dashed) are shown. (B) Viable cell counts (CFU/ml) for additional plasmid combinations for simultaneous overexpression of GrpE, GroESL, and ClpB using a three-plasmid system. “*” indicates a statistically significant increase from results for all other strains examined (P < 0.05). Cells were plated on medium containing antibiotics, and counts were performed after 24 h of exposure to 5% ethanol. All data points represent 3 biological replicates; error bars indicate standard errors. Download Figure S1, DOCX file, 0.1 MB.
Unchallenged growth (A600) assay for three-plasmid overexpression strains. GrpE was overexpressed on a ColE1 ori-containing vector, GroESL was expressed on a pA15 ori-containing vector, and ClpB was overexpressed on a pSC101 ori-containing vector. Samples were grown in 0% ethanol and induced with 0.1 mM IPTG. MG1655(pZE-Ctl, pAC-Ctl, pZS-Ctl) (red), MG1655(pZE-Ctl, pAC-Ctl, pZS-CL) (black), MG1655(pZE-GL, pAC-ESN, pZS-Ctl) (green), and MG1655(pZE-Ctl, pAC-ESN, pZS-CL) (purple) are shown. All data points represent 3 biological replicates; error bars indicate standard errors. Download Figure S2, DOCX file, 0.1 MB.
Q-RT-PCR data for expression levels of ClpB (yellow) and GrpE (red) compared to those for the plasmid control strain in 5% ethanol, with induction (IPTG) levels listed after 6 h of exposure. All data are compared to those for the plasmid control strain, MG1655(pZE-Ctl, pZS-Ctl). (A) Expression levels of ClpB expression on a high-copy-number vector and GrpE expression on a low-copy-number vector, MG1655(pZE-CL, pZS-GL). “*” indicates a statistically significant increase in the fold difference of ClpB expression compared to results with 0.03 mM IPTG induction (P < 0.05). (B) Fold difference in expression levels of ClpB on a low-copy-number vector and GrpE on a high-copy-number vector, MG1655(pZE-GL, pZS-CL). (C) Expression levels of ClpB when overexpressed without GrpE. Blue, ClpB expressed on a low-copy-number vector, MG1655(pZE-Ctl, pZS-CL); green, ClpB expressed on a high-copy-number vector, MG1655(pZE-CL, pZS-Ctl). “**” indicates a statistically significant increase in the fold difference of ClpB expression when overexpressed on a high-copy-number vector compared to that with a low-copy-number vector (P < 0.05). Data are from 5 biological replicates; error bars indicate standard errors. Download Figure S3, DOCX file, 0.1 MB.
Ethanol tolerance assays for simultaneous overexpression of GrpE, GroESL, and ClpB using a three-plasmid system. GrpE was overexpressed on a ColE1 ori-containing vector, GroESL was expressed on a pA15 ori-containing vector, and ClpB was overexpressed on a pSC101 ori-containing vector. Samples were grown in 5% ethanol with a 3% ethanol pretreatment, induction with 0.1 mM IPTG, and without antibiotics in the test culture. (A) A600 measurements of samples over 48 h of exposure. MG1655(pZE-Ctl, pAC-Ctl, pZS-Ctl) (red), MG1655(pZE-Ctl, pAC-Ctl, pZS-CL) (black), MG1655(pZE-Ctl, pAC-ESN, pZS-Ctl) (blue), MG1655(pZE-Ctl, pAC-ESN, pZS-CL) (purple), MG1655(pZE-GL, pAC-Ctl, pZS-Ctl) (yellow), MG1655(pZE-GL, pAC-Ctl, pZS-CL) (purple dash), MG1655(pZE-GL, pAC-ESN, pZS-Ctl) (green), and MG1655(pZE-GL, pAC-ESN, pZS-CL) (green dash) are shown. (B) Viable cell counts (CFU/ml) for simultaneous overexpression of GrpE, GroESL, and ClpB using a three-plasmid system. “*” indicates a statistically significant increase from results for all other strains examined (P < 0.05). Cells were plated on medium containing antibiotics, and counts were performed after 24 h of exposure to 5% ethanol. All data points represent 3 biological replicates; error bars indicate standard errors. Download Figure S4, DOCX file, 0.1 MB.
PCR primers.
Q-RT-PCR data for ClpB and GrpE co-overexpression. Download Text S1, DOCX file, 0.1 MB.
Triple-plasmid tolerance studies without antibiotics. Download Text S2, DOCX file, 0.1 MB.
ACKNOWLEDGMENTS
This work was supported by the Office of Naval Research (ONR) (United States), grant N000141010161.
We thank Sergios Nicolaou and Stefan Gaida for laboratory assistance and discussions on data interpretation and Jason Coffman for his assistance with experiments.
Footnotes
Citation Zingaro KA, Papoutsakis ET. 2012. Toward a semisynthetic stress response system to engineer microbial solvent tolerance. mBio 3(5):e00308-12. doi:10.1128/mBio.00308-12.
REFERENCES
- 1. Dunlop MJ. 2011. Engineering microbes for tolerance to next-generation biofuels. Biotechnol. Biofuels 4:32 http://dx.doi.org/10.1186/1754-6834-4-32 [DOI] [PMC free article] [PubMed] [Google Scholar]
- 2. Nicolaou SA, Gaida SM, Papoutsakis ET. 2010. A comparative view of metabolite and substrate stress and tolerance in microbial bioprocessing: from biofuels and chemicals, to biocatalysis and bioremediation. Metab. Eng. 12:307–331 [DOI] [PubMed] [Google Scholar]
- 3. Papoutsakis ET. 2008. Engineering solventogenic clostridia. Curr. Opin. Biotechnol. 19:420–429 [DOI] [PubMed] [Google Scholar]
- 4. Jarboe LR, et al. 2010. Metabolic engineering for production of biorenewable fuels and chemicals: contributions of synthetic biology. J. Biomed. Biotechnol. 2010:761042. [DOI] [PMC free article] [PubMed] [Google Scholar]
- 5. Onofrei T, Hurduc N, Arsene C, Ionescu D. 2000. Sorption of Cu(II), Co(II) and Ni(II) on 1(4′-azobenzylcellulose)-2-naphthol. Thermogravimetric characterization. Cellulose Chem. Technol. 34:261–268 [Google Scholar]
- 6. Goloubinoff P, Mogk A, Ben Zvi AP, Tomoyasu T, Bukau B. 1999. Sequential mechanism of solubilization and refolding of stable protein aggregates by a bichaperone network. Proc. Natl. Acad. Sci. U. S. A. 96:13732–13737 [DOI] [PMC free article] [PubMed] [Google Scholar]
- 7. Schröder H, Langer T, Hartl FU, Bukau B. 1993. Dnak, Dnaj and Grpe form a cellular chaperone machinery capable of repairing heat-induced protein damage. EMBO J. 12:4137–4144 [DOI] [PMC free article] [PubMed] [Google Scholar]
- 8. Wu B, Wawrzynow A, Zylicz M, Georgopoulos C. 1996. Structure-function analysis of the Escherichia coli GrpE heat shock protein. EMBO J. 15:4806–4816 [PMC free article] [PubMed] [Google Scholar]
- 9. Haslberger T, Bukau B, Mogk A. 2010. Towards a unifying mechanism for ClpB/Hsp104-mediated protein disaggregation and prion propagation. Biochem. Cell Biol. 88:63–75 [DOI] [PubMed] [Google Scholar]
- 10. Alsaker KV, Paredes C, Papoutsakis ET. 2010. Metabolite stress and tolerance in the production of biofuels and chemicals: gene-expression-based systems analysis of butanol, butyrate, and acetate stresses in the anaerobe Clostridium acetobutylicum. Biotechnol. Bioeng. 105:1131–1147 [DOI] [PubMed] [Google Scholar]
- 11. Alsaker KV, Spitzer TR, Papoutsakis ET. 2004. Transcriptional analysis of spo0A overexpression in Clostridium acetobutylicum and its effect on the cell’s response to butanol stress. J. Bacteriol. 186:1959–1971 [DOI] [PMC free article] [PubMed] [Google Scholar]
- 12. Tomas CA, Beamish J, Papoutsakis ET. 2004. Transcriptional analysis of butanol stress and tolerance in Clostridium acetobutylicum. J. Bacteriol. 186:2006–2018 [DOI] [PMC free article] [PubMed] [Google Scholar]
- 13. Winkler J, Kao KC. 2011. Transcriptional analysis of Lactobacillus brevis to N-butanol and ferulic acid stress responses. PLoS One 6:e21438 http://dx.doi.org/10.1371/journal.pone.0021438 [DOI] [PMC free article] [PubMed] [Google Scholar]
- 14. Tomas CA, Welker NE, Papoutsakis ET. 2003. Overexpression of groESL in Clostridium acetobutylicum results in increased solvent production and tolerance, prolonged metabolism, and changes in the cell’s transcriptional program. Appl. Environ. Microbiol. 69:4951–4965 [DOI] [PMC free article] [PubMed] [Google Scholar]
- 15. Borden JR, Papoutsakis ET. 2007. Dynamics of genomic-library enrichment and identification of solvent tolerance genes for Clostridium acetobutylicum. Appl. Environ. Microbiol. 73:3061–3068 [DOI] [PMC free article] [PubMed] [Google Scholar]
- 16. Nicolaou SA, Gaida SM, Papoutsakis ET. 2011. Coexisting/Coexpressing Genomic Libraries (CoGeL) identify interactions among distantly located genetic loci for developing complex microbial phenotypes. Nucleic Acids Res. 39:e152 http://dx.doi.org/10.1093/nar/gkq1027 [DOI] [PMC free article] [PubMed] [Google Scholar]
- 17. Goodarzi H, et al. 2010. Regulatory and metabolic rewiring during laboratory evolution of ethanol tolerance in E. coli. Mol. Syst. Biol. 6:378 http://dx.doi.org/10.1038/msb.2010.33 [DOI] [PMC free article] [PubMed] [Google Scholar]
- 18. Reyes LH, Almario MP, Kao KC. 2011. Genomic library screens for genes involved in N-butanol tolerance in Escherichia coli. PLoS One 6:e17678 http://dx.doi.org/10.1371/journal.pone.0017678 [DOI] [PMC free article] [PubMed] [Google Scholar]
- 19. Brynildsen MP, Liao JC. 2009. An integrated network approach identifies the isobutanol response network of Escherichia coli. Mol. Syst. Biol. 5:277 http://dx.doi.org/10.1038/msb.2009.34 [DOI] [PMC free article] [PubMed] [Google Scholar]
- 20. Kang HJ, et al. 2007. Functional characterization of Hsp33 protein from Bacillus psychrosaccharolyticus; additional function of HSP33 on resistance to solvent stress. Biochem. Biophys. Res. Commun. 358:743–750 [DOI] [PubMed] [Google Scholar]
- 21. Okochi M, Kanie K, Kurimoto M, Yohda M, Honda H. 2008. Overexpression of prefoldin from the hyperthermophilic archaeum Pyrococcus horikoshii OT3 endowed Escherichia coli with organic solvent tolerance. Appl. Microbiol. Biotechnol. 79:443–449 [DOI] [PubMed] [Google Scholar]
- 22. de Marco A. 2007. Protocol for preparing proteins with improved solubility by co-expressing with molecular chaperones in Escherichia coli. Nat. Protoc. 2:2632–2639 [DOI] [PubMed] [Google Scholar]
- 23. De Marco D, Zona G. 2007. Complex formation equilibria between Ag(I) and thioureas in n-propanol. Thermochim. Acta 452:82–84 [Google Scholar]
- 24. de Marco A, Deuerling E, Mogk A, Tomoyasu T, Bukau B. 2007. Chaperone-based procedure to increase yields of soluble recombinant proteins produced in E. coli. BMC Biotechnol. 7:32 http://dx.doi.org/10.1186/1472-6750-7-32 [DOI] [PMC free article] [PubMed] [Google Scholar]
- 25. Wang JD, Herman C, Tipton KA, Gross CA, Weissman JS. 2002. Directed evolution of substrate-optimized GroEL/S chaperonins. Cell 111:1027–1039 [DOI] [PubMed] [Google Scholar]
- 26. Zingaro KA, Papoutsakis ET. GroESL overexpression imparts Escherichia coli tolerance to i-, n-, and 2-butanol, 1,2,4-butanetriol and ethanol with complex and unpredictable patterns. Metab. Eng., in press [DOI] [PubMed] [Google Scholar]
- 27. Sambrook JF, Fritsch EF, Maniatis T. 1989. Molecular cloning: a laboratory manual, 2nd ed. Cold Spring Harbor Laboratory Press, Cold Spring Harbor, New York [Google Scholar]
- 28. Lutz R, Bujard H. 1997. Independent and tight regulation of transcriptional units in Escherichia coli via the LacR/O, the TetR/O and AraC/I1-I2 regulatory elements. Nucleic Acids Res. 25:1203–1210 [DOI] [PMC free article] [PubMed] [Google Scholar]
- 29. Blum P, Ory J, Bauernfeind J, Krska J. 1992. Physiological consequences of Dnak and Dnaj overproduction in Escherichia coli. J. Bacteriol. 174:7436–7444 [DOI] [PMC free article] [PubMed] [Google Scholar]
- 30. Rutherford BJ, et al. 2010. Functional genomic study of exogenous n-butanol stress in Escherichia coli. Appl. Environ. Microbiol. 76:1935–1945 [DOI] [PMC free article] [PubMed] [Google Scholar]
- 31. Guisbert E, Herman C, Lu CZ, Gross CA. 2004. A chaperone network controls the heat shock response in E. coli. Genes Dev. 18:2812–2821 [DOI] [PMC free article] [PubMed] [Google Scholar]
- 32. Muffler A, Barth M, Marschall C, HenggeAronis R. 1997. Heat shock regulation of sigma(S) turnover: a role for DnaK and relationship between stress responses mediated by sigma(S) and sigma(32) in Escherichia coli. J. Bacteriol. 179:445–452 [DOI] [PMC free article] [PubMed] [Google Scholar]
- 33. Yura T, et al. 2007. Analysis of sigma(32) mutants defective in chaperone-mediated feedback control reveals unexpected complexity of the heat shock response. Proc. Natl. Acad. Sci. U. S. A. 104:17638–17643 [DOI] [PMC free article] [PubMed] [Google Scholar]
- 34. Mogk A, Deuerling E, Vorderwülbecke S, Vierling E, Bukau B. 2003. Small heat shock proteins, ClpB and the DnaK system form a functional triade in reversing protein aggregation. Mol. Microbiol. 50:585–595 [DOI] [PubMed] [Google Scholar]
- 35. Viitanen PV, Gatenby AA, Lorimer GH. 1992. Purified chaperonin 60 (Groel) interacts with the nonnative states of a multitude of Escherichia coli proteins. Protein Sci. 1:363–369 [DOI] [PMC free article] [PubMed] [Google Scholar]
- 36. Tomoyasu T, Mogk A, Langen H, Goloubinoff P, Bukau B. 2001. Genetic dissection of the roles of chaperones and proteases in protein folding and degradation in the Escherichia coli cytosol. Mol. Microbiol. 40:397–413 [DOI] [PubMed] [Google Scholar]
- 37. Silva F, Queiroz JA, Domingues FC. 2012. Evaluating metabolic stress and plasmid stability in plasmid DNA production by Escherichia coli. Biotechnol. Adv. 30:691–708 [DOI] [PubMed] [Google Scholar]
- 38. Alper H, Stephanopoulos G. 2007. Global transcription machinery engineering: a new approach for improving cellular phenotype. Metab. Eng. 9:258–267 [DOI] [PubMed] [Google Scholar]
- 39. Atsumi S, et al. 2010. Evolution, genomic analysis, and reconstruction of isobutanol tolerance in Escherichia coli. Mol. Syst. Biol. 6:449 http://dx.doi.org/10.1038/msb.2010.98 [DOI] [PMC free article] [PubMed] [Google Scholar]
- 40. Dunlop MJ, et al. 2011. Engineering microbial biofuel tolerance and export using efflux pumps. Mol. Syst. Biol. 7:487 http://dx.doi.org/10.1038/msb.2011.21 [DOI] [PMC free article] [PubMed] [Google Scholar]
- 41. Pfleger BF, Pitera DJ, Smolke CD, Keasling JD. 2006. Combinatorial engineering of intergenic regions in operons tunes expression of multiple genes. Nat. Biotechnol. 24:1027–1032 [DOI] [PubMed] [Google Scholar]
- 42. Wang HH, et al. 2009. Programming cells by multiplex genome engineering and accelerated evolution. Nature 460:894–898 [DOI] [PMC free article] [PubMed] [Google Scholar]
- 43. Borden JR, Jones SW, Indurthi D, Chen Y, Papoutsakis ET. 2010. A genomic-library based discovery of a novel, possibly synthetic, acid-tolerance mechanism in Clostridium acetobutylicum involving non-coding RNAs and ribosomal RNA processing. Metab. Eng. 12:268–281 [DOI] [PMC free article] [PubMed] [Google Scholar]
- 44. Zhou K, et al. 2011. Novel reference genes for quantifying transcriptional responses of Escherichia coli to protein overexpression by quantitative PCR. BMC Mol. Biol. 12:18 http://dx.doi.org/10.1186/1471-2199-12-18 [DOI] [PMC free article] [PubMed] [Google Scholar]
- 45. Barnett ME, Zolkiewska A, Zolkiewski M. 2000. Structure and activity of ClpB from Escherichia coli - Role of the amino- and carboxyl-terminal domains. J. of Biol. Chem. 275:37565–37571 [DOI] [PMC free article] [PubMed] [Google Scholar]
Associated Data
This section collects any data citations, data availability statements, or supplementary materials included in this article.
Supplementary Materials
Ethanol tolerance assays for simultaneous overexpression of GrpE, GroESL, and ClpB using a three-plasmid system. GrpE was overexpressed on a ColE1 ori-containing vector, GroESL was expressed on a pA15 ori-containing vector, and ClpB was overexpressed on a pSC101 ori-containing vector. Samples were grown in 5% ethanol with a 3% ethanol pretreatment and induction with 0.1 mM IPTG. (A) A600 measurements for remaining plasmid combinations over 48 h of exposure. MG1655(pZE-Ctl, pAC-Ctl, pZS-Ctl) (red; for comparison), MG1655(pZE-Ctl, pAC-ESN, pZS-Ctl) (blue), MG1655(pZE-GL, pAC-Ctl, pZS-CL) (purple dashed), MG1655(pZE-GL, pAC-Ctl, pZS-Ctl) (yellow), and MG1655(pZE-GL, pAC-ESN, pZS-CL) (green dashed) are shown. (B) Viable cell counts (CFU/ml) for additional plasmid combinations for simultaneous overexpression of GrpE, GroESL, and ClpB using a three-plasmid system. “*” indicates a statistically significant increase from results for all other strains examined (P < 0.05). Cells were plated on medium containing antibiotics, and counts were performed after 24 h of exposure to 5% ethanol. All data points represent 3 biological replicates; error bars indicate standard errors. Download Figure S1, DOCX file, 0.1 MB.
Unchallenged growth (A600) assay for three-plasmid overexpression strains. GrpE was overexpressed on a ColE1 ori-containing vector, GroESL was expressed on a pA15 ori-containing vector, and ClpB was overexpressed on a pSC101 ori-containing vector. Samples were grown in 0% ethanol and induced with 0.1 mM IPTG. MG1655(pZE-Ctl, pAC-Ctl, pZS-Ctl) (red), MG1655(pZE-Ctl, pAC-Ctl, pZS-CL) (black), MG1655(pZE-GL, pAC-ESN, pZS-Ctl) (green), and MG1655(pZE-Ctl, pAC-ESN, pZS-CL) (purple) are shown. All data points represent 3 biological replicates; error bars indicate standard errors. Download Figure S2, DOCX file, 0.1 MB.
Q-RT-PCR data for expression levels of ClpB (yellow) and GrpE (red) compared to those for the plasmid control strain in 5% ethanol, with induction (IPTG) levels listed after 6 h of exposure. All data are compared to those for the plasmid control strain, MG1655(pZE-Ctl, pZS-Ctl). (A) Expression levels of ClpB expression on a high-copy-number vector and GrpE expression on a low-copy-number vector, MG1655(pZE-CL, pZS-GL). “*” indicates a statistically significant increase in the fold difference of ClpB expression compared to results with 0.03 mM IPTG induction (P < 0.05). (B) Fold difference in expression levels of ClpB on a low-copy-number vector and GrpE on a high-copy-number vector, MG1655(pZE-GL, pZS-CL). (C) Expression levels of ClpB when overexpressed without GrpE. Blue, ClpB expressed on a low-copy-number vector, MG1655(pZE-Ctl, pZS-CL); green, ClpB expressed on a high-copy-number vector, MG1655(pZE-CL, pZS-Ctl). “**” indicates a statistically significant increase in the fold difference of ClpB expression when overexpressed on a high-copy-number vector compared to that with a low-copy-number vector (P < 0.05). Data are from 5 biological replicates; error bars indicate standard errors. Download Figure S3, DOCX file, 0.1 MB.
Ethanol tolerance assays for simultaneous overexpression of GrpE, GroESL, and ClpB using a three-plasmid system. GrpE was overexpressed on a ColE1 ori-containing vector, GroESL was expressed on a pA15 ori-containing vector, and ClpB was overexpressed on a pSC101 ori-containing vector. Samples were grown in 5% ethanol with a 3% ethanol pretreatment, induction with 0.1 mM IPTG, and without antibiotics in the test culture. (A) A600 measurements of samples over 48 h of exposure. MG1655(pZE-Ctl, pAC-Ctl, pZS-Ctl) (red), MG1655(pZE-Ctl, pAC-Ctl, pZS-CL) (black), MG1655(pZE-Ctl, pAC-ESN, pZS-Ctl) (blue), MG1655(pZE-Ctl, pAC-ESN, pZS-CL) (purple), MG1655(pZE-GL, pAC-Ctl, pZS-Ctl) (yellow), MG1655(pZE-GL, pAC-Ctl, pZS-CL) (purple dash), MG1655(pZE-GL, pAC-ESN, pZS-Ctl) (green), and MG1655(pZE-GL, pAC-ESN, pZS-CL) (green dash) are shown. (B) Viable cell counts (CFU/ml) for simultaneous overexpression of GrpE, GroESL, and ClpB using a three-plasmid system. “*” indicates a statistically significant increase from results for all other strains examined (P < 0.05). Cells were plated on medium containing antibiotics, and counts were performed after 24 h of exposure to 5% ethanol. All data points represent 3 biological replicates; error bars indicate standard errors. Download Figure S4, DOCX file, 0.1 MB.
PCR primers.
Q-RT-PCR data for ClpB and GrpE co-overexpression. Download Text S1, DOCX file, 0.1 MB.
Triple-plasmid tolerance studies without antibiotics. Download Text S2, DOCX file, 0.1 MB.