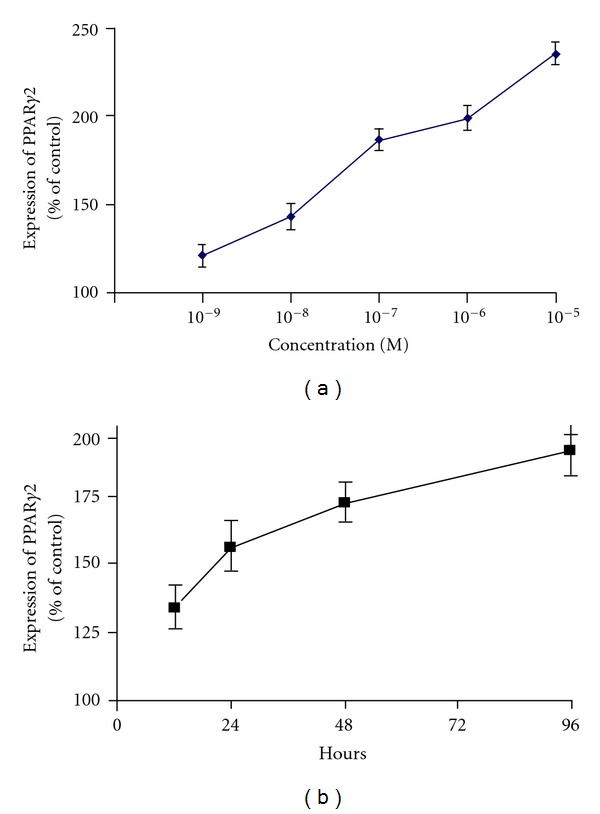
Figure 2.

PPARγ2 upregulation by dexamethasone is concentration and time dependent. Quantitation of the relative PPARγ2 gene expression of the D1 cells treated with (a) different concentrations of dexamethasone for 48 h and (b) 10−7 mol/L dexamethasone for different time points. Error bars represent the standard deviation of triplicate experiments (*P < 0.05). (Reprinted, with permission, from: [56].)
