

Abstract
Objectives. We explored the notion that social disadvantage increases vulnerability to the health effects of environmental hazards. Specifically, we examined (1) whether race modifies the association between blood lead and blood pressure and (2) whether socioeconomic status (SES) plays a role in this modifying effect.
Methods. Using the National Health and Nutrition Examination Survey (2001–2008) and linear regression, we estimated the association between blood lead and blood pressure. Using interactions among race, SES, and lead, we estimated this association by levels of social disadvantage.
Results. Black men and women showed a 2.8 (P < .001) and 4.0 (P < .001) millimeters mercury increase in SBP, respectively, for each doubling of blood lead. White adults showed no association. This lead–SBP association exhibited by Blacks was primarily isolated to Blacks of low SES. For example, poor but not nonpoor Black men showed a 4.8 millimeters mercury (P < .001) increase in SBP for each doubling of blood lead.
Conclusions. Our results suggest that social disadvantage exacerbates the deleterious health effects of lead. Our work provides evidence that social and environmental factors must be addressed together to eliminate health disparities.
Black–White disparities in hypertension have been well-documented for decades.1–3 A 2010 American Heart Association report put nationwide prevalence estimates at roughly 33% for White adults but 43% for Black adults.4 Economically, if Black Americans had the hypertension rates of White Americans, about $400 million would have been saved in out-of-pocket health care expenses, about $2 billion would have been saved in private insurance costs, and $375 million would have been saved from Medicare and Medicaid—per year.5 More seriously, disparities are also seen in outcomes related to hypertension. For example, mortality rates because of hypertension are roughly 15 deaths per 100 000 people for White men and women; but 40 and more than 50 per 100 000 for Black men and women, respectively.4 Disparities in hypertension account for the greatest disparities in years of lost life compared with any other health condition.6
A growing body of literature in different disciplines indicates that both social and environmental factors are important in the production and maintenance of hypertension disparities.7–10 There are racial disparities in numerous social factors, such as socioeconomic status (SES), that have a robust association with hypertension.2 For example, 2009 estimates put 26% of Blacks living in poverty compared with only 12% of Whites.11 Importantly, however, controlling for poverty does not attenuate the racial disparities in hypertension, indicating that there are complex mechanisms at work.12 There are also racial disparities in numerous environmental hazards, some of which are associated with hypertension. For example, lead is causally associated with a modest increase in blood pressure and risk of hypertension in a dose-dependent manner13–16 through several biological mechanisms, including increases in oxidative stress and alterations in control of the cardiovascular system.17 Furthermore, racial disparities in lead have been reported for decades.18,19
In the environmental health literature, researchers have described the notion of differential vulnerability to the deleterious health effects of environmental hazards.20,21 Some have shown that psychosocial stress and social stressors potentiate the association between lead and blood pressure. For example, in 1 study, men who report high levels of perceived stress show an association between bone lead and blood pressure, whereas men who do not report high levels of stress do not reveal this association.22 Similarly, those adults who have higher allostatic load scores, a measure of stress-related wear and tear on the body, show a stronger association between blood lead and the odds of hypertension compared with adults with lower allostatic load scores.23,24
It may be that this differential vulnerability, resulting from differential exposure to social factors, contributes to racial disparities in hypertension.25 In other words, it may be that the greater social stressors and psychosocial stress experienced by Black compared with White Americans may exacerbate the health effects of environmental hazards, including lead. In fact, researchers have reported that there is a modifying effect of race on the association between blood lead and blood pressure. Specifically, Black adults exhibit a roughly 1 millimeter mercury increase in systolic blood pressure for every 3 micrograms increase in blood lead.26 Yet, no such association is seen for Whites.19,26,27 It may be that, compared with White adults, Black adults show a stronger association between lead and blood pressure because they experience greater social stressors, such as higher levels of poverty.
In the present study, we have updated and expanded on previous work by examining the notion that social disadvantage, as marked by race and SES, modifies the association between blood lead and blood pressure. Specifically, we first updated the literature on the modifying effect of race on the association between blood lead and blood pressure. The most recent work in this area is based on data from 1988 to 1991. Blood lead levels have continued to decline for both Blacks and Whites.19 Because there is a dose-dependent association between lead and blood pressure, it is not known whether blood lead and blood pressure are associated for Black adults using current data (2001 to 2008). Second, we examined the role of SES, specifically education and poverty, in the stronger association between blood lead and blood pressure seen in Black compared with White adults.
METHODS
We used data from the 4 most recent 2-year waves of the National Health and Nutrition Examination Survey (NHANES 2001–2008). The details of this survey are provided elsewhere.28 Briefly, NHANES is currently an annual survey and clinical examination of a population-representative sample of roughly 5000 noninstitutionalized US residents aged 1 year and older administered by the Centers for Disease Control and Prevention. Our analyses included all adults aged 20 years and older who identified as either non-Hispanic Black or non-Hispanic White (n = 15 159). We excluded women who were pregnant because this may affect blood pressure during this period (n = 571). We also excluded those with missing information on any key variables (blood pressure [n = 1517], blood lead [n = 610], or SES [n = 784]) or any other variables included in our models (n = 756), yielding a final sample size of 10 971. We examined differences in the samples that included and excluded these 756 observations in blood pressure, blood lead, SES, and race and found that the 2 samples were similar.
We examined 3 measures of blood pressure: systolic (SBP), diastolic (DBP) and pulse pressure (PP). We used the average of up to 3 seated blood pressure readings. We calculated pulse pressure as the difference between SBP and DBP.
Whole blood lead was measured using inductively coupled plasma mass spectrometry. The mass spectrometer instrument has lower-bound detection limits. If blood lead levels are below this limit, the reading is not reliable. To distinguish nondetectable laboratory test results from a very low measured lead test result, a special value was imputed by NHANES staff.29 This value is equal to the lower-bound detection limit for that wave divided by the square root of 2. The lower-bound detection limits and corresponding imputed values for each wave were as follows: 0.28 and 0.20 micrograms per deciliter (2001–2002), 0.28 and 0.20 micrograms per deciliter (2003–2004), and 0.25 and 0.18 micrograms per deciliter (2005–2006, 2007–2008). In 2005 to 2006, there were 2 lower-bound detection limits, 0.25 and 0.30 micrograms per deciliter, with no guidance in the NHANES documentation as to which limit is to be used; therefore, the former value was selected, as had been done in the literature.30 Finally, blood lead was log-transformed on account of its skewed distribution, nonlinear association with blood pressure, and heteroskedasticity. The transformation addressed these issues.
We used 2 dichotomous measures of SES in our interactions: educational attainment (< high school [HS] or ≥ HS) and family poverty income ratio (PIR). The PIR is the ratio of the family’s gross income to the family’s poverty threshold as determined annually by the US Census Bureau. PIR was calculated by the NHANES staff and was top-coded at 5.0. A PIR below 1.85 was defined as poor because this is the poverty guideline used by certain means-tested social programs.31
We calculated descriptive statistics, including means with standard errors for all continuous variables and percentages for categorical variables. Because the blood lead distribution was skewed, we have reported both the median with the interquartile range and the back-transformed mean and standard deviation. We estimated margins, or covariate-adjusted means (geometric mean for blood lead), for the focal variables blood lead, SBP, DBP, and PP. We used the Wald test to test for Black–White differences.
We estimated the modifying effect of race on the association between blood lead and blood pressure in regression models that included an interaction between a dummy race variable (1 = Black) and continuous log-transformed blood lead. Models were controlled for age, age2, education, PIR, hematocrit, body mass index (defined as weight in kilograms divided by the square of height in meters), heavy alcohol use,32 smoking status (never, former, current), diagnosis of diabetes, antihypertensive medication use, and dietary sodium, calcium, and potassium intake because these factors have been shown to either confound or modify the association between blood lead and blood pressure. When used as a control variable, PIR was kept in its continuous form and educational attainment was categorized as 3 distinct components (< HS, HS, > HS).
Research has shown that there are social and economic disparities within levels of SES. In other words, researchers have shown that SES levels hold different meanings for Black and White Americans that cannot be captured by adding a main effect of SES to statistical models.33–35 For example, Black adults have lower occupational status and lower wages for the same educational attainment.36–38 Therefore, we interacted race and SES measures to examine race-specific measures of SES.
We estimated the race–SES group modifying effects on the association between blood lead and blood pressure by using linear regression models with interactions among the dummy race, dummy SES (< HS = 1; PIR < 1.85 = 1), and continuous blood lead variables. Equation 1 outlines our models. We ran separate models for the interaction with poverty and the interaction with education.
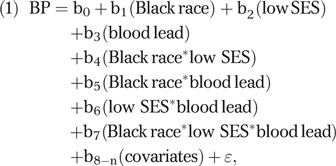 |
where BP = blood pressure (SBP, DBP, or PP); low SES = education < HS or PIR < 1.85. We used postestimation calculations to derive the parameter estimates as follows: White, high SES = b3; White, low SES = b3 + b6; Black, high SES = b3 + b5; Black, low SES = b3 + b5 + b6 + b7. Models were adjusted for the covariates listed for previous regression models (with the exception of education and PIR).
We ran numerous sensitivity analyses. We ran additional separate models using different educational attainment variables (< HS, HS, > HS; < HS, ≥ HS, college; < HS, HS, > HS, college). Our results showed that there were no differences in the association between blood lead and blood pressure when comparing categories beyond high school. In other words, the only differences we found were comparing those with less than a high school education to those with at least a high school education. Therefore, we have only reported the results of the models with this dichotomous variable. We also ran models without antihypertensive medication use. The inclusion of this variable when blood pressure is the outcome is controversial because it is a collider in directed acyclic graphs. In other words, because antihypertensive medication use is the result of both blood pressure and other variables (e.g., education, race) that precede blood pressure, its inclusion may actually introduce rather than reduce confounding. However, we noted the results were similar, so we kept this variable in our models for consistency with the literature. We also ran models that adjusted for whether respondent’s housing stock was built before or after 1978, the year when lead in paint was banned. These results were similar to our original models, so we did not report these results. Finally, we ran models in women that adjusted for the number of pregnancies and the number of live births because these factors may confound the associations among race, blood lead, and blood pressure. These results were similar to our original models, so we did not report these results.
Because race intersected with gender with regard to hypertension and many of the covariates, all analyses were stratified by gender to focus on race and SES differences. All analyses were conducted in STATA version 11.0 (StataCorp, College Station, TX). We employed the weights to account for the inclusion of dietary measures, complex survey design, and the aggregation of data over years as outlined in the NHANES documentation.39
RESULTS
The sociodemographic and health characteristics of the NHANES 2001–2008 sample are shown in Table 1, with age-adjusted estimates of focal characteristics shown in Tables A and B (available as a supplement to the online version of this article at http://www.ajph.org). In general, Blacks had higher blood pressure compared with Whites; the disparities were particularly large for women. Blacks also were more likely to be without a high school education or to live in poverty compared with Whites. Racial disparities also existed in blood lead level. After adjusting for age, both men and women showed a small Black–White disparity that was present even within SES subgroups (Tables A and B).
TABLE 1—
Sociodemographic and Health Characteristics by Race and Gender: National Health and Nutrition Examination Survey, United States, 2001-2008
| Men |
Women |
|||||
| Characteristic | White (n = 4138), Mean ±SD, Median (IQR), or % | Black (n = 1489), Mean ±SD, Median (IQR), or % | P | White (n = 3876), Mean ±SD, Median (IQR), or % | Black (n = 1468), Mean ±SD, Median (IQR), or % | P |
| Systolic blood pressure, mm Hg | 123.1 ±14.8 | 126.3 ±16.6 | < .001 | 120.7 ±19.2 | 123.8 ±20.7 | < .001 |
| Diastolic blood pressure, mm Hg | 72.9 ±11.4 | 74.0 ±13.0 | < .001 | 70.4 ±7.2 | 71.9 ±12.8 | < .001 |
| Pulse pressure, mm Hg | 50.1 ±14.7 | 52.2 ±15.4 | < .01 | 50.3 ±18.5 | 51.9 ±18.1 | < .05 |
| Blood lead, μg/dL | ||||||
| Median | 1.7 (1.2–2.5) | 1.8 (1.2–2.8) | 1.2 (0.8–1.8) | 1.3 (0.8–2.0) | ||
| Mean | 1.7 ±1.8 | 1.9 ±1.9 | < .01 | 1.2 ±1.8 | 1.4 ±1.9 | < .001 |
| Age, y | 45.6 ±15.8 | 40.6 ±14.4 | < .001 | 47.3 ±16.7 | 42.4 ±15.1 | < .001 |
| Education < high school | 10 | 27 | < .001 | 11 | 24 | < .001 |
| Poverty income ratio < 1.85 | 18 | 42 | < .001 | 23 | 47 | < .001 |
| Antihypertensive medication use | 18 | 18 | 20 | 27 | < .001 | |
| Diabetes | 8 | 11 | 8 | 12 | < .01 | |
| Smoking status | ||||||
| Never | 44 | 48 | 55 | 67 | < .001 | |
| Former | 29 | 15 | < .001 | 22 | 11 | < .001 |
| Current | 27 | 36 | < .001 | 22 | 22 | |
| Heavy alcohol use | 20 | 23 | 11 | 9 | ||
| Body mass index, kg/m2 | 28.2 ±5.6 | 28.2 ±6.1 | 27.5 ±6.6 | 30.8 ±7.7 | < .001 | |
| Hematocrit, % | 45.3 ±3.3 | 44.1 ±3.5 | < .001 | 40.7 ±2.0 | 38.5 ±3.7 | < .001 |
| Dietary calcium, mg/d | 1103 ±718 | 866 ±626 | < .001 | 838 ±496 | 633 ±467 | < .001 |
| Dietary potassium, mg/d | 3305 ±1456 | 2744 ±1421 | < .001 | 2415 ±1046 | 2021 ±1113 | < .001 |
| Dietary sodium, mg/d | 4281 ±2076 | 4044 ±2223 | < .05 | 2966 ±1416 | 2828 ±1641 | < .05 |
Note. IQR = interquartile range. All results were weighted to account for complex survey design. Tests for significance not performed on medians.
Although the racial disparity in blood lead levels was small, race modified the association between blood lead and SBP even after controlling for numerous potential confounders, including education and PIR, as shown in Table 2. Black men showed a 2.8 millimeters mercury increase in SBP for each doubling of blood lead (SE = 0.7; P < .001) although White men showed no association (P < .01 for Black–White comparison). Similarly, Black women showed a 4.0 millimeters mercury increase in SBP for each doubling of blood lead (SE = 1.1, P < .001) even though White women showed no association (P < .01 for Black–White comparison).
TABLE 2—
Parameter Estimates for Change in Blood Pressure for Each Doubling of Blood Lead, Stratified by Gender: National Health and Nutrition Examination Survey, United States, 2001–2008
| Men (n = 5631) |
Women (n = 5362) |
|||||
| Pressure Type | White, b (SE) | Black,a b (SE) | Black-White Difference, P | White, b (SE) | Black,a b (SE) | Black-White Difference, P |
| SBP | 0.3 (0.6) | 2.8*** (0.7) | < .01 | 0.8 (0.9) | 4.0*** (1.1) | < .01 |
| DBP | 0.6 (0.4) | 1.5 (0.8) | 1.3** (0.5) | 1.9** (0.7) | ||
| PP | −0.3 (0.5) | 1.3 (0.8) | −0.5 (0.7) | 2.1* (0.9) | < .01 | |
Note. DBP = diastolic blood pressure; PP = pulse pressure; SBP = systolic blood pressure. All results were weighted to account for complex survey design. Models were adjusted for age, age2, education (< high school, ≥ high school), family poverty income ratio, hematocrit, body mass index, heavy alcohol use, smoking status (never, former, current), diabetes diagnosis, antihypertensive medication use, and dietary intake of sodium, calcium, and potassium.
Parameter estimates for Blacks were calculated postestimation as the linear combination of the parameter estimate for Whites and the parameter estimate for the interaction between race and blood lead, as follows:
Blood pressure = b0 + b1(Black race) + b2(blood lead) + b3(Black race*blood lead) + b4-n(covariates).
White = b2.
Black = b2 + b3.
*P < .05, **P < .01, ***P < .001. Statistical test for difference of parameter estimate from zero.
Race also modified the association between blood lead and PP in women, with Black women showing a 2.1 millimeters mercury increase in PP for each doubling of blood lead (SE = 0.9, P < .5) and White women showing no association (P < .01 for Black–White disparity). Race did not modify the association between blood lead and DBP. However, both Black and White women showed an association between blood lead and DBP, with a 1.9 and 1.3 millimeters mercury increase in DBP for each doubling of blood lead, respectively (SE = 0.7; P < .01 and SE = 0.5; P < .01 for Black and White women, respectively).
Because SES categories are incommensurate across race, we examined the association between blood lead and blood pressure within race-SES groups, shown in Table 3, with these models graphically depicted in Figures 1 and 2. In general, the stronger association between blood lead and SBP experienced by Blacks was confined to those Blacks with low SES. For example, Black men without a high school education (low SES) showed a 4.1 millimeters mercury increase in SBP for each doubling of blood lead (P < .01), and Black men with at least a high school education (not low SES) showed a 2.2 millimeters mercury increase (P < .05). The modifying effect of race on the association between blood lead and SBP remained for those with less than a high school education (bBlack, < high school—bWhite, < high school = 3.8; P < .05), but was attenuated for those with at least a high school education (bBlack, ≥ high school—bWhite, ≥ high school = 1.9; P = ns). Similarly, poor Black men showed a 4.8 millimeters mercury increase in SBP for each doubling of blood lead (P < .001) even though nonpoor Black men showed no association. The modifying effect of race remained for poor men (bBlack, poor—bWhite, poor = 4.2; P < .01) but was attenuated for nonpoor men (bBlack, nonpoor—bWhite, nonpoor = 0.1; P = ns). Notably, the inclusion of either education or poverty for White men did not change the association between blood lead and SBP; there was no association for any SES group.
TABLE 3—
Parameter Estimates for Change in Systolic Blood Pressure for Each Doubling of Blood Lead by Race and Educational Attainment, Stratified by Gender: National Health and Nutrition Examination Survey, United States, 2001–2008
| Men (n = 5631) |
Women (n = 5362) |
|||||
| Characteristic | White, b (SE) | Black, b (SE) | Black-White Difference, P | White, b (SE) | Black, b (SE) | Black-White Difference, P |
| Education | ||||||
| < high school | 0.3 (1.3) | 4.1** (1.3) | < .05 | 1.0 (1.6) | 6.7** ±2.1 | < .01 |
| ≥ high school | 0.3 (1.3) | 2.2* (1.0) | 0.3 (1.1) | 2.9 ±1.6 | ||
| Family poverty | ||||||
| Poor | 0.6 (0.9) | 4.8*** (0.3) | <.01 | 0.7 (0.9) | 4.3** ±1.5 | < .05 |
| Nonpoor | 0.3 (0.7) | 0.4 (0.9) | 1.1 (0.8) | 3.7* ±1.9 | ||
Note: All results were weighted to account for complex survey design. Models were adjusted for age, age2, hematocrit, body mass index, heavy alcohol use, smoking status (never, former, current), and diabetes diagnosis, antihypertensive medication use, and dietary intake of sodium, calcium, and potassium. Models that included education in the interaction were also controlled for poverty income ratio according to US Census Bureau; models that included poverty income ratio in the interaction were also controlled for education. Cell sample sizes are as follows: Black men, < high school, 481; Black men, ≥ high school, 1008; White men, < high school, 740; White men, ≥ high school, 3402; Black women, < high school, 432; Black women, ≥ high school, 1039; White women, < high school, 616; White women, ≥ high school, 3275. Parameter estimates reported are from the following equation (See text for details):
Blood pressure = b0 + b1(Black race) + b2(low SES) + b3(blood lead) + b4(Black race*blood lead) + b5(low SES*blood lead) + b6(Black race* < high school) + b7(Black race*low SES*blood lead) + b8-n(covariates).
White, low SES = b3 + b5.
White, high SES = b3.
Black, low SES = b3 + b4 + b5 + b7.
Black, high SES = b3 + b4.
*P < .05, **P < .01, ***P < .001. Statistical test for difference of parameter estimate from zero.
FIGURE 1—

Association between blood lead and systolic blood pressure by race–education group, for (a) men and (b) women: National Health and Nutrition Examination Survey, United States, 2001–2008.
Note. SBP = systolic blood pressure. All results were weighted to account for complex survey design. Regression models controlled for age, age2, hematocrit, body mass index, heavy alcohol use, smoking status (never, former, current),diabetes diagnosis, family poverty income ratio, antihypertensive medication use, and dietary intake of sodium, calcium, and potassium. Log-transformed blood lead level, on the x-axis, is that for each decile of the gender-specific distribution.
FIGURE 2—

Association between blood lead and systolic blood pressure by race-poverty group, stratified by gender: National Health and Nutrition Examination Survey, United States, 2001–2008.
Note. PIR = poverty income ratio; SBP = systolic blood pressure. All results were weighted to account for complex survey design. Regression models controlled for age, age2, hematocrit, body mass index, heavy alcohol use, smoking status (never, former, current), diabetes diagnosis, education (< high school, high school, > high school), and antihypertensive medication use, and dietary intake of sodium, calcium, and potassium. Log-transformed blood lead level, on the x-axis, is that for each decile of the gender-specific distribution. The PIR is the ratio of the family’s gross income to the family’s poverty threshold as determined annually by the US Census Bureau.
Women showed an association similar to that seen with men when comparing education level. However, there was no difference between poor and non-poor Black women. Specifically, both poor and nonpoor Black women showed a roughly 4 millimeters mercury increase in SBP for each doubling of blood lead (bpoor = 4.2; P < .01; bnonpoor = 3.7; P < .05).
DISCUSSION
In this study, we investigated the association between blood lead and increased blood pressure. Our data show that this association was present for Black but not White adults, even though blood lead levels have continued to decline for both Black and White adults. Moreover, we found that this association was even more complex than previously shown using older data. Specifically, blood lead and blood pressure were most consistently associated only for Blacks of low SES, yet not for Whites of low SES. In sum, our data suggest that blood lead increases blood pressure mainly among the most disadvantaged populations. These findings held even after accounting for several behavioral (e.g., smoking status), demographic (e.g., age), and medical risk factors (e.g., hematocrit levels, diabetes).
A possible explanation for this finding is seen in emerging research on differential vulnerability.25 A growing literature in environmental health shows that social stressors and psychosocial stress increases the deleterious health effects of environmental hazards. For example, researchers have shown that psychosocial stress amplifies the association between traffic-related pollution and asthma in children.40 Social sources of stress, such as exposure to violence and high neighborhood unemployment, have also been shown to amplify the association between traffic-related pollution and health.41,42
Examining lead specifically, researchers have shown that living in neighborhoods with high levels of psychosocial hazards increases the association between lead and poor cognitive outcomes.43 Similarly, those who report high levels of perceived stress show a stronger association between lead and both poor cognitive outcomes44 and blood pressure.45 Researchers have also reported that high levels of allostatic load, a marker of physiological wear and tear because of chronic stress,46 increases the association between lead and hypertension.24
Large literatures in numerous disciplines have documented the Black-White disparities in social stressors such as poverty, neighborhoods of poor quality, and racial discrimination.33,47 Researchers have also reported that Black adults have higher allostatic load compared with White adults.48 It may be that the greater exposure to stressors and greater levels of psychosocial stress experienced by Black compared with White Americans results in a greater effect of lead (and other environmental hazards) and thus, disparities in health.25
Although we could not test biological mechanisms directly, the notion that social stressors enhance vulnerability to the hypertensive effects of lead is supported by the biological literature. Lead and psychosocial stress share several biological mechanisms important for blood pressure changes, including actions on the biological stress response and cardiovascular systems.15,49–51 These shared pathways are thought to result in synergistic effects.17,21,52,53 Although the exact mechanisms of this synergy are not known, some evidence suggests that lead and stress both activate the biological stress response system—the hypothalamic-pituitary-adrenal axis—to result in a physiological allostatic load (wear and tear on the stress and cardiovascular systems).46,50,54,55
Limitations
There are several limitations to this study. First, we used blood lead, which is a marker of recent lead exposure. Researchers have shown that bone lead, a marker of cumulative lead dose over decades, provides a better indication of lead exposure.56 It may be that despite the slimness of racial disparities in blood lead, the disparities in bone lead are large and that bone lead really drives the association between blood lead and blood pressure. There are historical disparities in lead exposure through disparities in housing stock, hazardous occupations, and proximity to major roadways (when lead was in gasoline).57 In fact, Black adults have higher levels of bone lead than adults from White or other race/ethnic groups.58,59 However, there are currently no data sets that include bone lead in a nationally representative sample of Black men and women over the life span. In the absence of bone lead, we used blood lead and limited this study to health outcomes that are amenable to short-term changes, such as blood pressure.20
We are also limited in our measures of social factors. However, we used these markers (educational attainment and poverty status) informed by the social science literature, which is novel in the environmental health literature. Researchers have shown that SES is related to exposure to other social stressors and psychosocial stress.60 However, researchers have also shown that SES is inversely associated with exposure to environmental hazards,61,62 which suggests there is a need to examine the interaction and spatial correlation between social and environmental factors experienced by socially disadvantaged populations.63
Despite these limitations, our research makes important contributions to the literature on environmental health and health disparities. Our research is one of only a handful of studies that examine the notion that social factors enhance vulnerability to the health effects of environmental hazards. To date, most of the research in the small but growing literature focuses on either stress, air pollution, and respiratory outcomes in children41,64,65 or stress, lead, and lead-related health outcomes (i.e., blood pressure, cognition) in older adults.22,43,45 Ours is the first study to apply this notion of the interaction between social and environmental factors to racial disparities in blood pressure in a nationally representative data set. Although earlier reports have shown that Black but not White adults exhibit the association between blood lead and blood pressure, researchers have not examined the reason for the modifying effect of race.26,27
Conclusions
In 2004, the National Environmental Justice Advisory Council of the Environmental Protection Agency (EPA) introduced the notion that social factors enhance the health effects of environmental hazards to the EPA.66 At the same time, researchers outlined a model of the interaction of social and environmental factors as an underlying cause of the poor health of Black Americans.25 Our research contributes to this line of research with important implications for intervention and policy. The notion that social factors increase vulnerability to the health effects of environmental hazards challenges decision-makers to view environmental health and environmental justice in a new way.67 Our results support a call for intervention and policy approaches to address both exposure and vulnerability to environmental hazards.
Acknowledgments
This study was supported by the Robert Wood Johnson Foundation Health and Society Scholars program, and the National Institutes of Health (grant T32 AG000221 to the Population Studies Center and grant P30 ES017885 to the Department of Environmental Health Sciences, University of Michigan).
The authors thank Sung Kyun Park for guidance in data analysis and 2 anonymous reviewers for their helpful comments on an earlier draft of the article.
Human Participant Protection
No protocol approval was needed for this study because we used only de-identified data.
References
- 1.Lennard HL, Glock CY. Studies in hypertension. VI. Differences in the distribution of hypertension in Negroes and whites; an appraisal. J Chronic Dis. 1957;5(2):186–196 [DOI] [PubMed] [Google Scholar]
- 2.Mensah GA, Mokdad AH, Ford ES, Greenlund KJ, Croft JB. State of disparities in cardiovascular health in the United States. Circulation. 2005;111(10):1233–1241 [DOI] [PubMed] [Google Scholar]
- 3.Heymsfield S, Kraus J, Lee ES, McDill M, Stamler R, Watson R. Race, education and prevalence of hypertension. Am J Epidemiol. 1977;106(5):351–361 [PubMed] [Google Scholar]
- 4.Lloyd-Jones D, Adams RJ, Brown TMet al. Heart disease and stroke statistics–2010 update. Circulation. 2010;121:e46–e215 [DOI] [PubMed] [Google Scholar]
- 5.Waidmann T. Estimating the Cost of Racial and Ethnic Health Disparities. Washington, D.C.: The Urban Institute; 2009 [Google Scholar]
- 6.Wong MD, Shapiro MF, Boscardin WJ, Ettner SL. Contribution of major diseases to disparities in mortality. N Engl J Med. 2002;347(20):1585–1592 [DOI] [PubMed] [Google Scholar]
- 7.Morenoff JD, House JS, Hansen BB, Williams DR, Kaplan GA, Hunte HE. Understanding social disparities in hypertension prevalence, awareness, treatment, and control: the role of neighborhood context. Soc Sci Med. 2007;65(9):1853–1866 [DOI] [PMC free article] [PubMed] [Google Scholar]
- 8.Wyatt SB, Williams DR, Calvin R, Henderson FC, Walker ER, Winters K. Racism and cardiovascular disease in African Americans. Am J Med Sci. 2003;325(6):315–331 [DOI] [PubMed] [Google Scholar]
- 9.Sorel JE, Heiss G, Tyroler HA, Davis WB, Wing SB, Ragland DR. Black-white differences in blood pressure among participants in NHANES II: the contribution of blood lead. Epidemiology. 1991;2(5):348–352 [DOI] [PubMed] [Google Scholar]
- 10.Schulz AJ, Kannan S, Dvonch JTet al. Social and physical environments and disparities in risk for cardiovascular disease: the Healthy Environments Partnership conceptual model. Environ Health Perspect. 2005;113(12):1817–1825 [DOI] [PMC free article] [PubMed] [Google Scholar]
- 11.DeNavas-Walt C, Proctor DB, Smith JC. Income, Poverty, and Health Insurance Coverage in the United States, 2009. Washington, DC: US Census Bureau; 2010 [Google Scholar]
- 12.Geronimus AT, Bound J, Keene D, Hicken M. Black-white differences in age trajectories of hypertension prevalence among adult women and men, 1999–2002. Ethn Dis. 2007;17(1):40–48 [PubMed] [Google Scholar]
- 13.Navas-Acien A, Guallar E, Silbergeld EK, Rothenberg SJ. Lead exposure and cardiovascular disease: a systematic review. Environ Health Perspect. 2007;115(3):472–482 [DOI] [PMC free article] [PubMed] [Google Scholar]
- 14.Cheng Y, Schwartz J, Sparrow D, Aro A, Weiss ST, Hu H. Bone lead and blood lead levels in relation to baseline blood pressure and the prospective development of hypertension: the Normative Aging Study. Am J Epidemiol. 2001;153(2):164–171 [DOI] [PubMed] [Google Scholar]
- 15.Ahamed M, Siddiqui MK. Low level lead exposure and oxidative stress: current opinions. Clin Chim Acta. 2007;383(1-2):57–64 [DOI] [PubMed] [Google Scholar]
- 16.Hu H, Aro A, Payton Met al. The relationship of bone and blood lead to hypertension. The Normative Aging Study. JAMA. 1996;275(15):1171–1176 [PubMed] [Google Scholar]
- 17.Vaziri ND. Mechanisms of lead-induced hypertension and cardiovascular disease. Am J Physiol Heart Circ Physiol. 2008;295(2):H454–H465 [DOI] [PMC free article] [PubMed] [Google Scholar]
- 18.Geronimus AT, Hillemeier MM. Patterns of blood lead levels in US black and white women of childbearing age. Ethn Dis. 1992;2(3):222–231 [PubMed] [Google Scholar]
- 19.Muntner P, Menke A, DeSalvo KB, Rabito FA, Batuman V. Continued decline in blood lead levels among adults in the United States. Arch Intern Med. 2005;165(18):2155–2161 [DOI] [PubMed] [Google Scholar]
- 20.Clougherty JE, Kubzansky LD. A framework for examining social stress and susceptibility to air pollution in respiratory health. Environ Health Perspect. 2009;117(9):1351–1358 [DOI] [PMC free article] [PubMed] [Google Scholar]
- 21.Cory-Slechta DA, Virgolini MB, Rossi-George A, Thiruchelvam M, Lisek R, Weston D. Lifetime consequences of combined maternal lead and stress. Basic Clin Pharmacol Toxicol. 2008;102(2):218–227 [DOI] [PubMed] [Google Scholar]
- 22.Peters JL, Weisskopf MG, Spiro Aet al. Interaction of stress, lead burden, and age on cognition in older men: the VA Normative Aging Study. Environ Health Perspect. 2010;118(4):505–510 [DOI] [PMC free article] [PubMed] [Google Scholar]
- 23.McEwen BS. Stress, adaptation, and disease. Allostasis and allostatic load. Ann N Y Acad Sci. 1998;840:33–44 [DOI] [PubMed] [Google Scholar]
- 24.Zota AR, Shenassa E, Morello-Frosch RA. Allostatic load, an indicator of chronic stress, modifies the impact of blood lead levels on hypertension. : Strengthening Environmental Justice and Research Decision Making: A Symposium on the Science of Disproportionate Environmental Health Impacts. Washinton, DC: US Environmental Protection Agency; 2010 [Google Scholar]
- 25.Gee GC, Payne-Sturges DC. Environmental health disparities: a framework integrating psychosocial and environmental concepts. Environ Health Perspect. 2004;112(17):1645–1653 [DOI] [PMC free article] [PubMed] [Google Scholar]
- 26.Vupputuri S, He J, Muntner P, Bazzano LA, Whelton PK, Batuman V. Blood lead level is associated with elevated blood pressure in blacks. Hypertension. 2003;41(3):463–468 [DOI] [PubMed] [Google Scholar]
- 27.Den Hond E, Nawrot T, Staessen JA. The relationship between blood pressure and blood lead in NHANES III. J Hum Hypertens. 2002;16(8):563–568 [DOI] [PubMed] [Google Scholar]
- 28.National Center for Health Statistics National Health and Nutrition Examination Survey. Atlanta: Centers for Disease Control and Prevention; 2011 [Google Scholar]
- 29.NHANES 2005-2006 Data Documentation, Codebook, and Frequencies: Blood Lead and Blood Cadmium. Bethesda, MD: National Center for Health Statistics; 2008 [Google Scholar]
- 30.Navas-Acien A, Tellez-Plaza M, Guallar Eet al. Blood cadmium and lead and chronic kidney disease in US adults: a joint analysis. Am J Epidemiol. 2009;170(9):1156–1164 [DOI] [PMC free article] [PubMed] [Google Scholar]
- 31.US Department of Agriculture Food and Nutrition Service. WIC Income Eligibility Guidelines 2012–2013. Available at: http://www.fns.usda.gov/wic/howtoapply/incomeguidelines.htm. Accessed September 10, 2012.
- 32.National Institute on Alcohol Abuse and Alcoholism Screening for Alchol Use and Alcohol-Related Problems. Bethesda, MD: National Institute on Alcohol Abuse and Alcoholism; 2005 [Google Scholar]
- 33.Williams DR, Mohammed S, Leavell J, Collins C. Race, socioeconomic status, and health: complexities, ongoing challenges, and research opportunities. Ann N Y Acad Sci. 2010;1186:69–101 [DOI] [PMC free article] [PubMed] [Google Scholar]
- 34.Kaufman JS, Cooper RS, McGee DL. Socioeconomic status and health in blacks and whites: the problem of residual confounding and the resiliency of race. Epidemiology. 1997;8(6):621–628 [PubMed] [Google Scholar]
- 35.Kessler RC, Neighbors HW. A new perspective on the relationships among race, social-class, and psychological distress. J Health Soc Behav. 1986;27(2):107–115 [PubMed] [Google Scholar]
- 36.Anderson D, Shapiro D. Racial differences in access to high-paying jobs and the wage gap between Black and White women. Ind Labor Relat Rev. 1996;49(2):273–286 [Google Scholar]
- 37.Williams DR. Race, socioeconomic status, and health. The added effects of racism and discrimination. Ann N Y Acad Sci. 1999;896:173–188 [DOI] [PubMed] [Google Scholar]
- 38.Wilson FD, Tienda M, Wu L. Race and unemployment—labor-market experiences of Black and White men, 1968-1988. Work Occup. 1995;22(3):245–270 [Google Scholar]
- 39.National Center for Health Statistics Analytic and Reporting Guidelines for the National Health and Nutrition Examination Surveys. Hyattsville, MD: Centers for Disease Control and Preventiona; 2006 [Google Scholar]
- 40.Shankardass K, McConnell R, Jerrett M, Milam J, Richardson J, Berhane K. Parental stress increases the effect of traffic-related air pollution on childhood asthma incidence. Proc Natl Acad Sci U S A. 2009;106(30):12406–12411 [DOI] [PMC free article] [PubMed] [Google Scholar]
- 41.Clougherty JE, Levy JI, Kubzansky LDet al. Synergistic effects of traffic-related air pollution and exposure to violence on urban asthma etiology. Environ Health Perspect. 2007;115(8):1140–1146 [DOI] [PMC free article] [PubMed] [Google Scholar]
- 42.Dragano N, Hoffmann B, Moebus Set al. Traffic exposure and subclinical cardiovascular disease: is the association modified by socioeconomic characteristics of individuals and neighbourhoods? Results from a multilevel study in an urban region. Occup Environ Med. 2009;66(9):628–635 [DOI] [PubMed] [Google Scholar]
- 43.Glass TA, Bandeen-Roche K, McAtee M, Bolla K, Todd AC, Schwartz BS. Neighborhood psychosocial hazards and the association of cumulative lead dose with cognitive function in older adults. Am J Epidemiol. 2009;169(6):683–692 [DOI] [PMC free article] [PubMed] [Google Scholar]
- 44.Peters JL, Wright RJ, Weisskopf MGet al. Interaction of stress and lead burden on cognition in older men: the VA Normative Aging Study. Epidemiology. 2010;19(6):S134–S134 [DOI] [PMC free article] [PubMed] [Google Scholar]
- 45.Peters JL, Kubzansky L, McNeely Eet al. Stress as a potential modifier of the impact of lead levels on blood pressure. Environ Health Perspect. 2007;115(8):1154–1159 [DOI] [PMC free article] [PubMed] [Google Scholar]
- 46.McEwen BS, Seeman TE. Protective and damaging effects of mediators of stress. Elaborating and testing the concepts of allostasis and allostatic load. Ann N Y Acad Sci. 1999;896:30–47 [DOI] [PubMed] [Google Scholar]
- 47.Boardman JD. Stress and physical health: the role of neighborhoods as mediating and moderating mechanisms. Soc Sci Med. 2004;58(12):2473–2483 [DOI] [PubMed] [Google Scholar]
- 48.Geronimus AT, Hicken M, Keene D, Bound J. “Weathering” and age patterns of allostatic load scores among blacks and whites in the United States. Am J Public Health. 2006;96(5):826–833 [DOI] [PMC free article] [PubMed] [Google Scholar]
- 49.Harrison DG, Gongora MC. Oxidative stress and hypertension. Med Clin North Am. 2009;93(3):621–635 [DOI] [PubMed] [Google Scholar]
- 50.Virgolini MB, Bauter MR, Weston DD, Cory-Slechta DA. Permanent alterations in stress responsivity in female offspring subjected to combined maternal lead exposure and/or stress. Neurotoxicology. 2006;27(1):11–21 [DOI] [PubMed] [Google Scholar]
- 51.Payton M, Hu H, Sparrow D, Young JB, Landsberg L, Weiss ST. Relation between blood lead and urinary biogenic-amines in community-exposed men. Am J Epidemiol. 1993;138(10):815–825 [DOI] [PubMed] [Google Scholar]
- 52.Vyskocil A, Fiala Z, Tejnorova I, Tusl M. Stress reaction in developing rats exposed to 1% lead acetate. Sb Ved Pr Lek Fak Karlovy Univerzity Hradci Kralove. 1991;34(3):287–295 [PubMed] [Google Scholar]
- 53.Virgolini MB, Chen K, Weston DD, Bauter MR, Cory-Slechta DA. Interactions of chronic lead exposure and intermittent stress: consequences for brain catecholamine systems and associated behaviors and HPA axis function. Toxicol Sci. 2005;87(2):469–482 [DOI] [PubMed] [Google Scholar]
- 54.Seeman TE, Singer BH, Rowe JW, Horwitz RI, McEwen BS. Price of adaptation–allostatic load and its health consequences. MacArthur studies of successful aging. Arch Intern Med. 1997;157(19):2259–2268 [PubMed] [Google Scholar]
- 55.Gump BB, Stewart P, Reihman Jet al. Low-level prenatal and postnatal blood lead exposure and adrenocortical responses to acute stress in children. Environ Health Perspect. 2008;116(2):249–255 [DOI] [PMC free article] [PubMed] [Google Scholar]
- 56.Hu H. Bone lead as a new biologic marker of lead dose: recent findings and implications for public health. Environ Health Perspect. 1998;106(suppl 4):961–967 [DOI] [PMC free article] [PubMed] [Google Scholar]
- 57.US Agency for Toxic Substances and Disease Registry Toxicology Profile for Lead. Atlanta, GA: US Department of Health and Human Services, Public Health Service; 2007 [Google Scholar]
- 58.Lin C, Kim R, Tsaih SW, Sparrow D, Hu H. Determinants of bone and blood lead levels among minorities living in the Boston area. Environ Health Perspect. 2004;112(11):1147–1151 [DOI] [PMC free article] [PubMed] [Google Scholar]
- 59.Martin D, Glass TA, Bandeen-Roche K, Todd AC, Shi WP, Schwartz BS. Association of blood lead and tibia lead with blood pressure and hypertension in a community sample of older adults. Am J Epidemiol. 2006;163(5):467–478 [DOI] [PubMed] [Google Scholar]
- 60.Adler NE, Snibbe AC. The role of psychosocial processes in explaining the gradient between socioeconomic status and health. Curr Dir Psychol Sci. 2003;12(4):119–123 [Google Scholar]
- 61.Brown P. Race, class, and environmental health: a review and systematization of the literature. Environ Res. 1995;69(1):15–30 [DOI] [PubMed] [Google Scholar]
- 62.O’Neill MS, Jerrett M, Kawachi Let al. Health, wealth, and air pollution: advancing theory and methods. Environ Health Perspect. 2003;111(16):1861–1870 [DOI] [PMC free article] [PubMed] [Google Scholar]
- 63.Morello-Frosch R, Zuk M, Jerrett M, Shamasunder B, Kyle AD. Understanding the cumulative impacts of inequalities in environmental health: implications for policy. Health Aff (Millwood). 2011;30(5):879–887 [DOI] [PubMed] [Google Scholar]
- 64.Clougherty JE, Kubzansky LD. Traffic-related air pollution and stress: effects on asthma. Environ Health Perspect. 2008;116(9):A376–7; author reply A377 [DOI] [PMC free article] [PubMed] [Google Scholar]
- 65.Chen E, Schreier HM, Strunk RC, Brauer M. Chronic traffic-related air pollution and stress interact to predict biologic and clinical outcomes in asthma. Environ Health Perspect. 2008;116(7):970–975 [DOI] [PMC free article] [PubMed] [Google Scholar]
- 66.Espinosa J, Briggum S, Carman Net al. Ensuring Risk Reduction in Communities With Multiple Stressors. Washington, DC: US Environmental Protection Agency; 2004 [Google Scholar]
- 67.Hicken M, Gragg R, Hu H. How cumulative risks warrant a shift in our approach to racial health disparities: the case of lead, stress, and hypertension. Health Aff (Millwood). 2011;30(10):1895–1901 [DOI] [PMC free article] [PubMed] [Google Scholar]