

Abstract
Objective
To fine map previously identified quantitative trait loci (QTL) affecting atherosclerosis in mice using association analysis.
Methods and Results
We recently showed that high-resolution association analysis using common inbred strains of mice is feasible if corrected for population structure. To utilize this approach for atherosclerosis, which requires a sensitizing mutation, we bred human apoB100 transgenic mice with 22 different inbred strains to produce F1 heterozygotes. Mice carrying the dominant transgene were tested for association with high-density SNP maps. Here we focus on high-resolution mapping of the previously described Ath30 locus on Chr 1. As compared to the previous linkage analysis, association improved the resolution of the Ath30 locus by more than an order of magnitude. Using expression quantitative trait locus analysis, we identified one of the genes in the region, Des, as a strong candidate.
Conclusions
Our high-resolution mapping approach accurately identifies and fine maps known atherosclerosis QTL. These results suggest that high-resolution genome-wide association analysis for atherosclerosis is feasible in mice.
INTRODUCTION
Genome-wide association (GWA) studies of large numbers of patients and controls have identified over 30 loci involved in atherosclerosis1. Many of those loci appear to involve genes not previously associated with atherosclerosis, providing an opportunity for the discovery of new pathways involved in the disease. While clearly exciting, such human studies have some significant limitations. Notably, the loci explain a small fraction of the heritability of the disease, and the causal genes/mutations at most of the loci are unknown2. Also, examination of epistatic effects and gene-by-environment interactions in human populations is complicated by low power and the inability to accurately quantify environmental exposures3. Finally, intermediate phenotypes such as transcript levels are difficult to obtain.
Over 30 atherosclerotic quantitative trait loci (QTL) in mice have been mapped by linkage in crosses between various inbred strains indicating that there exists a wealth of relevant genetic variation in laboratory mice4. However, the poor resolution of these QTLs, generally encompassing hundreds of genes, has made it difficult to identify the underlying causal gene(s). Our group, along with others, has been developing association-based approaches to specifically address the poor resolution of linkage studies5, 6. We have shown that association mapping in classic inbred strains of mice is feasible and has good power provided that the data are corrected for population structure5, 7, 8.
One difficulty in applying an association strategy to atherosclerosis in mice is that a sensitizing mutation resulting in hyperlipidemia is required to allow rapid development of substantial lesions. The most widely used models are Apoe−/− 9, 10 and Ldlr−/− mice11. Both of these act in a recessive manner with respect to lesion development, and breeding either of these mutations to a homozygous state in numerous strains for an association study is not practical. To circumvent this problem, we employed a dominant hyperlipidemia-inducing mutation, the human apolipoprotein B-100 transgenic , C57BL/6-tg(APOB)12. Our approach uses F1 mice generated by breeding C57BL/6-tg(APOB) mice with permanent inbred strains followed by association mapping.
Using this strategy, we have now analyzed a limited number of inbred strains for association using an efficient mixed model algorithm (EMMA) that corrects for population structure. Although the data are not yet sufficiently powered for genome-wide association analysis, we have used them to demonstrate both the concordance with loci identified in previous linkage studies and the improved mapping resolution at one previously mapped locus, Ath30. Examination of mRNA levels in the aorta narrowed our list of candidate genes. We show that one of these candidates, Des, is differentially regulated during atherogenesis.
RESULTS
A strategy for performing association mapping on a sensitizing genetic background
Several groups have identified QTL for atherosclerosis using crosses between inbred mice8, 13–17. Identifying candidate genes for further testing using traditional congenic approaches is time consuming, and sometimes the loci are complex, containing several genes affecting the phenotype 18. One approach to fine mapping QTL is to use association analysis with different inbred and recombinant inbred strains. We bred hemizygous C57BL/6-tg(APOB) mice to 22 different inbred strains to generate F1 heterozygous mice carrying the transgene. Beginning at 9 weeks of age, these mice were fed an atherogenic diet with cholic acid. Following 16 weeks of the diet, we quantitated plasma lipoproteins and atherosclerosis. Mean atherosclerotic lesion sizes in females ranged between 0 um2 for NZW/LacJ and 73,291 um2 in BXH20/KccJ mice (Fig. 1A). The extent of lesion development was markedly lower in males, ranging from 148 um2 for CBA/J to 19,831 um2 in C57BL/6J mice (Fig. 1B). Representative lesions are shown in Suppl. Fig. I and the numbers of mice per strain are summarized in Suppl. Table I. There was strong concordance of atherosclerosis susceptibility among the strains by gender (r=0.87, p=1.8×10⁻⁷). The use of the tg(APOB) as a sensitizing mutation to atherosclerosis provided a substantial increase in the robust nature of lesion formation as compared to dietary manipulation alone. For example, compared to publically available data at the mouse phenome database (http://phenome.jax.org/), we observed over a 10-fold increase in lesion size as compared to mice on diet alone. Lesion size in the current study correlated well with previous studies including Paigen 1 (r=0.80, p<0.003) and our survey of BXH RI mice8 (r=0.86, p=0.009) (Suppl. Fig. II). These correlations demonstrate that the F1 approach effectively recapitulates strain effects found in previous studies.
Figure 1. Atherosclerosis and lipoprotein levels vary among inbred strains with hApoB100 Tg.

Three to ten mice of each strain per sex were examined for the given phenotypes as described in the Methods. Panels (A) and (B) show female and male aortic sinus atherosclerosis lesion sizes, respectively. Strains are listed on the X-axis and average lesion sizes in um2 are shown on the Y-axis. Panels (C) and (D) show high-density lipoprotein (HDL) levels, in males and females, respectively. Strains are listed on the X-axis and average HDL (mg/dl) on the Y-axis. Panels (E) and (F) show correlations of plasma HDL levels and atherosclerosis in female and male mice, respectively. Pearson r2- values and corresponding p-values are shown in upper right of graph. Values are mean ± SEM.
Circulating high-density lipoprotein levels (HDL) varied between strains (Fig. 1C and 1D) and were negatively correlated with atherosclerotic burden in both males (r=−0.40, p<0.001) and females (r=−0.48, p<0.001) (Fig. 1E and 1F). There was also a significant positive correlation between circulating total cholesterol levels and atherosclerosis in males (r=0.23, p=0.005) and females (r=0.35, p<2×10⁻⁵) (data not shown).
Association analysis of atherosclerosis and atherosclerosis risk factors
We next performed association analysis for atherosclerosis using the efficient mixed model association (EMMA) algorithm to correct for underlying population structure19, thereby reducing the number of false positive association signals (Suppl. Fig. III). The analysis was performed on females (Fig. 2A), males (Fig. 2B) and on both genders with sex as a covariate (Fig. 2C) using more than 75,000 single nucleotide polymorphisms (SNPs). Using a 5% false discovery rate (FDR), several loci exhibited significant association (Fig. 2 and Table 1). We then compared our association results with previously identified QTL for atherosclerosis. We complied a list of genome-wide significant atherosclerosis QTL by querying the mouse genome informatics website (http://www.informatics.jax.org). We defined a 95% confidence interval for a QTL to be 20 Mb and found 30 independent QTL (not within 20 Mb of each other). We compared these historical loci with the results of our current study (Table 1). For each analysis (males, females and combined genders), we observed significant overlap of our results with the historical QTL based on linkage20–26. For example, for females 4 out of 5 loci map within 10 Mb of a previous QTL (p<0.01 using binomial probability). For males, the results were 4 out of 8 loci (p=0.07), and for combined genders, 4 out of 5 loci (p=0.036). Overall, these data suggest that association analysis in mice offers robust mapping potential for atherosclerosis.
Figure 2. High resolution genetic mapping of atherosclerosis susceptibility.
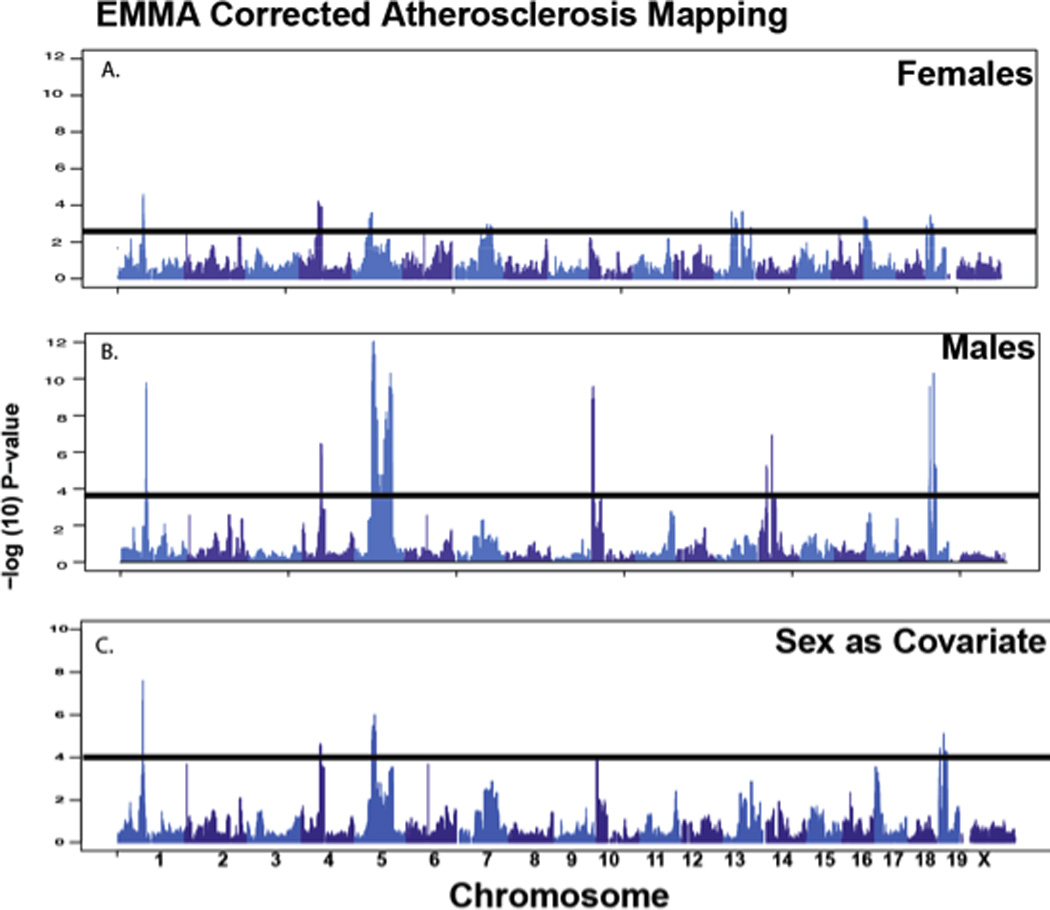
Loci detected for aortic sinus lesion size are shown for female mice (A), male mice (B), and combined sexes using sex as a covariate (C). X-axis is genomic position and Y-axis is −log10 of the p-value following correction for population structure, as described in Methods.
Table 1.
Association mapping for atherosclerosis corresponds to historical QTL data
| Chr | Mb | Males | Females | Sex as a covariate |
Previous QTL |
Peak linkage Mb |
Distance Mb |
|---|---|---|---|---|---|---|---|
| 1 | 76 | 1.65×10⁻¹⁰ | 2.55×10−05 | 1.25×10−07 | Ath3028 | 76 | <1 |
| 4 | 59 | 3.63×10−07 | 5.93×10−05 | 1.98×10−05 | Ath820, 28 | 59 | <1 |
| 5 | 62 | 9.13×10⁻¹³ | 2.77 ×10−04 | 6.12×10−07 | none | ||
| 71 | 4.97×10⁻¹¹ | NS | NS | none | |||
| 10 | 7 | 2.58×10⁻¹⁰ | NS | 1.89×10−04 | Ascla223 | 18 | 11 |
| 24 | 2.23 ×10⁻⁴ | NS | NS | Ath2021 | 20 | 4 | |
| 13 | 53 | NS | 2.41 ×10−04 | NS | Ath2526, 28 | 44 | 9 |
| 85 | NS | 2.29 ×10−04 | NS | Ath3228 | 89 | 4 | |
| 14 | 30 | 5.76×10−06 | NS | NS | none | ||
| 48 | 1.22×10−07 | NS | NS | Ath1324* | 56 | 8 | |
| 19 | 6 | 2.62×10⁻¹⁰ | NS | NS | None | ||
| 17 | 5.14×10⁻¹¹ | NS | 3.89×10−06 | Ath1624* | 38 | 19 |
indicates suggestive QTL in primary study and not used for binomial calculation
We repeated our association analysis for circulating levels of both high-density lipoprotein (HDL) and total cholesterol (Suppl. Figs. IV, V). We used EMMA corrected p-values, identified loci exceeding a 5% FDR and compared these to published loci27 and the mouse genome informatics website, http://www.informatics.jax.org. Compared to historical results, we observed that 12 out of the 13 associations in our results mapped within 10 Mb, the peak marker of a previously reported lipid QTL (Suppl.Table II). As in the case of atherosclerosis, this represents a significant enrichment using a binomial test (p<0.0007), and some of the lipoprotein loci overlapped with the atherosclerosis loci. For example, the locus responsible for lesion size on Chromosome (Chr) 4 also perturbed HDL, suggesting a possible casual relationship. This locus has been previously mapped for HDL levels in 4 independent crosses27 and contains two postulated candidate genes, Abca1 and Cyp7a1.
Replication in an independent dataset
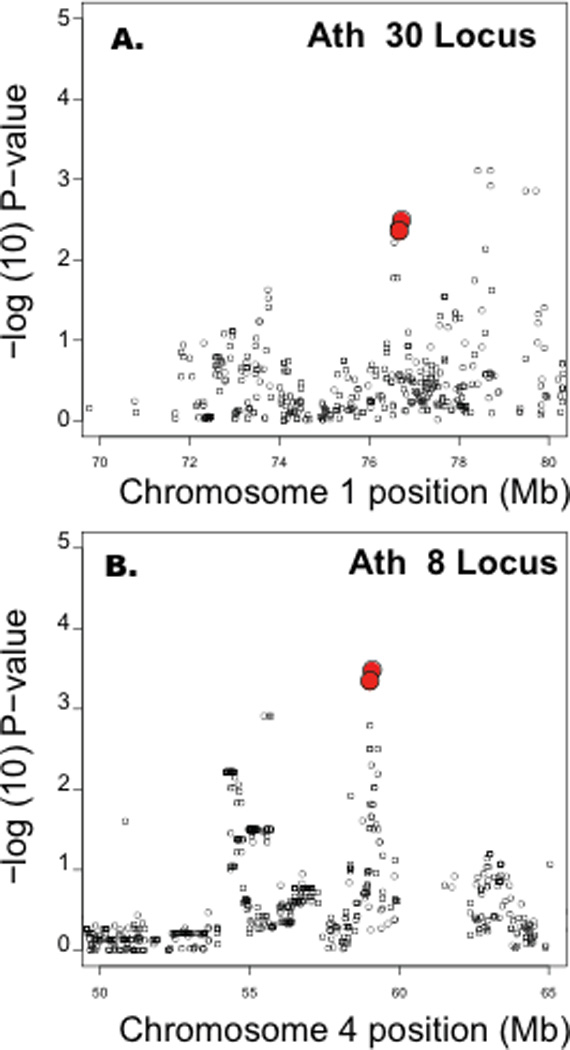
We were particularly interested in two loci, on Chr 1 at 76 Mb and Chr 4 at 59 Mb, as we have previously mapped these loci in F2 crosses between C3H/HeJ and C57BL/J mice with a Apoe−/− mutation (BXH.Apoe−/−) 25, 28. We next tested if these two loci replicated in an independent dataset. Paigen and colleagues have performed studies of atherosclerosis on multiple inbred strains of mice using a diet that includes cholic acid and results in much smaller lesions than those in genetically modified mice, including the present study29–31. Nevertheless, since the results of Paigen 1, available in the Mouse Phenome Database of The Jackson Laboratories (http://phenome.jax.org/), were consistent with our results using the tg(APOB) mice, we performed association analysis. After removal of the wild-derived strains (since these confound association due to their large genetic distance from laboratory strains), the Paigen 1 subset contains 31 strains. As shown by the association plot (Figure 3), there is significant evidence of association at both the Ath30 (p< 1.3×10⁻²) and Ath8 (p< 3.8 × 10⁻⁴) loci, consistent with our results.
Figure 3. Replication of association results in historical data.
The study Paigen 1 was downloaded from the mouse genome informatics website. Wild-derived strains were removed and remaining data was mapped using EMMA. Data for the Ath30 (A) and Ath8 (B) loci are presented for female mice. Red circles indicate peak SNPs in the current study.
Fine mapping of previously identified Ath30 locus
We chose to focus on the association peak at around 75 Mb on Chr 1 since it was the strongest peak in our association data in females, males, and the combined dataset (Fig. 2), and it corresponded well to the position of Ath30 that we previously identified in the BXH.Apoe−/− F2 cross 25. We were also able to confirm this locus using the Paigen 1 study.
We defined the resolution of our association panel using linkage disequilibrium (LD) by calculating the correlation among SNPs used in this study. Historical recombination events determine the amount of correlation among markers and thus highly correlated SNPs form blocks along chromosomes, as in human populations. The boundaries of these blocks determine the genetic resolution, defining the candidate genes underlying an association. We compared the LD for Chr 1 in the current study with that of the BXH.Apoe−/−F2 (Suppl. Figs. VI). As can be seen, association results in greatly improved resolution by more than an order of magnitude. For example, in the current study, the average r2 over a 100 Mb sliding window was 0.6 for markers 100kb apart and 0.4 for markers 1 Mb apart (Suppl. Figs. VI).
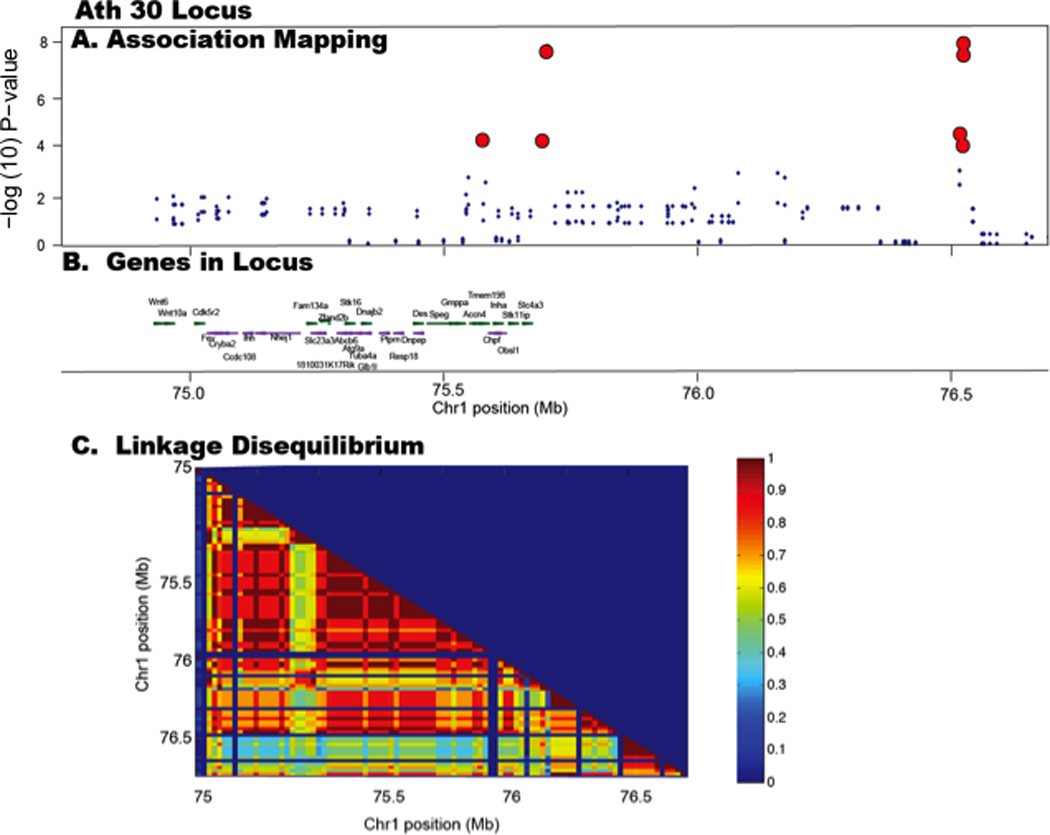
We observed three SNPs (rs31896983, rs32179781 and rs30136637) in the Ath30 region that were most strongly associated with atherosclerosis in males and females (Fig. 4A). The SNPs were located in the region 74.8 to 76.5 Mb, in strong LD with one another (Fig. 4C), and were not associated with lipid traits. The region contained 31 protein coding genes and 1 miRNA gene. The physical locations of these are shown in Fig. 4B.
Figure 4. High resolution mapping of Ath30 locus.
(A) Genetic association results between 74 and 78 Mb on Chr 1 are shown. Mapping data is for both genders using sex as a covariate. (B) Physical locations of genes are denoted by green horizontal bars (reverse strand) and purple horizontal bars (forward strand). (C) The lower panel shows a heatmap of the correlations of SNPs at Ath30 locus. Red indicates SNPs that are highly correlated (in strong linkage disequilibrium (LD) with each other) and defines the critical region for candidate gene selection.
We examined which of these genes have a structural variant using re-sequencing data from the recently released mouse genomes database (http://www.sanger.ac.uk/resources/mouse/genomes/). Analysis of SNPs with coding changes identified 13 genes with altered structure (Suppl. Table III) but only one of these, Speg, also known as aortic preferentially expressed protein 1 (Apeg1), has been associated with atherosclerosis in the literature32.
The Ath30 locus was not associated with lipid levels in this study and the original report25 and thus we hypothesized that the effects of the locus might be vessel wall specific. To address this we analyzed the aortic gene expression from 93 strains of mice (Suppl. Table IV). Because analysis of aortas from hyperlipidemic mice would be confounded by differences in atherosclerotic lesion composition, we chose to quantitate mRNA from non-hyperlipidemic mice from the HMDP. In particular, two of these positional candidates, desmin (Des) and galactosidase, beta 1-like (Glb1l), were genetically regulated by this locus with highly significant local eQTL, 8.4×10⁻⁷ for Glb1l and 1.2×10⁻⁵ for Des (Fig. 5). P-values for all 31 genes and physical positions of SNPs regulating Glb1l and Des expression are listed in Suppl. Table V.
Figure 5. Aortic eQTL analysis identifies candidate genes.
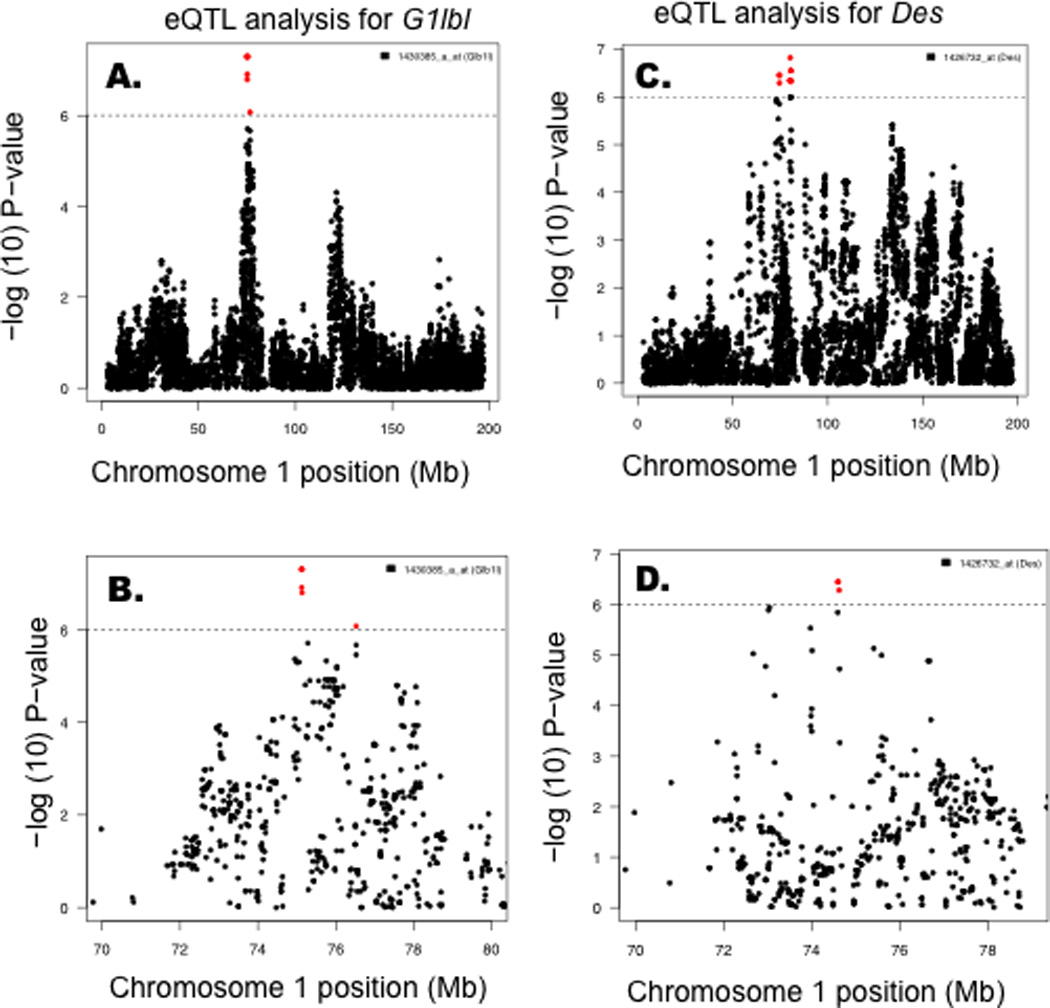
Using aortic tissue from non-hyperlipidemic mice, mRNA levels were quantitated in 93 strains using Affymetrix 430A microarrays. These data were analyzed using EMMA to identify genes within the Ath30 locus whose expression is under significant local genetic regulation. Two genes, Des (A) and Glb1l (B) were found to have significant local expression QTL.
To further explore the possible relevance of the genes to atherosclerosis, we examined their expression in endothelial cells isolated from aortas of C57BL/6J Apoe−/− and wild type C57BL/6J (wt) females at 4 and 24 weeks of age. We found that Des mRNA levels were significantly upregulated in endothelial cells but not smooth muscle cells from Apoe−/− mice as compared to wt mice at 4 weeks, prior to the infiltration of the aorta by inflammatory cells. Des expression was also elevated in the intimal lesions of 24 week-old Apoe−/− mice as compared to wt mice (Fig. 6). There were no significant differences in Glb1l expression in the studies (Fig. 6).
Figure 6. Aortic and intimal expression of candidate genes during atherogenesis.
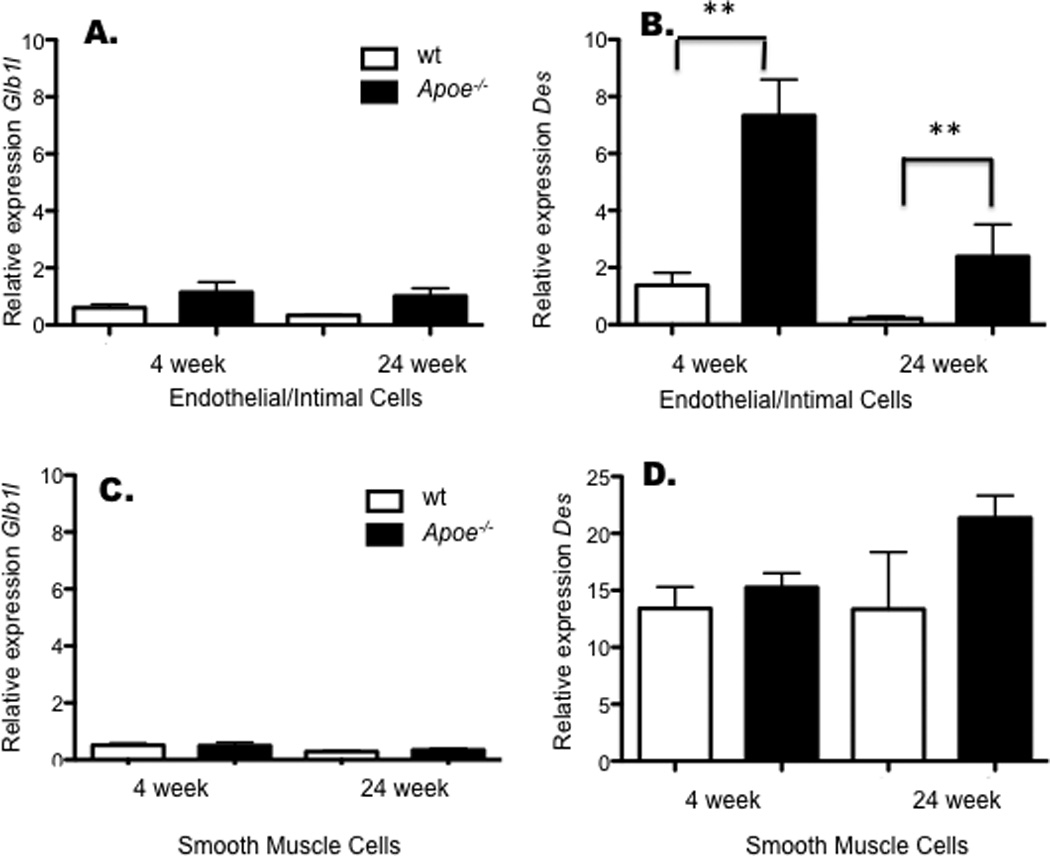
Intimal and smooth muscle cells were isolated as described in the methods. Expression of Glb1l and Des were quantitated in endothelial and intimal cells (A and B) or aortic smooth muscle cells (C and D) by qPCR. Expression values are normalized to B2m and significant differences determined by t-test. Values are mean ± SEM. ** indicates significant differences (p<0.01).
DISCUSSION
We have outlined a novel strategy for fine mapping atherosclerosis loci using association on a sensitized genetic background. In this proof of concept paper, we have provided strong evidence that the strategy works, with the potential of greatly narrowing the regions of the mouse genome that contribute to differences in atherosclerosis susceptibility. We have previously reported the successful application of the EMMA algorithm for correction of the significant population structure existing among inbred strains of mice, allowing association analysis using common inbred strains of mice5. As compared to linkage, association analysis has much improved mapping resolution because it utilizes the many historical recombinations that have occurred during the generation of inbred strains rather than the much smaller number of recombinations that occur in a genetic cross.
In order to induce significant atherosclerotic lesions, we utilized a sensitized genetic background (the human apolipoprotein B transgene). Indeed, the lesions we observed were about 10-fold larger than those obtained using a high fat, cholic acid diet alone. It is noteworthy that our results among the BXH subset of RI strains surveyed with the human apoB transgene were highly concordant with previous studies from the laboratory of Paigen and coworkers and our laboratory. This suggests that the genetic factors contributing to fatty streaks and more advanced lesions show considerable overlap. The concordance of our data with previous genetic studies of atherosclerosis in mice also validates the F1 hybrid strategy for introducing a sensitizing mutation onto multiple genetic backgrounds. The strategy has the drawback that it will miss recessive mutations contributing to the trait that are carried by the partner strain (that is, the strain to which the sensitizing mutation carrying strain is crossed).
We have used our association strategy to fine map loci that have previously been identified using linkage, focusing on Ath30. Our original study in BXH.Apoe−/− mice identified the Ath30 locus on Chr 1 with a 95% confidence interval of 8Mb, from 72 to 80 Mb, containing over 300 genes25. Using association we are now able to reduce the interval of the Ath30 QTL to a 2 Mb region, between 74.8 to 76.8 Mb on Chr 1, containing only 31 genes. This allows us to eliminate several positional candidates from our initial cross, such as 2310007B03Rik. Analysis of SNPs with coding changes identified 13 of the 31 genes in the interval, with missense variants.
Since the locus does not map with plasma lipids, we hypothesized that the gene(s) underlying the Ath30 locus may be vessel wall specific and thus performed eQTL analysis of aorta. Two genes had highly significant local eQTL, Des and Glb1l. Des encodes a proteoglycan that has been previously implicated as a candidate gene for atherosclerosis in human lesions33 and galactosidase, beta 1-like is an uncharacterized gene.
To further examine the possible role of these candidates in atherogenesis we compared their expression in cells derived from aortas from wild-type and Apoe−/− mice. These results indicate that Des mRNA levels are induced prior to initiation of extensive atherosclerosis at 4 weeks of age and elevated expression continues into more advanced lesion development at 24 weeks of age. There were no effects on Glb1l.
The original studies identifying Ath30 indicated that this locus was sex-biased, with females, but not males, exhibiting a significant QTL.25. The explanation for the failure to observe sex-bias in the present association study is unclear. However, it is known that the nature of the sensitizing mutation can affect sex differences (for example,34, 35 and, whereas, the previous study used an Apoe−/− sensitizing mutation, this study employed a human APOB transgene. The fact that the sex bias was not observed in our present study could well be due to differences in sensitizing mutation.
In conclusion, our results suggest that the mouse may provide another unbiased approach to identify the genes and pathways contributing to this common forms of atherosclerosis (and other complex traits), complementing human studies. Analyses in mice may also help overcome some of the limitations of human studies, particularly the analysis of gene-by-gene and gene-by-environment interactions.
MATERIALS AND METHODS
Mice and Diets
C57BL/6-tg(APOB) mice were purchased from Taconic and bred with 11 inbred and 11 recombinant inbred strains purchased from the Jackson labs. Progeny of these crosses were genotyped to verify ApoB100 tg status using forward (GAATAACTTCCGGAGAGTTGCAAT) and reverse (CTCTTAGCCCCATTCAGCTCTGAC).
The mice were fed Purina Chow containing 4% fat until 8 weeks of age, and then transferred to an atherogenic diet, Harland Teklad TD.88031 containing 1.25% cholesterol and 0.3% cholic acid. After 16 weeks of diet, the mice were fasted for 16 hours, anesthesized with isoflurane, and blood collected via retro-orbital sinus. Plasmas were stored at −80° C until assay.
Genotypes for association analysis
A description of the genotypes has been previously described5. We filtered the available 135,000 SNPs to include only those with a minor allele frequency of 10% and less then 10% missing genotypes. The number of SNPs used was approximately 75,000. A complete list of genotypes is available at: http://mouse.cs.ucla.edu/mouseHapMap.
Plasma assays
Plasma triglycerides, total cholesterol, unesterified cholesterol, HDL cholesterol, LDL/VLDL cholesterol, glucose and free fatty acids were measured as previously described36.
Atherosclerotic lesions
The hearts from 288 F1 mice were embedded in OCT and serially sectioned. Every other section was collected and every third section was stained with oil red O for quantitation of lesions as previously described36.
BXH.Apoe−/−QTL
A genetic map with markers about 1.5 cM apart was constructed using SNP markers as described25. Quantitative trait locus (QTL) analysis was performed using R/qtl package37, using single marker linear regression to model QTL effects. Significant QTL were determined at a genome-wide p-value of <0.05. The LOD scores corresponding to significant and suggestive QTL were determined by permuting the data 1000 times38. The 95% confidence interval for QTL was determined using the 1.5 LOD drop.
Aortic Tissue Expression
Flash frozen samples were weighed and homogenized in Qiazol according to the manufacturer’s protocol. Following homogenization livers were isolated in RNeasy 96 columns (Qiagen) using the manufacturers protocol. RNA integrity was confirmed using the Agilent 2100 Bioanalyzer (Agilent, Palo Alto, CA). RNA was processed according to manufacturer’s specifications and hybridized to Affymetrix Genome HT_MG-430A arrays. Detailed methods are included in the Supplemental information. A list of all strains arrayed is contained in Supplemental Table 6.
Analysis of gene expression in vascular cells of Apoe−/− mice
The cell isolation protocol was adapted from a previously published method for intimal cell isolation39. After rinsing in cold PBS, the aorta was placed on a glass slide, the surrounding connective tissue was removed, and the vessel was opened en face. In order to visualize the endothelial layer, the opened aorta was stained with 30 uL hematoxylin for 3 minutes. The stain was rinsed off with cold PBS. Collagenase liberase blendzyme 2 (Roche) was diluted 1:100 with PBS, and 25 uL was added to the top of the aorta on the slide and incubated at 37 C for 8 minutes. The slide with collagenase-treated aorta was then placed under a dissecting microscope, and the endothelial cells were gently pried off using a 26-gauge needle. This process continued until all endothelial cells were removed, determined by the lack of hematoxylin-dyed nuclei on the surface of the sample. The liquid containing the endothelial cells was then pipetted with a thin pipet tip into RNA extraction buffer. RNA was extracted using the RNAqueous®-Micro Kit by Ambion following the manufacturer’s protocol. Aortas with the intimal layer removed, as described above, consisted primarily of smooth muscle cells. These were homogenized in Qiazol for 30 seconds, and RNA was isolated with the Qiagen RNeasy kit standard protocol. Transcript levels were quantitated by PCR (RocheLightCycler 480). cDNA was synthesized using the manufacturers recommendation (Applied Biosystems). Primer sequences are shown in Supplemental Table VI.
Statistical analysis
All statistical analyses for the project were performed using the R language and environment for statistical computing (http://cran.r-project.org/). We calculated the FDR threshold of EMMA corrected based on mapping results from males and female datasets using the package q-value. The binomial probability was calculated using the function, binom.test. Using the assumption that each locus was 20 Mb we estimated that 22% of the mouse genome contained a atherosclerosis QTL. A similar estimate for HDL QTL has been previously reported20. We applied the previously described EMMA linear mixed model to account for the population structure and genetic relatedness among strains in the genome-wide association mapping5, 19. A description of EMMA is provided in the supplemental information.
Supplementary Material
ACKNOWLEDGEMENTS
Grant Support: This research was supported in part by PO1 HL30568 NIH/NHLBI (AJL) and K99 HL102223 (BJB).
Footnotes
Publisher's Disclaimer: This is a PDF file of an unedited manuscript that has been accepted for publication. As a service to our customers we are providing this early version of the manuscript. The manuscript will undergo copyediting, typesetting, and review of the resulting proof before it is published in its final citable form. Please note that during the production process errors may be discovered which could affect the content, and all legal disclaimers that apply to the journal pertain.
REFERENCES
- 1.Schunkert H, Konig IR, Kathiresan S, Reilly MP, Assimes TL, Holm H, Preuss M, Stewart AF, Barbalic M, Gieger C, Absher D, Aherrahrou Z, Allayee H, Altshuler D, Anand SS, Andersen K, Anderson JL, Ardissino D, Ball SG, Balmforth AJ, Barnes TA, Becker DM, Becker LC, Berger K, Bis JC, Boekholdt SM, Boerwinkle E, Braund PS, Brown MJ, Burnett MS, Buysschaert I, Carlquist JF, Chen L, Cichon S, Codd V, Davies RW, Dedoussis G, Dehghan A, Demissie S, Devaney JM, Diemert P, Do R, Doering A, Eifert S, Mokhtari NE, Ellis SG, Elosua R, Engert JC, Epstein SE, de Faire U, Fischer M, Folsom AR, Freyer J, Gigante B, Girelli D, Gretarsdottir S, Gudnason V, Gulcher JR, Halperin E, Hammond N, Hazen SL, Hofman A, Horne BD, Illig T, Iribarren C, Jones GT, Jukema JW, Kaiser MA, Kaplan LM, Kastelein JJ, Khaw KT, Knowles JW, Kolovou G, Kong A, Laaksonen R, Lambrechts D, Leander K, Lettre G, Li M, Lieb W, Loley C, Lotery AJ, Mannucci PM, Maouche S, Martinelli N, McKeown PP, Meisinger C, Meitinger T, Melander O, Merlini PA, Mooser V, Morgan T, Muhleisen TW, Muhlestein JB, Munzel T, Musunuru K, Nahrstaedt J, Nelson CP, Nothen MM, Olivieri O, Patel RS, Patterson CC, Peters A, Peyvandi F, Qu L, Quyyumi AA, Rader DJ, Rallidis LS, Rice C, Rosendaal FR, Rubin D, Salomaa V, Sampietro ML, Sandhu MS, Schadt E, Schafer A, Schillert A, Schreiber S, Schrezenmeir J, Schwartz SM, Siscovick DS, Sivananthan M, Sivapalaratnam S, Smith A, Smith TB, Snoep JD, Soranzo N, Spertus JA, Stark K, Stirrups K, Stoll M, Tang WH, Tennstedt S, Thorgeirsson G, Thorleifsson G, Tomaszewski M, Uitterlinden AG, van Rij AM, Voight BF, Wareham NJ, Wells GA, Wichmann HE, Wild PS, Willenborg C, Witteman JC, Wright BJ, Ye S, Zeller T, Ziegler A, Cambien F, Goodall AH, Cupples LA, Quertermous T, Marz W, Hengstenberg C, Blankenberg S, Ouwehand WH, Hall AS, Deloukas P, Thompson JR, Stefansson K, Roberts R, Thorsteinsdottir U, O'Donnell CJ, McPherson R, Erdmann J, Samani NJ. Large-scale association analysis identifies 13 new susceptibility loci for coronary artery disease. Nat Genet. 2011;43:333–338. doi: 10.1038/ng.784. [DOI] [PMC free article] [PubMed] [Google Scholar]
- 2.Manolio TA, Collins FS, Cox NJ, Goldstein DB, Hindorff LA, Hunter DJ, McCarthy MI, Ramos EM, Cardon LR, Chakravarti A, Cho JH, Guttmacher AE, Kong A, Kruglyak L, Mardis E, Rotimi CN, Slatkin M, Valle D, Whittemore AS, Boehnke M, Clark AG, Eichler EE, Gibson G, Haines JL, Mackay TF, McCarroll SA, Visscher PM. Finding the missing heritability of complex diseases. Nature. 2009;461:747–753. doi: 10.1038/nature08494. [DOI] [PMC free article] [PubMed] [Google Scholar]
- 3.Zuk O, Hechter E, Sunyaev SR, Lander ES. The mystery of missing heritability: Genetic interactions create phantom heritability. Proc Natl Acad Sci U S A. 2012;109:1193–1198. doi: 10.1073/pnas.1119675109. [DOI] [PMC free article] [PubMed] [Google Scholar]
- 4.Chen Y, Rollins J, Paigen B, Wang X. Genetic and genomic insights into the molecular basis of atherosclerosis. Cell metabolism. 2007;6:164–179. doi: 10.1016/j.cmet.2007.07.001. [DOI] [PMC free article] [PubMed] [Google Scholar]
- 5.Bennett BJ, Farber CR, Orozco L, Min Kang H, Ghazalpour A, Siemers N, Neubauer M, Neuhaus I, Yordanova R, Guan B, Truong A, Yang WP, He A, Kayne P, Gargalovic P, Kirchgessner T, Pan C, Castellani LW, Kostem E, Furlotte N, Drake TA, Eskin E, Lusis AJ. A high-resolution association mapping panel for the dissection of complex traits in mice. Genome Res. 2010 doi: 10.1101/gr.099234.109. [DOI] [PMC free article] [PubMed] [Google Scholar]
- 6.Valdar W, Solberg LC, Gauguier D, Burnett S, Klenerman P, Cookson WO, Taylor MS, Rawlins JN, Mott R, Flint J. Genome-wide genetic association of complex traits in heterogeneous stock mice. Nat Genet. 2006;38:879–887. doi: 10.1038/ng1840. [DOI] [PubMed] [Google Scholar]
- 7.Farber CR, Bennett BJ, Orozco L, Zou W, Lira A, Kostem E, Kang HM, Furlotte N, Berberyan A, Ghazalpour A, Suwanwela J, Drake TA, Eskin E, Wang QT, Teitelbaum SL, Lusis AJ. Mouse genome-wide association and systems genetics identify asxl2 as a regulator of bone mineral density and osteoclastogenesis. PLoS Genet. 2011;7:e1002038. doi: 10.1371/journal.pgen.1002038. [DOI] [PMC free article] [PubMed] [Google Scholar]
- 8.Hyman RW, Frank S, Warden CH, Daluiski A, Heller R, Lusis AJ. Quantitative trait locus analysis of susceptibility to diet-induced atherosclerosis in recombinant inbred mice. Biochem Genet. 1994;32:397–407. doi: 10.1007/BF00566060. [DOI] [PubMed] [Google Scholar]
- 9.Plump AS, Smith JD, Hayek T, Aalto-Setala K, Walsh A, Verstuyft JG, Rubin EM, Breslow JL. Severe hypercholesterolemia and atherosclerosis in apolipoprotein edeficient mice created by homologous recombination in es cells. Cell. 1992;71:343–353. doi: 10.1016/0092-8674(92)90362-g. [DOI] [PubMed] [Google Scholar]
- 10.Zhang SH, Reddick RL, Piedrahita JA, Maeda N. Spontaneous hypercholesterolemia and arterial lesions in mice lacking apolipoprotein e. Science. 1992;258:468–471. doi: 10.1126/science.1411543. [DOI] [PubMed] [Google Scholar]
- 11.Ishibashi S, Brown MS, Goldstein JL, Gerard RD, Hammer RE, Herz J. Hypercholesterolemia in low density lipoprotein receptor knockout mice and its reversal by adenovirus-mediated gene delivery. J Clin Invest. 1993;92:883–893. doi: 10.1172/JCI116663. [DOI] [PMC free article] [PubMed] [Google Scholar]
- 12.Purcell-Huynh DA, Farese RV, Jr, Johnson DF, Flynn LM, Pierotti V, Newland DL, Linton MF, Sanan DA, Young SG. Transgenic mice expressing high levels of human apolipoprotein b develop severe atherosclerotic lesions in response to a high-fat diet. J Clin Invest. 1995;95:2246–2257. doi: 10.1172/JCI117915. [DOI] [PMC free article] [PubMed] [Google Scholar]
- 13.Machleder D, Ivandic B, Welch C, Castellani L, Reue K, Lusis AJ. Complex genetic control of hdl levels in mice in response to an atherogenic diet. Coordinate regulation of hdl levels and bile acid metabolism. J Clin Invest. 1997;99:1406–1419. doi: 10.1172/JCI119300. [DOI] [PMC free article] [PubMed] [Google Scholar]
- 14.Paigen B, Nesbitt MN, Mitchell D, Albee D, LeBoeuf RC. Ath-2, a second gene determining atherosclerosis susceptibility and high density lipoprotein levels in mice. Genetics. 1989;122:163–168. doi: 10.1093/genetics/122.1.163. [DOI] [PMC free article] [PubMed] [Google Scholar]
- 15.Paigen B, Mitchell D, Reue K, Morrow A, Lusis AJ, LeBoeuf RC. Ath-1, a gene determining atherosclerosis susceptibility and high density lipoprotein levels in mice. Proc Natl Acad Sci U S A. 1987;84:3763–3767. doi: 10.1073/pnas.84.11.3763. [DOI] [PMC free article] [PubMed] [Google Scholar]
- 16.Paigen B, Mitchell D, Holmes PA, Albee D. Genetic analysis of strains c57bl/6j and balb/cj for ath-1, a gene determining atherosclerosis susceptibility in mice. Biochem Genet. 1987;25:881–892. doi: 10.1007/BF00502607. [DOI] [PubMed] [Google Scholar]
- 17.Colinayo VV, Qiao JH, Wang X, Krass KL, Schadt E, Lusis AJ, Drake TA. Genetic loci for diet-induced atherosclerotic lesions and plasma lipids in mice. Mamm Genome. 2003;14:464–471. doi: 10.1007/s00335-002-2187-2. [DOI] [PubMed] [Google Scholar]
- 18.Ghazalpour A, Wang X, Lusis AJ, Mehrabian M. Complex inheritance of the 5- lipoxygenase locus influencing atherosclerosis in mice. Genetics. 2006;173:943–951. doi: 10.1534/genetics.106.057455. [DOI] [PMC free article] [PubMed] [Google Scholar]
- 19.Kang HM, Zaitlen NA, Wade CM, Kirby A, Heckerman D, Daly MJ, Eskin E. Efficient control of population structure in model organism association mapping. Genetics. 2008;178:1709–1723. doi: 10.1534/genetics.107.080101. [DOI] [PMC free article] [PubMed] [Google Scholar]
- 20.Korstanje R, Eriksson P, Samnegard A, Olsson PG, Forsman-Semb K, Sen S, Churchill GA, Rollins J, Harris S, Hamsten A, Paigen B. Locating ath8, a locus for murine atherosclerosis susceptibility and testing several of its candidate genes in mice and humans. Atherosclerosis. 2004;177:443–450. doi: 10.1016/j.atherosclerosis.2004.08.006. [DOI] [PubMed] [Google Scholar]
- 21.Ishimori N, Li R, Kelmenson PM, Korstanje R, Walsh KA, Churchill GA, Forsman-Semb K, Paigen B. Quantitative trait loci analysis for plasma hdl-cholesterol concentrations and atherosclerosis susceptibility between inbred mouse strains c57bl/6j and 129s1/svimj. Arterioscler Thromb Vasc Biol. 2004;24:161–166. doi: 10.1161/01.ATV.0000104027.52895.D7. [DOI] [PubMed] [Google Scholar]
- 22.Smith JD, James D, Dansky HM, Wittkowski KM, Moore KJ, Breslow JL. In silico quantitative trait locus map for atherosclerosis susceptibility in apolipoprotein edeficient mice. Arterioscler Thromb Vasc Biol. 2003;23:117–122. doi: 10.1161/01.atv.0000047461.18902.80. [DOI] [PubMed] [Google Scholar]
- 23.Teupser D, Tan M, Persky AD, Breslow JL. Atherosclerosis quantitative trait loci are sex- and lineage-dependent in an intercross of c57bl/6 and fvb/n low-density lipoprotein receptor−/− mice. Proc Natl Acad Sci U S A. 2006;103:123–128. doi: 10.1073/pnas.0509570102. [DOI] [PMC free article] [PubMed] [Google Scholar]
- 24.Dansky HM, Shu P, Donavan M, Montagno J, Nagle DL, Smutko JS, Roy N, Whiteing S, Barrios J, McBride TJ, Smith JD, Duyk G, Breslow JL, Moore KJ. A phenotypesensitizing apoe-deficient genetic background reveals novel atherosclerosis predisposition loci in the mouse. Genetics. 2002;160:1599–1608. doi: 10.1093/genetics/160.4.1599. [DOI] [PMC free article] [PubMed] [Google Scholar]
- 25.Wang SS, Schadt EE, Wang H, Wang X, Ingram-Drake L, Shi W, Drake TA, Lusis AJ. Identification of pathways for atherosclerosis in mice: Integration of quantitative trait locus analysis and global gene expression data. Circ Res. 2007;101:e11–e30. doi: 10.1161/CIRCRESAHA.107.152975. [DOI] [PubMed] [Google Scholar]
- 26.Smith JD, Bhasin JM, Baglione J, Settle M, Xu Y, Barnard J. Atherosclerosis susceptibility loci identified from a strain intercross of apolipoprotein e-deficient mice via a high-density genome scan. Arterioscler Thromb Vasc Biol. 2006;26:597–603. doi: 10.1161/01.ATV.0000201044.33220.5c. [DOI] [PubMed] [Google Scholar]
- 27.Leduc MS, Lyons M, Darvishi K, Walsh K, Sheehan S, Amend S, Cox A, Orho-Melander M, Kathiresan S, Paigen B, Korstanje R. The mouse qtl map helps interpret human genome-wide association studies for hdl cholesterol. Journal of lipid research. 2011;52:1139–1149. doi: 10.1194/jlr.M009175. [DOI] [PMC free article] [PubMed] [Google Scholar]
- 28.Wang SS, Shi W, Wang X, Velky L, Greenlee S, Wang MT, Drake TA, Lusis AJ. Mapping, genetic isolation, and characterization of genetic loci that determine resistance to atherosclerosis in c3h mice. Arterioscler Thromb Vasc Biol. 2007 doi: 10.1161/ATVBAHA.107.148106. [DOI] [PubMed] [Google Scholar]
- 29.Nishina PM, Verstuyft J, Paigen B. Synthetic low and high fat diets for the study of atherosclerosis in the mouse. J Lipid Res. 1990;31:859–869. [PubMed] [Google Scholar]
- 30.Paigen B, Ishida BY, Verstuyft J, Winters RB, Albee D. Atherosclerosis susceptibility differences among progenitors of recombinant inbred strains of mice. Arteriosclerosis. 1990;10:316–323. doi: 10.1161/01.atv.10.2.316. [DOI] [PubMed] [Google Scholar]
- 31.Nishina PM, Wang J, Toyofuku W, Kuypers FA, Ishida BY, Paigen B. Atherosclerosis and plasma and liver lipids in nine inbred strains of mice. Lipids. 1993;28:599–605. doi: 10.1007/BF02536053. [DOI] [PubMed] [Google Scholar]
- 32.Arvanitis DA, Flouris GA, Spandidos DA. Genomic rearrangements on vcam1, sele, apeg1and aif1 loci in atherosclerosis. Journal of cellular and molecular medicine. 2005;9:153–159. doi: 10.1111/j.1582-4934.2005.tb00345.x. [DOI] [PMC free article] [PubMed] [Google Scholar]
- 33.Katsuda S, Boyd HC, Fligner C, Ross R, Gown AM. Human atherosclerosis. Iii. Immunocytochemical analysis of the cell composition of lesions of young adults. The American journal of pathology. 1992;140:907–914. [PMC free article] [PubMed] [Google Scholar]
- 34.Parks BW, Srivastava R, Yu S, Kabarowski JH. Apoe-dependent modulation of hdl and atherosclerosis by g2a in ldl receptor-deficient mice independent of bone marrow-derived cells. Arterioscler Thromb Vasc Biol. 2009;29:539–547. doi: 10.1161/ATVBAHA.108.179937. [DOI] [PMC free article] [PubMed] [Google Scholar]
- 35.Parks BW, Lusis AJ, Kabarowski JH. Loss of the lysophosphatidylcholine effector, g2a, ameliorates aortic atherosclerosis in low-density lipoprotein receptor knockout mice. Arterioscler Thromb Vasc Biol. 2006;26:2703–2709. doi: 10.1161/01.ATV.0000246774.02426.71. [DOI] [PubMed] [Google Scholar]
- 36.Mehrabian M, Qiao JH, Hyman R, Ruddle D, Laughton C, Lusis AJ. Influence of the apoa-ii gene locus on hdl levels and fatty streak development in mice. Arterioscler Thromb. 1993;13:1–10. doi: 10.1161/01.atv.13.1.1. [DOI] [PubMed] [Google Scholar]
- 37.Broman KW, Wu H, Sen S, Churchill GA. R/qtl: Qtl mapping in experimental crosses. Bioinformatics. 2003;19:889–890. doi: 10.1093/bioinformatics/btg112. [DOI] [PubMed] [Google Scholar]
- 38.Doerge RW, Churchill GA. Permutation tests for multiple loci affecting a quantitative character. Genetics. 1996;142:285–294. doi: 10.1093/genetics/142.1.285. [DOI] [PMC free article] [PubMed] [Google Scholar]
- 39.Jongstra-Bilen J, Haidari M, Zhu SN, Chen M, Guha D, Cybulsky MI. Low-grade chronic inflammation in regions of the normal mouse arterial intima predisposed to atherosclerosis. J Exp Med. 2006;203:2073–2083. doi: 10.1084/jem.20060245. [DOI] [PMC free article] [PubMed] [Google Scholar]
Associated Data
This section collects any data citations, data availability statements, or supplementary materials included in this article.