

Abstract
We analyzed whole genome based transcriptional profiles of Mycobacterium tuberculosis subjected to prolonged hypoxia to guide the discovery of novel potential antigens, by a combined bioinformatic and empirical approach. We analysed the fold induction of the 100 most highly induced genes at 7 days of hypoxia, as well as transcript abundance, peptide binding prediction (ProPred) adjusted for population specific MHC class II allele frequency, and by literature search. 26 candidate genes were selected by this bioinformatic approach and evaluated empirically using IFN-gamma and IL-2 ELISpot using immunodominant antigens (Acr-1, CFP-10, ESAT-6) as references. 23 of 26 proteins induced an IFN-γ response in PBMC of persons with active or latent tuberculosis (LTBI). Five novel immunodominant proteins: Rv1957, Rv1954c, Rv1955, Rv2022c and Rv1471 were identified that induced responses similar to CFP-10 and ESAT-6 in both magnitude and frequency. IL-2 responses were of lower magnitude than IFN-gamma. Only moderate evidence of infection stage specific recognition of antigens was observed. Reconciliation of bioinformatic and empirical hierarchies of immunodominance revealed that antigens could be predicted, providing transcriptomic data was combined with peptide binding prediction adjusted by population specific MHC class II allele frequency.
Introduction
In 2010, there were 8.8 million incident cases of tuberculosis (TB), 1.1 million deaths from TB among HIV-uninfected persons and an additional 0.35 million deaths from HIV-associated TB (1). Furthermore, one third of the world’s population is considered latently infected: a reservoir from which active TB disease will continue to develop, forming a major obstacle to achieve control (2).
Lack of understanding the biology of the pathogen is a major obstacle in vaccine development. Therefore, studying M. tuberculosis (MTB) antigens is a priority in order to identifying vaccine candidates that might elicit a protective immune response. Studies of MTB genomic deletions (like the region of difference 1, RD-1) led to the discovery of highly immunodominant, co-regulated, secreted, species-specific proteins CFP-10 and ESAT-6 (3, 4). Such use of genomic information paved the way to the development of in vitro assays that measure T cell release of Interferon-gamma (IFN-γ) which improved the specificity and possibly sensitivity of TB immunodiagnosis (5). An alternative genome based strategy is to relate what is highly expressed by bacilli in vivo or in vitro (and thereby potentially available as an antigen) (6) to what is recognised in vivo. Multiple studies in vitro and in vivo increasingly indicate adaptation of M. tuberculosis via oxygen limitation into a non-replicating persistent state (7). These observations have led to the models of latency and reactivation that suggest a prominent role for oxygen status in the biology of MTB (8). In vitro culture models represent conditions that tubercle bacilli are thought to encounter in vivo during persistence in the immune competent host. This is supported by the observations that genes of the dosR regulon, which are expressed in M. tuberculosis as part of the initial adaptation to the hypoxia, are up regulated in vitro in IFN-γ activated M. tuberculosis infected murine macrophages (9-11), are expressed in human lung tissue in patients with active TB (9), and are found to encode a number of MTB antigens with the potential to induce a strong T cell IFN-γ response (12-15). The finding of upregulation during bacterial replication, suggests that the role of dosR may not be specific to latency and that other factors may also be involved. A whole genome based transcriptional analysis of M. tuberculosis under in vitro hypoxic conditions revealed that induction of the dosR regulon is transient, with expression of nearly half of the genes returning to baseline by 24 hours. At the same time a more prolonged transcriptional adaptation to hypoxia was observed, that increased up to 96 hours, and then stabilized around what is referred to as the enduring hypoxic response (EHR) after 7 days (7). Based on these findings, we evaluated the EHR encoded genes as potential antigens, by analyzing whole genome transcriptional profiles of M. tuberculosis subject to prolonged hypoxia by a combined bioinformatic and immunological approach.
Materials and Methods
Microbial culture conditions, hypoxia model and microbial RNA analysis
These techniques have previously been extensively described (7). Briefly, exponential phase cultures grown in rolling culture to an OD600 of 0.3 were diluted to a starting OD of 0.1 with warm media. 500 mL of this starting culture was transferred to a constantly stirred 1liter flask. Hypoxia was generated by introducing a constant flow of nitrogen with trace amounts of oxygen (0.2% O2), leading to bacteriostasis. Samples were taken before hypoxia, at four hours, and after 1, 4, and 7 days of exposure to hypoxia. RNA was isolated from these samples using bead beating in the presence of Trizol, followed by chloroform extraction and precipitation of RNA. The RNA was further cleaned using an RNeasy kit (Qiagen). Approximately 3 μg of purified RNA was converted to cDNA using Superscript III (Invitrogen). Aminoallyl dUTP was included in the cDNA reaction, and subsequently conjugated to reactive Cy dye esters. The aerobically growing transcriptional profiles were directly compared to each subsequent hypoxic time point by co-hybridization on the same microarray slide. The microarray slides and protocols were provided by the Pathogen Functional Resource Centre at the J. C. Venter Institute as part of their NIAID contract N01-AI-15447. Slides were scanned with a GenePix 4000B purchased from Axon Technologies. Raw background subtracted intensities were normalized to SigA to provide an approximate measure of transcript abundance.
Bioinformatic analysis
Data sources
TubercuList (http://www.tuberculist.epfl.ch) and TB database (http://www.tbdb.org/) were used to interrogate EHR genes; Coding and protein sequence for each of the genes were obtained for further evaluation. NCBI BLAST (http://www.ncbi.nlm.nih.gov/BLAST/Blast.cgi) was used to find regions of high similarity in biological sequence with the sequences in nucleotide database. ProPred (16) (http://www.imtech.res.in/raghava/propred/), a web-based server was used to predict MHC class II binding regions in an antigen sequence. The analysis was carried out with a threshold of 1% (high stringency) for all 51 HLA-DR alleles available on the server. The number of peptide sequences with a binding score >30% of highest binding score attainable by any peptide for that allele, was calculated.
Pubmed (http://www.ncbi.nlm.nih.gov/pubmed/), was used for literature searches of the EHR genes. Information on whether they were already known to induce an immune response, whether the genes are essential (17), their function and co-regulation was compiled. The distribution of MHC class II allele frequency in the Xhosa population was derived from a previous study (18).
Ethics statement
The University of Cape Town’s Faculty of Health Sciences Human Research Ethics Committee approved this study (REC 296/2007). Written informed consent was obtained from all participants.
Human Subjects
Patients with active or latent TB were recruited at the Ubuntu clinic at Khayelitsha site B, South Africa. All were of Xhosa ethnicity. Active TB (ATB) was defined by smear positivity for and/or culture of M. tuberculosis from one or more sputum specimens. Latent TB (LTBI) was defined by transverse TST reactivity of > 10 mm in response to 2 TU PPD (RT23) at 48 hrs or an interferon-gamma. Enzyme linked immunospot (ELISpot) response to ESAT-6 or CFP-10 of > 20 spot forming cells (SFC)/106 PBMC in the absence of clinical symptoms or radiographic abnormality and with a negative sputum smear and culture for M. tuberculosis. All subjects underwent HIV counselling and testing, and positivity was an exclusion criterion. Patients with active tuberculosis (ATB) were sampled prior to commencing antitubercular chemotherapy. Known immunosuppression for other reasons, age < 18 years and pregnancy formed other exclusion criteria. Patients with ATB were treated according to South African national guidelines. The baseline characteristics of participants enrolled to the study are shown in Table I.
Table I.
Characteristics of study participants
| Active TB | Latent TB | p | |
|---|---|---|---|
| Number | 37 | 40 | |
| Median age (Range) | 36 | 20 | <0.0001 |
| Sex (Male:Female) | 26M:11F | 11M:32F | |
| Sputum smear positive | 34 Positive 2 negative 1 unknown |
NA | NA |
| Sputum culture positive | 33 Positive 2 negative 2 unknown/ Unavailable |
NA | NA |
| BCG vaccinated | 11 vaccinated 11 Not vaccinated 15 Don’t know/ data unavailable |
20 vaccinated 16 Not vaccinated 4 Don’t know/ data unavailable |
|
| Median Mantoux (IQR) and % positive |
NA | 11 mm (IQR 8-19) |
NA |
Antigens
Synthetic peptides of 20 amino acids in length overlapping by 10 amino acids, were synthesised, purified by HPLC and analysed by MS, and purchased from Peptide Protein Research Ltd, Oxford, UK. Peptides were dissolved in DMSO (<0.2% final concentration) and PBS and stored at −80°C until used. Antigenic stimuli were in the form of pools (each of the peptide pool contained minimum of 7 to maximum of 14 peptides per pool) with each peptide used at a final concentration of 10μg/ml. Control stimuli for ELISpot included anti-CD3 mAb CD3-2 (Mabtech, Nacka, Sweden) at 100 ng/ml final concentration and unstimulated wells.
ELISpot assays
Peripheral blood mononuclear cells (PBMC) were separated over Ficoll. Cells were frozen and stored in liquid nitrogen until analyzed in batches using 2.5 × 10⁵ PBMC in 100μl of RPMI/10% FCS (R10) /well. ELISpot assays were performed in total of 77 participants with active (37) and latent (40) TB covering all selected and control antigens. Due to limitation in cell numbers, antigens were assayed in two rounds. The interferon-gamma and IL-2 ELISpot assays were performed as described in (19). Spot forming cells were enumerated by immunospot counter (CTL, Cellular Technology Ltd) and confirmed by microscope (4X objective). Results are quoted as cytokine spot forming cells (SFC)/106 PBMC. The cut-off for positive results was >30 SFC/106 PBMC (above the background) for IFN-γ ELISpot, and >20 SFC/106 PBMC (above the background) for an IL-2 ELISpot response.
Statistical analysis
The normality of data was assessed by the D’Agostino and Pearson omnibus test using Graphpad Prism 5.0 software (www.graphpad.com). Parametric continuous variables were assessed by student’s paired and unpaired t-tests, and non-parametric by Wilcoxon matched pairs or Mann Whitney U tests. Contingency analysis was by Fisher’s exact test of probability. Correlation was assessed by non-parametric Spearman correlation coefficient.
Results
Bioinformatic evaluation and selection of candidate antigens
Fold Expression and SigA normalized intensity in EHR
We analysed whole genome based transcriptional data of MTB, using fold induction (mean >2 log fold induction) and transcript levels (normalized to median SigA intensity) during the hypoxic time course (4 hours, 1 day, 4 days and 7 days) as described previously (7). We ranked EHR genes based on fold induction at 7 days of hypoxia: the 100 genes with highest fold induction were selected for further evaluation. We assigned a qualitative score to aid prediction of antigenic candidates. The genes were ranked, ranging from rank 1 (highest fold induction) to rank 100 (lowest) and referred as R(FI) (Supplementary table I). The sigA normalised transcript levels at 4 and 7 days were also ranked from 1 to 100, and the average of ranks at 4 and 7 days were calculated; the average rank was referred to as R(NI) (Supplementary table I).
MHC class II-peptide binding prediction
Using ProPred (16), MHC class II (MHCII) -binding peptide prediction was performed for the following allelic variants as described in the methods: DR1 (2 allelic variants), DR3 (7), DR4 (9), DR 7 (6), DR8 (9), DR11 (9), DR13 (11) and DR15 (3). ProPred analysis predicts binding peptide sequences and provides a binding score attained by that peptide sequence. In addition, it also provides the highest binding score that could be attained by any peptide for that allele. In our scoring protocol we enumerated the number of peptide regions with a binding score >30%, attainable by any peptide for all the 51 HLA allelic variants. This score was then summed and corrected for the number of allelic variants of each allele examined, and referred as the MHC II binding peptide prediction score (Table II).
Table II.
MHC Class II binding peptide prediction: number of peptide sequence with >30 % of highest binding score
| MHC class II binding peptide prediction score | |||||||||
|---|---|---|---|---|---|---|---|---|---|
| S.No | Name | DR1 | DR3 | DR4 | DR7 | DR8 | DR11 | DR13 | DR15 |
| 1 | Rv0140 | 0.00 | 2.00 | 1.90 | 2.00 | 0.60 | 0.20 | 1.18 | 1.30 |
| 2 | Rv0188 | 3.00 | 2.20 | 3.20 | 5.00 | 3.50 | 3.20 | 4.07 | 4.90 |
| 3 | Rv0233 | 0.50 | 1.64 | 2.00 | 5.00 | 1.30 | 1.90 | 2.47 | 2.60 |
| 4 | Rv0251c | 1.50 | 2.28 | 0.30 | 1.00 | 1.66 | 2.00 | 2.36 | 3.90 |
| 5 | Rv0268c | 0.50 | 1.40 | 0.00 | 1.00 | 1.50 | 1.60 | 2.17 | 1.60 |
| 6 | Rv0327c | 3.00 | 4.95 | 4.70 | 5.00 | 5.20 | 4.90 | 4.68 | 4.90 |
| 7 | Rv0350 | 1.50 | 4.54 | 3.20 | 5.00 | 3.10 | 2.90 | 3.60 | 2.70 |
| 8 | Rv0384c | 4.00 | 4.94 | 5.36 | 5.00 | 4.30 | 4.00 | 4.13 | 4.90 |
| 9 | Rv0474 | 0.00 | 2.57 | 0.10 | 2.00 | 1.00 | 0.76 | 0.16 | 1.60 |
| 10 | Rv0520 | 0.00 | 1.70 | 0.30 | 3.50 | 1.46 | 0.60 | 0.63 | 2.00 |
| 11 | Rv0521 | 0.50 | 1.70 | 2.40 | 5.00 | 2.10 | 3.40 | 3.69 | 3.60 |
| 12 | Rv0754 | 2.50 | 4.90 | 4.10 | 5.00 | 4.10 | 2.80 | 3.00 | 2.80 |
| 13 | Rv0766c | 3.00 | 4.70 | 3.20 | 5.00 | 4.76 | 4.20 | 4.70 | 4.90 |
| 14 | Rv0767c | 2.50 | 3.08 | 1.80 | 5.00 | 1.80 | 2.84 | 3.45 | 1.09 |
| 15 | Rv0791c | 3.50 | 4.10 | 4.30 | 5.00 | 3.30 | 2.80 | 3.40 | 5.00 |
| 16 | Rv0793 | 0.50 | 1.14 | 0.30 | 1.00 | 3.40 | 1.20 | 1.70 | 2.00 |
| 17 | Rv0826 | 2.50 | 3.14 | 1.60 | 5.00 | 4.30 | 3.40 | 4.08 | 4.90 |
| 18 | Rv0846c | 1.00 | 4.78 | 4.50 | 5.00 | 5.80 | 3.30 | 4.60 | 4.20 |
| 19 | Rv0847 | 0.50 | 1.84 | 1.80 | 3.00 | 1.60 | 0.90 | 1.50 | 2.30 |
| 20 | Rv0848 | 0.50 | 4.28 | 4.10 | 5.00 | 3.32 | 3.30 | 3.56 | 1.07 |
| 21 | Rv0849 | 1.50 | 2.70 | 2.70 | 6.00 | 3.60 | 3.60 | 3.63 | 5.00 |
| 22 | Rv0940c | 1.50 | 0.12 | 2.30 | 5.00 | 3.72 | 3.10 | 4.18 | 5.00 |
| 23 | Rv0967 | 0.50 | 0.57 | 2.10 | 3.00 | 0.60 | 0.20 | 1.18 | 3.00 |
| 24 | Rv0976c | 3.00 | 4.99 | 6.10 | 5.00 | 4.46 | 3.60 | 2.80 | 5.00 |
| 25 | Rv0986 | 3.00 | 4.40 | 3.20 | 5.00 | 1.66 | 2.50 | 2.98 | 4.60 |
| 26 | Rv0990c | 4.00 | 4.54 | 3.80 | 5.00 | 2.80 | 3.90 | 4.03 | 1.00 |
| 27 | Rv0991c | 0.00 | 1.14 | 1.30 | 2.00 | 0.90 | 0.50 | 0.27 | 0.60 |
| 28 | Rv1169c | 0.50 | 0.50 | 2.50 | 5.00 | 0.00 | 0.20 | 0.50 | 3.00 |
| 29 | Rv1221 | 0.50 | 4.60 | 3.34 | 5.00 | 4.10 | 3.00 | 3.40 | 4.30 |
| 30 | Rv1284 | 2.00 | 3.54 | 2.50 | 5.00 | 2.50 | 2.60 | 3.30 | 4.00 |
| 31 | Rv1285 | 2.00 | 4.00 | 3.10 | 5.00 | 4.10 | 3.40 | 2.49 | 4.60 |
| 32 | Rv1403c | 3.00 | 3.55 | 2.10 | 4.00 | 0.60 | 1.70 | 2.09 | 1.00 |
| 33 | Rv1405c | 2.00 | 3.99 | 3.40 | 3.00 | 3.10 | 3.10 | 2.90 | 4.30 |
| 34 | Rv1471 | 1.50 | 1.14 | 1.15 | 2.00 | 0.80 | 0.60 | 0.89 | 3.30 |
| 35 | Rv1587c | 0.50 | 1.70 | 2.80 | 5.00 | 2.30 | 3.40 | 3.69 | 3.60 |
| 36 | Rv1738 | 0.00 | 0.14 | 0.70 | 3.00 | 1.30 | 0.30 | 1.09 | 1.30 |
| 37 | Rv1806 | 4.00 | 1.70 | 2.60 | 8.00 | 1.60 | 1.00 | 1.08 | 4.00 |
| 38 | Rv1813c | 0.50 | 3.00 | 0.80 | 4.00 | 3.10 | 2.30 | 2.56 | 1.09 |
| 39 | Rv1875 | 1.00 | 2.70 | 2.50 | 4.00 | 2.10 | 2.90 | 3.10 | 1.18 |
| 40 | Rv1909c | 1.50 | 2.80 | 1.40 | 2.00 | 1.83 | 1.00 | 1.80 | 1.30 |
| 41 | Rv1954c | 1.00 | 1.20 | 1.10 | 3.00 | 3.32 | 1.40 | 2.18 | 3.30 |
| 42 | Rv1955 | 1.00 | 3.95 | 1.00 | 2.00 | 1.96 | 2.29 | 2.76 | 3.00 |
| 43 | Rv1956 | 0.50 | 3.40 | 0.70 | 0.00 | 2.10 | 1.50 | 1.48 | 1.30 |
| 44 | Rv1957 | 3.00 | 3.28 | 1.80 | 5.00 | 2.50 | 3.40 | 3.79 | 4.30 |
| 45 | Rv1986 | 5.00 | 4.80 | 4.40 | 3.00 | 4.76 | 4.10 | 4.50 | 5.20 |
| 46 | Rv1990c | 0.00 | 2.54 | 1.70 | 4.00 | 0.83 | 0.60 | 1.72 | 1.00 |
| 47 | Rv1994c | 0.50 | 1.14 | 1.30 | 3.00 | 1.16 | 0.60 | 1.30 | 0.30 |
| 48 | Rv1995 | 1.00 | 4.10 | 2.50 | 4.00 | 3.00 | 2.20 | 2.80 | 4.30 |
| 49 | Rv1996 | 3.00 | 4.80 | 3.90 | 5.00 | 2.10 | 2.00 | 2.60 | 3.00 |
| 50 | Rv2007c | 0.50 | 2.60 | 0.10 | 2.00 | 0.00 | 0.30 | 0.00 | 0.00 |
| 51 | Rv2011c | 0.00 | 4.43 | 1.74 | 2.00 | 2.50 | 1.44 | 3.55 | 2.33 |
| 52 | Rv2012 | 0.00 | 2.14 | 0.70 | 0.00 | 3.80 | 2.90 | 3.17 | 2.20 |
| 53 | Rv2021c | 0.00 | 3.24 | 1.70 | 5.00 | 2.46 | 2.50 | 2.68 | 4.00 |
| 54 | Rv2022c | 1.50 | 1.70 | 0.70 | 3.00 | 1.30 | 1.30 | 1.81 | 1.30 |
| 55 | Rv2025c | 5.00 | 5.60 | 4.60 | 5.00 | 4.90 | 4.70 | 3.89 | 4.90 |
| 56 | Rv2030c | 4.00 | 4.70 | 4.20 | 5.00 | 4.90 | 4.00 | 4.40 | 3.96 |
| 57 | Rv2031c | 1.00 | 1.90 | 1.10 | 3.00 | 0.80 | 1.40 | 1.17 | 4.30 |
| 58 | Rv2032 | 2.00 | 4.98 | 3.70 | 5.00 | 3.60 | 3.20 | 3.18 | 4.30 |
| 59 | Rv2034 | 1.00 | 2.20 | 0.80 | 0.00 | 1.30 | 0.60 | 0.70 | 0.60 |
| 60 | Rv2035 | 1.00 | 1.00 | 0.80 | 1.00 | 1.60 | 0.80 | 1.60 | 0.72 |
| 61 | Rv2036 | 0.00 | 1.28 | 0.90 | 3.00 | 4.76 | 2.90 | 3.90 | 4.60 |
| 62 | Rv2050 | 0.00 | 1.70 | 0.30 | 1.00 | 0.60 | 0.30 | 0.09 | 1.00 |
| 63 | Rv2465c | 0.00 | 1.50 | 0.40 | 2.00 | 1.80 | 0.10 | 0.60 | 2.00 |
| 64 | Rv2466c | 0.00 | 1.57 | 1.80 | 4.50 | 2.16 | 2.16 | 2.45 | 2.20 |
| 65 | Rv2504c | 1.00 | 2.80 | 2.20 | 5.00 | 2.16 | 1.50 | 2.56 | 4.30 |
| 66 | Rv2517c | 0.00 | 0.00 | 0.60 | 3.00 | 0.60 | 0.80 | 0.09 | 2.00 |
| 67 | Rv2558 | 1.50 | 2.80 | 1.70 | 5.00 | 1.70 | 1.40 | 1.79 | 3.30 |
| 68 | Rv2617c | 4.00 | 1.78 | 3.10 | 5.00 | 3.16 | 2.10 | 3.36 | 4.90 |
| 69 | Rv2623 | 2.00 | 4.57 | 2.50 | 5.00 | 2.00 | 1.10 | 1.79 | 3.30 |
| 70 | Rv2626c | 1.50 | 2.28 | 2.60 | 2.00 | 2.46 | 2.60 | 3.20 | 1.60 |
| 71 | Rv2627c | 3.50 | 3.28 | 2.80 | 5.00 | 3.90 | 3.90 | 4.60 | 4.60 |
| 72 | Rv2628 | 0.00 | 0.14 | 0.40 | 5.00 | 0.76 | 0.60 | 1.69 | 1.00 |
| 73 | Rv2642 | 1.00 | 2.00 | 2.00 | 1.00 | 2.20 | 2.00 | 3.80 | 0.80 |
| 74 | Rv2643 | 3.50 | 3.14 | 3.30 | 0.00 | 3.60 | 4.60 | 5.36 | 1.45 |
| 75 | Rv2658c | 0.50 | 1.57 | 1.20 | 1.00 | 0.50 | 0.20 | 0.80 | 0.60 |
| 76 | Rv2659c | 1.50 | 2.57 | 3.10 | 5.00 | 3.66 | 3.20 | 3.08 | 4.00 |
| 77 | Rv2660c | 0.00 | 0.00 | 0.00 | 0.00 | 0.00 | 0.00 | 0.18 | 0.00 |
| 78 | Rv2662 | 0.50 | 0.42 | 0.90 | 0.00 | 0.76 | 0.50 | 0.80 | 1.30 |
| 79 | Rv2663 | 0.00 | 1.20 | 0.40 | 1.00 | 2.10 | 1.00 | 1.45 | 1.30 |
| 80 | Rv2664 | 0.00 | 0.94 | 4.40 | 0.00 | 0.30 | 0.70 | 0.76 | 1.00 |
| 81 | Rv2693c | 3.00 | 5.20 | 6.50 | 5.00 | 5.00 | 4.80 | 5.93 | 5.00 |
| 82 | Rv2694c | 1.00 | 2.00 | 1.70 | 2.00 | 3.00 | 2.93 | 3.50 | 1.20 |
| 83 | Rv2699c | 0.00 | 1.27 | 0.40 | 3.00 | 3.80 | 1.20 | 2.07 | 1.60 |
| 84 | Rv2780 | 3.50 | 5.10 | 3.70 | 7.00 | 5.20 | 4.30 | 5.40 | 6.30 |
| 85 | Rv2913c | 5.50 | 4.40 | 3.60 | 8.00 | 2.76 | 7.40 | 4.88 | 9.30 |
| 86 | Rv2962c | 3.50 | 5.00 | 4.14 | 4.50 | 4.90 | 5.40 | 5.39 | 4.20 |
| 87 | Rv2963 | 1.50 | 4.28 | 3.40 | 1.00 | 4.30 | 2.10 | 2.58 | 1.20 |
| 88 | Rv3130c | 4.00 | 5.30 | 5.34 | 6.50 | 4.80 | 2.90 | 3.62 | 4.90 |
| 89 | Rv3131 | 3.00 | 4.04 | 4.60 | 5.00 | 3.33 | 4.71 | 3.45 | 4.00 |
| 90 | Rv3269 | 0.00 | 0.43 | 0.77 | 1.00 | 3.17 | 1.28 | 1.64 | 0.67 |
| 91 | Rv3288c | 2.00 | 2.40 | 2.00 | 5.00 | 1.32 | 2.30 | 2.85 | 5.00 |
| 92 | Rv3290c | 1.00 | 3.70 | 2.70 | 2.00 | 3.43 | 4.50 | 4.66 | 7.30 |
| 93 | Rv3334 | 1.00 | 1.70 | 2.10 | 6.00 | 2.96 | 1.20 | 1.20 | 3.60 |
| 94 | Rv3406 | 1.50 | 4.50 | 3.90 | 5.00 | 3.80 | 4.40 | 4.24 | 4.30 |
| 95 | Rv3503c | 1.00 | 1.80 | 0.10 | 1.00 | 0.50 | 0.40 | 0.09 | 2.60 |
| 96 | Rv3515c | 2.50 | 0.43 | 3.40 | 4.00 | 4.96 | 4.20 | 4.35 | 3.00 |
| 97 | Rv3536c | 1.00 | 3.27 | 1.80 | 5.00 | 2.66 | 1.80 | 2.18 | 0.90 |
| 98 | Rv3597c | 0.00 | 0.85 | 0.30 | 0.00 | 0.96 | 0.50 | 1.18 | 0.00 |
| 99 | Rv3681c | 0.50 | 0.28 | 0.00 | 0.00 | 1.60 | 0.50 | 1.18 | 0.00 |
| 100 | Rv3862c | 0.50 | 0.70 | 1.70 | 3.00 | 0.33 | 0.80 | 1.18 | 1.60 |
Represented as the average number of peptide sequences with >30% of the highest peptide binding score achievable for each allele
In addition to the prediction of the numbers of binding peptides, to account for the MHC allelic polymorphism present in the population under study, the MHC Class II binding peptide prediction score was corrected by the MHC Class II allele frequency of the Xhosa population (18). The correction was performed by multiplying the peptide prediction score for each allele by its allele frequency. The resulting score is referred as the population specific MHC Class II allele frequency adjusted binding peptide score (Supplementary table II). In order to rank and prioritize gene products: the median score attained by each protein was calculated. The median score was then ranked (highest to lowest) and assigned rank numbers 1-100. This population specific MHC Class II binding prediction rank was referred as R(cPP) (Supplementary Table II).
Final Ranking and selection of candidates
The overall qualitative score was calculated by summing the ranks: R(FI), R(NI) and R(cPP). The summed score was in turn ranked (R) from the lowest to highest and the gene with the lowest score was assigned the highest rank (rank 1) for being the best candidate and the highest score with the lowest rank (rank 100), as the worst candidate (Table III).
Table III.
Overall score and ranking
| S.No | Name | Gene name | R(FI) | R(cPP) | R(NI) | Overall Score | R |
|---|---|---|---|---|---|---|---|
| 1 | Rv0140 | Rv0140 | 47 | 71 | 26 | 144 | 46 |
| 2 | Rv0188 | Rv0188 | 76 | 19 | 22 | 117 | 27 |
| 3 | Rv0233 | nrdB | 86 | 42 | 50 | 178 | 73 |
| 4 | Rv0251c | hsp | 16 | 58 | 3 | 77 | 7 |
| 5 | Rv0268c | Rv0268c | 69 | 74 | 67 | 210 | 87 |
| 6 | Rv0327c | cyp135A1 | 65 | 7 | 100 | 172 | 67 |
| 7 | Rv0350 | dnaK | 96 | 36 | 7 | 139 | 40 |
| 8 | Rv0384c | clpB | 63 | 6 | 49 | 118 | 30 |
| 9 | Rv0474 | Rv0474 | 33 | 85 | 10 | 128 | 36 |
| 10 | Rv0520 | Rv0520 | 38 | 80 | 85 | 203 | 82 |
| 11 | Rv0521 | Rv0521 | 99 | 31 | 88 | 218 | 91 |
| 12 | Rv0754 | PE_PGRS11 | 54 | 35 | 80 | 169 | 63 |
| 13 | Rv0766c | cyp123 | 55 | 8 | 57 | 120 | 33 |
| 14 | Rv0767c | Rv0767c | 19 | 48 | 18 | 85 | 10 |
| 15 | Rv0791c | Rv0791c | 56 | 21 | 71 | 148 | 49 |
| 16 | Rv0793 | Rv0793 | 72 | 73 | 89 | 234 | 95 |
| 17 | Rv0826 | Rv0826 | 31 | 9 | 16 | 56 | 1 |
| 18 | Rv0846c | Rv0846c | 30 | 20 | 83 | 133 | 38 |
| 19 | Rv0847 | lpqS | 1 | 63 | 2 | 66 | 3 |
| 20 | Rv0848 | cysK2 | 17 | 38 | 29 | 84 | 9 |
| 21 | Rv0849 | Rv0849 | 83 | 4 | 90 | 177 | 72 |
| 22 | Rv0940c | Rv0940c | 73 | 46 | 55 | 174 | 69 |
| 23 | Rv0967 | Rv0967 | 5 | 72 | 1 | 78 | 8 |
| 24 | Rv0976c | Rv0976c | 51 | 12 | 81 | 144 | 47 |
| 25 | Rv0986 | Rv0986 | 85 | 28 | 92 | 205 | 84 |
| 26 | Rv0990c | Rv0990c | 21 | 40 | 41 | 102 | 16 |
| 27 | Rv0991c | Rv0991c | 2 | 87 | 5 | 94 | 13 |
| 28 | Rv1169c | PE11 | 44 | 82 | 51 | 177 | 70 |
| 29 | Rv1221 | sigE | 70 | 15 | 4 | 89 | 11 |
| 30 | Rv1284 | Rv1284 | 50 | 27 | 82 | 159 | 58 |
| 31 | Rv1285 | cysD | 92 | 26 | 61 | 179 | 74 |
| 32 | Rv1403c | Rv1403c | 20 | 54 | 64 | 138 | 39 |
| 33 | Rv1405c | Rv1405c | 34 | 33 | 36 | 103 | 17 |
| 34 | Rv1471 | trxB1 | 8 | 75 | 31 | 114 | 26 |
| 35 | Rv1587c | Rv1587c | 100 | 32 | 27 | 159 | 57 |
| 36 | Rv1738 | Rv1738 | 4 | 94 | 75 | 173 | 68 |
| 37 | Rv1806 | PE20 | 9 | 64 | 68 | 141 | 43 |
| 38 | Rv1813c | Rv1813c | 18 | 55 | 40 | 113 | 25 |
| 39 | Rv1875 | Rv1875 | 24 | 51 | 32 | 107 | 22 |
| 40 | Rv1909c | furA | 59 | 68 | 78 | 205 | 83 |
| 41 | Rv1954c | Rv1954c | 74 | 52 | 94 | 220 | 93 |
| 42 | Rv1955 | Rv1955 | 10 | 49 | 12 | 71 | 6 |
| 43 | Rv1956 | Rv1956 | 49 | 81 | 24 | 154 | 52 |
| 44 | Rv1957 | Rv1957 | 28 | 16 | 53 | 97 | 15 |
| 45 | Rv1986 | Rv1986 | 53 | 13 | 39 | 105 | 19 |
| 46 | Rv1990c | Rv1990c | 48 | 76 | 48 | 172 | 65 |
| 47 | Rv1994c | Rv1994c | 45 | 83 | 20 | 148 | 48 |
| 48 | Rv1995 | Rv1995 | 98 | 39 | 97 | 234 | 96 |
| 49 | Rv1996 | Rv1996 | 62 | 37 | 91 | 190 | 77 |
| 50 | Rv2007c | fdxA | 80 | 98 | 74 | 252 | 98 |
| 51 | Rv2011c | Rv2011c | 66 | 60 | 56 | 182 | 75 |
| 52 | Rv2012 | Rv2012 | 36 | 67 | 52 | 155 | 55 |
| 53 | Rv2021c | Rv2021c | 87 | 29 | 54 | 170 | 64 |
| 54 | Rv2022c | Rv2022c | 61 | 66 | 76 | 203 | 81 |
| 55 | Rv2025c | Rv2025c | 68 | 10 | 42 | 120 | 32 |
| 56 | Rv2030c | Rv2030c | 60 | 24 | 99 | 183 | 76 |
| 57 | Rv2031c | hspX | 14 | 53 | 72 | 139 | 42 |
| 58 | Rv2032 | acg | 46 | 17 | 96 | 159 | 59 |
| 59 | Rv2034 | Rv2034 | 3 | 92 | 11 | 106 | 20 |
| 60 | Rv2035 | Rv2035 | 23 | 84 | 19 | 126 | 35 |
| 61 | Rv2036 | Rv2036 | 37 | 47 | 58 | 142 | 44 |
| 62 | Rv2050 | Rv2050 | 41 | 95 | 15 | 151 | 50 |
| 63 | Rv2465c | rpiB | 57 | 90 | 45 | 192 | 78 |
| 64 | Rv2466c | Rv2466c | 15 | 43 | 6 | 64 | 2 |
| 65 | Rv2504c | scoA | 75 | 41 | 44 | 160 | 60 |
| 66 | Rv2517c | Rv2517c | 78 | 96 | 21 | 195 | 80 |
| 67 | Rv2558 | Rv2558 | 27 | 44 | 35 | 106 | 21 |
| 68 | Rv2617c | Rv2617c | 88 | 34 | 33 | 155 | 53 |
| 69 | Rv2623 | TB31.7 | 42 | 50 | 77 | 169 | 62 |
| 70 | Rv2626c | Rv2626c | 6 | 65 | 46 | 117 | 29 |
| 71 | Rv2627c | Rv2627c | 40 | 14 | 98 | 152 | 51 |
| 72 | Rv2628 | Rv2628 | 91 | 91 | 79 | 261 | 99 |
| 73 | Rv2642 | Rv2642 | 7 | 77 | 9 | 93 | 12 |
| 74 | Rv2643 | arsC | 25 | 59 | 59 | 143 | 45 |
| 75 | Rv2658c | Rv2658c | 13 | 89 | 70 | 172 | 66 |
| 76 | Rv2659c | Rv2659c | 39 | 22 | 62 | 123 | 34 |
| 77 | Rv2660c | Rv2660c | 89 | 100 | 95 | 284 | 100 |
| 78 | Rv2662 | Rv2662 | 35 | 88 | 84 | 207 | 85 |
| 79 | Rv2663 | Rv2663 | 67 | 79 | 47 | 193 | 79 |
| 80 | Rv2664 | Rv2664 | 71 | 78 | 69 | 218 | 90 |
| 81 | Rv2693c | Rv2693c | 94 | 3 | 34 | 131 | 37 |
| 82 | Rv2694c | Rv2694c | 79 | 69 | 8 | 156 | 56 |
| 83 | Rv2699c | Rv2699c | 77 | 61 | 86 | 224 | 94 |
| 84 | Rv2780 | ald | 90 | 2 | 17 | 109 | 24 |
| 85 | Rv2913c | Rv2913c | 29 | 1 | 73 | 103 | 18 |
| 86 | Rv2962c | Rv2962c | 97 | 25 | 93 | 215 | 88 |
| 87 | Rv2963 | Rv2963 | 52 | 62 | 63 | 177 | 71 |
| 88 | Rv3130c | Rv3130c | 26 | 5 | 87 | 118 | 31 |
| 89 | Rv3131 | Rv3131 | 93 | 23 | 23 | 139 | 41 |
| 90 | Rv3269 | Rv3269 | 64 | 86 | 60 | 210 | 86 |
| 91 | Rv3288c | usfY | 82 | 30 | 43 | 155 | 54 |
| 92 | Rv3290c | lat | 43 | 11 | 13 | 67 | 5 |
| 93 | Rv3334 | Rv3334 | 32 | 57 | 28 | 117 | 28 |
| 94 | Rv3406 | Rv3406 | 11 | 18 | 37 | 66 | 4 |
| 95 | Rv3503c | fdxD | 84 | 93 | 65 | 242 | 97 |
| 96 | Rv3515c | fadD19 | 58 | 45 | 66 | 169 | 61 |
| 97 | Rv3536c | Rv3536c | 22 | 56 | 30 | 108 | 23 |
| 98 | Rv3597c | lsr2 | 95 | 99 | 25 | 219 | 92 |
| 99 | Rv3681c | whiB4 | 81 | 97 | 38 | 216 | 89 |
| 100 | Rv3862c | whiB6 | 12 | 70 | 14 | 96 | 14 |
proteins selected for empirical evaluation are in bold
Overall qualitative score obtained by summing ranks according to Fold induction R(FI), sigA normalized transcript levels R(NI) (Supplementary Table I) and corrected MHC Class II allele frequency in the population R(cPP) (Supplementary Table II).
From this bioinformatic analysis we selected a number of genes for empirical evaluation:
based on the overall prediction score (R) (Table III, highlighted in bold): both high and low ranking candidates were included in order to subsequently relate bioinformatic and empirical hierarchies.
genomic organisation (e.g. predicted operons)
genes that we found by literature search to be also induced in other stress conditions, such as nutrition starvation and heat shock.
Empirical evaluation of EHR proteins
ELISpot was performed using PBMC from a total of 77 persons with active (ATB, n=37) or latent (LTBI, n=40) TB (table I). Due to limitation in availability of cells, the assays were done in two rounds. Three control antigens (ESAT-6, CFP-10 and Acr-1) were used as internal controls in both rounds. Since there was no significant difference in the response to these 3 internal controls between the two rounds of evaluation (Supplementary Figure 2), the results are described together. Immunodominance was assessed both quantitatively (median SFC/106 PBMC) and as frequency of response (considered positive if > 30 SFC/106 PBMC for IFN-γ and >20 SFC/106 PBMC for IL-2). Analysis was performed by both peptide pools and by proteins (calculated as summed response of respective peptide pools per protein) and described as response to proteins unless specified otherwise.
IFN-γ secretion induced by EHR antigens
Each antigen was tested in at least 20 persons with LTBI and 17-20 with ATB. When analysed quantitatively, the highest IFN-γ SFC response in persons with LTBI was to CFP-10 (median 84 SFC/106 PBMC, IQR 36-234), which was higher than most (not all) EHR proteins and Acr-1 (p ≤ 0.034, table IV). The exceptions were 7 EHR proteins (Rv0826, Rv0849, Rv1471, Rv1954c, Rv1955, Rv1957 and Rv2022c) and ESAT-6 (p ≥ 0.06). In persons with ATB, the highest response was to Rv1957 (136 SFC/106 PBMC, IQR 45-328). This was higher than all other EHR proteins and Acr-1 (p ≤ 0.04), with the exception of Rv1954c, CFP-10 and ESAT-6 (p ≥ 0.21). Amongst EHR peptide pools, Rv1955, Rv1471, Rv2022, Rv1954, Rv1284 and Rv0990 induced dominant IFN-γ responses in persons with either latent or active TB; Rv0826c, Rv0849 and Rv2780 were recognised better by those with LTBI. All the other peptide pools evoked moderate levels of IFN-γ SFC response similar to that of Acr-1 or lower (Table IV). No antigen differentiated between clinical groups with the exception of Rv2021 to which responses were low and infrequent. However, when analysed as peptide pools, peptide pools Rv0849-2 and Rv2693-1 were preferentially recognized by persons with latent infection (14 SFC/million PBMC, IQR 1-23 in LTBI vs 0 SFC/million PBMC, IQR 0-11 in ATB; p=0.04 and 16 SFC/million PBMC, IQR 5-65 vs 6 SFC/million PBMC, IQR 0-12; p=0.04 respectively, Figure 1).
Table IV.
Summary of quantitative and frequency of response of EHR antigens including Acr1, CFP-10 and ESAT-6
| Medians (SFC/106 PBMC) (IQR) | Proportion of responders | |||||||||||
|---|---|---|---|---|---|---|---|---|---|---|---|---|
| IFN-γ | IL-2 | IFN-γ | IL-2 | |||||||||
| Latent | Active | p | Latent | Active | Latent | Active | p | Latent | Active | p | ||
| Acr-1 | 16 (4-40) | 12 (0-70) | 0.59 | 8(0-24) | 8 (0-25) | 0.68 | 33 | 38 | 0.64 | 26 | 30 | 0.78 |
| CFP-10 | 84 (37-234) | 124 (26-408) | 0.87 | 64 (8-184) | 20 (0-140) | 0.06 | 78 | 73 | 0.79 | 68 | 52 | 0.28 |
| ESAT-6 | 72 (28-223) | 123 (43-410) | 0.20 | 52 (13-132) | 32 (10-80) | 0.25 | 73 | 78 | 0.60 | 71 | 63 | 0.58 |
| Rv0188 | 4 (0-25) | 6 (0-23) | 0.55 | NA | NA | NA | 20 | 18 | 1.00 | NA | NA | NA |
| Rv0767 c | 7 (1-38) | 5 (0-23) | 0.44 | 0 (0-4) | 0 (0-8) | 0.87 | 30 | 12 | 0.25 | 12 | 0 | 0.49 |
| Rv0826 | 46 (25-130) | 28 (13-46) | 0.15 | 276 (44-669) | 153 (5-575) | 0.42 | 65 | 35 | 0.11 | 86 | 58 | 0.19 |
| Rv0847 | 12 (0-16) | 6 (0-43) | 0.80 | 0 (0-4) | 0 (0-12) | 0.49 | 10 | 35 | 0.13 | 8 | 0 | 1.00 |
| Rv0849 | 54 (15-76) | 22 (12-68) | 0.19 | 0 (0-7) | 12 (1-44) | 0.05 | 70 | 35 | 0.06 | 14 | 33 | 0.37 |
| Rv0967 | 20 (4-125) | 14 (5-58) | 0.41 | 0 (0-5) | 5 (0-9) | 0.15 | 45 | 30 | 0.51 | 14 | 17 | 1.00 |
| Rv0990c | 32 (4-192 | 46 (11-85) | 0.77 | 5 ( 0-40) | 11 (0-40) | 0.74 | 55 | 59 | 1.00 | 29 | 40 | 0.71 |
| Rv0991c | 12 (4-32) | 4 (0-16) | 0.09 | 0 (0-105) | 0 (0-4) | 0.78 | 30 | 10 | 0.24 | 21 | 8 | 0.60 |
| Rv1284 | 57 (11-286) | 80 (14-168) | 0.89 | 20 (0-53) | 27 (16-52) | 0.34 | 60 | 59 | 1.00 | 53 | 73 | 0.29 |
| Rv1471 | 66 (17-188) | 75 (11-245) | 0.84 | 4 (0-8) | 10 (0-25) | 0.18 | 75 | 59 | 0.48 | 12 | 33 | 0.21 |
| Rv1954c | 60 (20-470) | 72 (27-210) | 0.89 | 4 (0-86) | 10 (0-30) | 0.89 | 70 | 76 | 0.72 | 41 | 33 | 0.73 |
| Rv1955 | 68 (25-367) | 60 (6-151) | 0.29 | 8 (0-104) | 15 (0-32) | 0.63 | 75 | 71 | 1.00 | 47 | 47 | 1.00 |
| Rv1956 | 12 (6-38) | 16 (5-75) | 0.98 | 0 (0-8) | 0 (0-12) | 0.85 | 30 | 35 | 1.00 | 18 | 20 | 1.00 |
| Rv1957 | 48 (18-454) | 136 (45-328) | 0.41 | 0 (0-18) | 5 (0-10) | 0.54 | 65 | 88 | 0.14 | 24 | 20 | 1.00 |
| Rv2021c | 0 (0-7) | 0 (0-0) | 0.02 | Not tested | Not tested | NA | 15 | 0 | 0.23 | NA | NA | NA |
| Rv2022c | 64 (29-228) | 65 (29-124) | 0.66 | 8 (0-30) | 6 (0-15) | 0.58 | 75 | 76 | 1.00 | 29 | 13 | 0.40 |
| Rv2466c | 15 (1-51) | 40 (6-71) | 0.18 | 12 (2-28) | 20 (15-29) | 0.16 | 30 | 53 | 0.19 | 35 | 53 | 0.48 |
| Rv2517c | 4 (0-12) | 0 (0-4) | 0.12 | 0 ( 0-12) | 2 (0-7) | 0.77 | 10 | 10 | 1.00 | 0 | 8 | 0.46 |
| Rv2660c | 14 (1-40) | 6 (0-25) | 0.34 | 0 (0-5) | 4 (0-11) | 0.30 | 30 | 20 | 0.72 | 7 | 8 | 1.00 |
| Rv2662 | 0 (0-0) | 0 (0-0) | 0.91 | Not tested | Not tested | NA | 0 | 0 | NA | NA | NA | NA |
| Rv2663 | 0 (0-0) | 0 (0-0) | 0.84 | Not tested | Not tested | NA | 0 | 0 | NA | NA | NA | NA |
| Rv2664 | 0 (0-0) | 0 (0-0) | 0.35 | Not tested | Not tested | NA | 0 | 0 | NA | NA | NA | NA |
| Rv2693c | 28 (9-102) | 16 (1-56) | 0.16 | 0 (0-4) | 0 (0-10) | 0.72 | 50 | 35 | 0.52 | 7 | 17 | 0.58 |
| Rv2780 | 46 (16-110) | 24 (5-101) | 0.87 | 114 (9-761) | 26 (0-319) | 0.20 | 60 | 45 | 0.53 | 71 | 58 | 0.68 |
| Rv3334 | 0 (0-0) | 0 (0-0) | 0.85 | 0 (0-2) | 0 (0-0) | 0.79 | 5 | 12 | 0.58 | 6 | 0 | 1.00 |
| Rv3406 | 21 (6-290) | 29 (0-106) | 0.59 | 0 (0-2) | 0 (0-10) | 0.36 | 40 | 47 | 0.75 | 12 | 13 | 1.00 |
Figure 1. Interferon-gamma analysis of peptide pools that are preferentially recognized in LTBI.
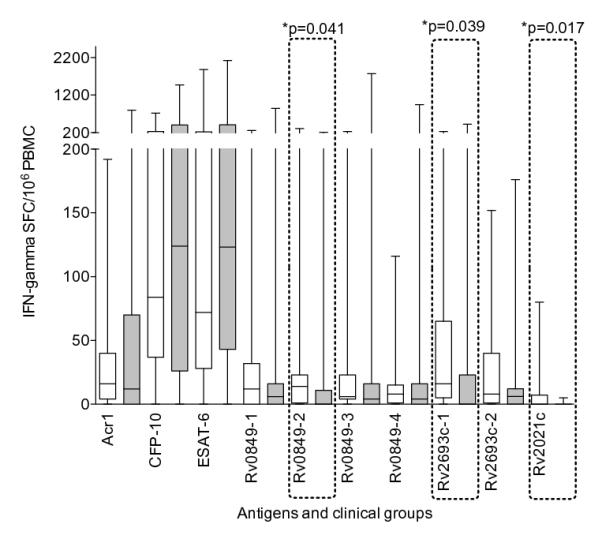
Spot forming cells (SFC) in patients with latent (clear) and active (shaded) TB are shown as Box and whiskers (minimum to maximum, with median and IQR). The strongest response in LTBI was to CFP-10. With the exception of ESAT-6 all other responses were significantly lower (p ≤ 0.007). The strongest response in active disease was to ESAT-6. With the exception of CFP-10 all other responses were significantly lower (p ≤ 0.002). Peptide pool Rv0849-2, Rv2693-1 and Rv2021c were preferentially recognised by latently infected persons (p = 0.04, p=0.039 and p=0.02 respectively). However, the magnitude of the response was low and when analysed by the frequency of response, there was no significant difference.
When analysed by the frequency of response, the highest response in those with latent and active TB was to CFP-10 (78%) and Rv1957 (88%) respectively. Rv1954, Rv1955 and Rv2022 were recognized at a similar frequency (>70%) as CFP-10 and ESAT-6 in both latent and active TB, while Rv0849 (70%) only in those with LTBI. Rv0826, Rv0990, Rv1284 and Rv1471 were recognized by >50% of both LTBI and ATB. Rv2693 and Rv2780 was recognised only by LTBI and Rv2466 only by ATB respectively. All other antigens were recognized similarly to Acr-1 or lower (Table IV) and no response to any antigen significantly differentiated between LTBI or ATB groups.
IL-2 secretion induced by EHR antigens
IL-2 ELISpot was performed using PBMC from the same persons (as above) when cell numbers permitted (31 LTBI and 27 ATB). We encountered non-specific activation of the ALP-substrate complex with a subset of peptide pools (data not shown) leading to results that could not therefore be analysed. IL-2 responses were generally of lower magnitude both quantitatively and by frequency of response (Table IV). Rv0826c was the strongest stimulus of the IL-2 response in both LTBI and ATB (median 276 SFC/106 PBMC, IQR 44-669 and 153 SFC/106 PBMC, IQR 5-575 respectively): these responses were dominant over both CFP-10 (64 SFC/106 PBMC, IQR 8-184 in LTBI and 20 SFC/106 PBMC, IQR 0-140 in ATB and ESAT-6 52 SFC/106 PBMC, IQR 13-132 in LTBI and 32 SFC/106 PBMC, IQR 10-80, p≤0.04). Rv2780 had a dominant response in LTBI (114 SFC/106 PBMC, IQR 9-761) and the response was significantly higher than ESAT-6 (p=0.01). All other antigens induced modest levels of IL-2, similar to that induced by Acr-1 or lower (Table IV). There was no significant difference between the two clinical groups for any antigen. When analysed by the frequency of response, Rv0826 was the most frequently recognized amongst LTBI (85%) and Rv1284 amongst ATB (73%) patients. However no antigen was preferentially recognised by either clinical group.
Responses of adjacent gene products: Rv1954c-Rv1957
Of particular interest was the response to four adjacent genes: Rv1954-Rv1957 a region that contains an toxin-antitoxin module. The IFN-γ responses to these antigens, with the exception of Rv1956, were similar in magnitude and frequency of recognition to CFP-10 and ESAT-6. Rv1957 was in fact recognized at greater frequency than either CFP-10 or ESAT-6 (Figure 2). By contrast the IL-2 responses to Rv1954-1957 were very moderate (Table IV).
Figure 2. IFN-γ ELISpot response to peptides of Rv1954c, Rv1955, Rv1956 and Rv1957.

4 adjacent genes amongst the highly induced EHR genes were evaluated. Since there was no significant difference between active and LTBI, we combined the response of the two clinical groups for further analysis and compared it with the response of our control antigens Acr-1, CFP-10 and ESAT-6. IFN-γ spot forming cells (SFC) in combined patient group (latent and active disease) are represented as Box and whiskers (minimum to maximum, with median and IQR). The strongest response in the combined group was to ESAT-6. The response to Rv1954, Rv1955 and Rv1957 was of similar magnitude to that of CFP-10 and ESAT-6. Figure shows IFN-γ spot forming cells (SFC) in combined patient group (latent and active disease) represented as Box and whiskers (minimum to maximum, with median and IQR). The frequency of recognition by IFN-γ response is described for each antigen.
Influence of differing peptide sequences within the same molecule on the phenotype of T cell response
Rv0826c, a relatively large molecule of 351 amino-acids, was divided into 3 peptide pools for empirical testing. There was no difference in the IFN-γ or IL-2 responses between LTBI and ATB groups (Figure 3). Pools 1 and 2 (covering the amino-acid regions 1-120 and 111-240) were moderate inducers of an IFN-γ response, of similar order of magnitude as the Acr-1 response (10 SFC/106 PBMC, IQR 4-46 for pool 1 and 16 SFC/106 PBMC, IQR 4-32 for pool 2 in LTBI; 10 SFC/106 PBMC, IQR 0-27 for pool 1 and 10 SFC/106 PBMC, IQR 0-28 for pool 2 in ATB). However, pool 3 (residues 231-350) induced significantly lower IFN-γ when compared to pool 1 and 2 (p≤0.008) (Figure 3A). By contrast, peptide pools 1 and 2 induced a low IL-2 response, while peptide pool 3 (254 SFC/106 PBMC, IQR 30-641 in LTBI and 152 SFC/106 PBMC, IQR 0-549 in ATB) induced a strong IL-2 response that was significantly greater than both pools 1 and 2 and Acr-1 (p ≤ 0.007). The level of IL-2 also showed a trend towards being higher than the response to CFP-10 and ESAT-6 (p≤0.07) (Figure 3B).
Figure 3. Influence of differing peptide sequences within the same molecule on the phenotype of T cell response.

The IFN-γ (Panel A) (n=40) and IL-2 (Panel B) (n=27) response (median SFC response with IQR) to 3 pools of Rv0826 is shown. There was no significant difference between ATB (shaded) and LTBI (clear) groups. Blue and red spots represent LTBI and ATB respectively. Pools 1 and 2 of Rv0826 were moderate stimulants of the Interferon-gamma response that was of similar order of magnitude to Acr1. By contrast peptide pools 1 and 2 poorly stimulated an IL-2 response but the C-terminal peptides were dominant for the IL-2 response even over CFP-10 and ESAT-6. The frequencies of IFN-γ producing T cell for the peptide pools illustrated were not statistically different between active and latent TB patients.
Reconciliation of bioinformatic prediction with empirical findings
We next compared the hierarchies of immunodominance based on both quantitative (Median SFC) and frequency of response (>30 SFC/106 PBMC) with hierarchies based on bioinformatic prediction. Only IFN-γ ELISpot results were used for this analysis, as it formed the most complete data set. The median SFC and frequency of response to EHR proteins was ranked from 1-26 per clinical group (LTBI and ATB). Since there was no significant difference in the responses between the two groups, an average rank was calculated for each protein (Table V; Figure 4). For hierarchies of informatic prediction, existing ranks were extracted from the rank list: R(FI) ,R(NI) and R(cPP); and re-assigned (adjusted) ranks (iR(FI) ,iR(NI) and iR(cPP)) between 1-26 for every category. Adjusted ranks, with combinations (as shown in Table V) were used to test the correlation between informatic prediction and empirical findings. The non parametric Spearman correlation was used to test the correlation between empirical ranks (Median and proportion of responders) against informatic ranks (individual and combination ranks) of iR(FI) ,iR(NI) and iR(cPP) (Table V).
Table V.
Ranks of Empirical and Informatic analysis
|
(a)Rank by Median* |
(b) Rank by Frequency of response * |
(c)iR(FI) | (d)iR(NI) | (e)iR(cPP) |
(f)iR(FI)+ iR(cPP) |
(g)iR(NI)+ iR(cPP) |
|
|---|---|---|---|---|---|---|---|
| Rv0188 | 20 | 20 | 20 | 10 | 7 | 15 | 5 |
| Rv0767c | 19 | 18 | 8 | 8 | 12 | 8 | 10 |
| Rv0826 | 10 | 10 | 11 | 6 | 4 | 2 | 2 |
| Rv0847 | 17 | 17 | 1 | 2 | 16 | 4 | 6 |
| Rv0849 | 9 | 9 | 22 | 24 | 3 | 12 | 14 |
| Rv0967 | 13 | 14 | 3 | 1 | 18 | 9 | 8 |
| Rv0990c | 8 | 7 | 9 | 16 | 10 | 7 | 12 |
| Rv0991c | 18 | 19 | 2 | 3 | 23 | 13 | 13 |
| Rv1284 | 6 | 6 | 15 | 22 | 8 | 10 | 17 |
| Rv1471 | 3 | 5 | 4 | 13 | 19 | 11 | 18 |
| Rv1954c | 2 | 3 | 19 | 25 | 14 | 19 | 23 |
| Rv1955 | 5 | 4 | 5 | 5 | 13 | 6 | 7 |
| Rv1956 | 15 | 15 | 14 | 11 | 22 | 21 | 19 |
| Rv1957 | 1 | 2 | 10 | 18 | 6 | 3 | 11 |
| Rv2021c | 23 | 23 | 23 | 19 | 9 | 18 | 16 |
| Rv2022c | 4 | 1 | 16 | 21 | 17 | 20 | 21 |
| Rv2466c | 14 | 13 | 7 | 4 | 11 | 5 | 3 |
| Rv2517c | 21 | 21 | 21 | 9 | 25 | 25 | 20 |
| Rv2660c | 16 | 16 | 24 | 26 | 26 | 26 | 26 |
| Rv2662 | 24 | 24 | 13 | 23 | 24 | 22 | 25 |
| Rv2663 | 25 | 25 | 17 | 17 | 21 | 24 | 22 |
| Rv2664 | 26 | 26 | 18 | 20 | 20 | 23 | 24 |
| Rv2693c | 12 | 12 | 26 | 14 | 2 | 17 | 4 |
| Rv2780 | 7 | 8 | 25 | 7 | 1 | 14 | 1 |
| Rv3334 | 22 | 22 | 12 | 12 | 15 | 16 | 15 |
| Rv3406 | 11 | 11 | 6 | 15 | 5 | 1 | 9 |
There was no significant difference observed in the IFN-γ response between active and latent TB. Therefore, those with latent and active TB were combined for this analysis.
Hierarchy defined by the Median IFN-γ ELISpot response. IFN-γ median SFC/ 106 PMBC responses of all the proteins were ranked. The ranks ranged from 1 to 26 (highest response to lowest response).
Hierarchy defined by Frequency of response. IFN-γ Frequency of response (defined as >30 SFC/ 106 PBMC of IFN-γ ) of all the proteins were ranked. The ranks ranged from 1 to 26 (highest response to lowest response).
Hierarchy defined by Fold induction of EHR proteins (iR(FI)). The ranks from R(FI) were extracted and re-assigned as per hierarchy of informtics as referred as iR(FI)
Hierarchy defined by sigA normalized transcript levels of EHR proteins (iR(NI)). The ranks from R(NI) were extracted and re-assigned as per hierarchy of informtics as referred as iR(NI)
Hierarchy defined by population specific MHCII binding peptide prediction (iR(cPP)). The ranks from R(cPP) were extracted and re-assigned as per hierarchy of informtics as referred as iR(cPP)
Hierarchy defined by combined score: iR(FI)+ iR(cPP). Hierarchy defined by Fold induction of EHR proteins (iR(FI)) was complemented with hierarchy of population specific MHCII binding peptide prediction(iR(cPP)).
Hierarchy defined by combined score: iR(NI)+ iR(cPP). Hierarchy defined by sigA normalized transcript levels of EHR proteins (iR(NI)) was complemented with hierarchy of population specific MHCII binding peptide prediction (iR(cPP)).
Figure 4. Hierarchy of Immunodominance amongst EHR antigens.

Panel A shows hierarchies of immunodominance by quantitative response (median SFC/106 PBMC of IFN-γ). Bars indicate median response. Panel B shows hierarchies of immunodominance by frequency of recognition (>30 SFC/106 PBMC of IFN-γ). Bars indicate frequency of recognition.
When empirical ranking was correlated with bioinformatic prediction, there was no correlation of ranks based on fold induction (iR(FI); r=0.1; p=0.5); normalised intensity (iR(NI); r=-0.1;p=0.7); or combined ranks of normalised intensity and population specific MHC-peptide binding prediction (iR(NI) + iR(cPP); r=0.2;p=0.23). However a significant correlation was found for the combined fold induction and population specific MHC-binding peptide (iR(FI) + iR(cPP); r=0.5; p=0.02, Table VI).
Table VI.
Correlation of Empirical and informatic prediction
| Rank by Median | Rank by Proportion of response | |||||
|---|---|---|---|---|---|---|
| Parameter | Spearman r | P value | Summary | Spearman r | P value | Summary |
| iR(FI) | 0.14 | 0.49 | ns | 0.14 | 0.51 | ns |
| iR(NI) | −0.09 | 0.67 | ns | −0.10 | 0.63 | ns |
| iR(FI)+ iR(cPP) | 0.47 | 0.01 | * | 0.47 | 0.02 | * |
| iR(NI)+ iR(cPP) | 0.24 | 0.23 | ns | 0.24 | 0.24 | ns |
Discussion
We have described novel immunodominant T cell antigens induced during the enduring hypoxic response of M. tuberculosis by a combined approach of bioinformatic prediction algorithms and empirical evaluation. Ten proteins induced an IFN-γ response in PBMC from greater than 50% of persons with active or latent TB. Five novel proteins (Rv1957, Rv1954c, Rv1955, Rv2022c and Rv1471) showed responses similar in both magnitude and frequency to the recognised immunodominant CFP-10 and ESAT-6 molecules.
Based on the discovery of ~230 genes that were significantly induced at four and seven days of hypoxia, but not at the initial time points the enduring hypoxic response of Mycobacterium tuberculosis was defined (7). The first and widely adaptable hypothesis we were interested to test was: when faced with the genomic data from a pathogen, can antigens be predicted? We therefore designed a bioinformatic approach that analysed the available genomic data using in silico tools to search for promising proteins with epitopes that were predicted to bind to MHC-class II molecules, and coupled that with in vitro screening of shortlisted candidate antigens. Our approach was not confined to only the predicted binding region of proteins. Instead we developed a protocol for scoring and ranking the prediction and prioritization for the gene products (Tables 1,2). We also complemented our prediction algorithm with correction for MHC allelic polymorphisms that exist among human populations (18) (Table II). As empirical screening of 100 novel candidates would have been a considerable undertaking, we selected antigens for in vitro screening based not only on the predicted MHC-class II–peptide binding, but also combining the hierarchies of transcriptomic data and the absolute abundance of each transcripts.
In silico tools offer an attractive alternative to the cumbersome empirical evaluation of potential T-cell epitopes. However, studies have confirmed that in silico methods cannot be wholly relied on for selecting crucial peptides for development of vaccines (20, 21). We selected ProPred because of its user-friendly interface, availability of all 51 HLA DR alleles (16), previous experimental evaluation (20, 21) in antigen discovery for MTB (22, 23) and Plasmodium vivax (24). However we did not use the algorithm to predict epitope per se. Instead we used it as a guide to provide insight into which molecules may contain epitopes and in what number. We then reconciled our prediction algorithm with the empirical analysis to test its accuracy. Our bioinformatic approach shows that genomic knowledge can aid antigen discovery to some extent when it is complemented with population specific MHC-class II-peptide prediction analysis.
The second, and more specific hypothesis we tested was whether, by virtue of up regulation during prolonged hypoxia, these genes may be expressed in vivo and could thereby be targets of the immune response; moreover, they would represent antigens preferentially recognised by latently infected persons. With the exception of modest IFN-γ response to the peptide pools of Rv0849-2 and Rv2693-1, and a very low response to Rv2021c showing a trend towards preferential recognition in LTBI, this was not the case (Figure 1). This suggests overlap in antigenic recognition in both active and latent tuberculosis. A wider range of cytokine biomarkers may have been more discriminatory. Our findings however revealed that a number of genes induced by hypoxia were indeed potent T-cell targets and therefore offer general support to the hypoxia hypothesis and its relevance during the natural history of MTB infection. We have also described interesting, immunologically potent T cell targets, which are prospective candidates for further evaluation. However, our findings do not support the hypothesis that these antigens are preferentially recognised in patients with LTBI, and instead provides support for an overlapping spectrum of immunological response between those with LTBI and active TB disease (8).
DosR regulated genes, induced during the initial transient hypoxic response have been evaluated for human T cell responses and the term “latency antigen” has been introduced (14). Acr-1 (Rv2031c), a DosR regulated antigen has been well characterized for B and T cell recognition (25, 26) and preferential T cell recognition in those with LTBI has sometimes been described (15, 25, 27). Acr-1 also forms part of the enduring hypoxic response. Therefore to benchmark the ability of EHR antigens to induce an immune response, we included Acr1 in our in vitro analysis, along with ESAT-6 and CFP-10 whose immunodominance is widely documented. Although, we found many EHR antigens with magnitude and frequency of response higher or similar to that of Acr-1, these were lower than that to ESAT-6 and CFP-10. We did not find Acr-1 responses in this population to be preferentially recognised by the latently infected, in line with other studies (14, 28). It has also been suggested that a quantitatively higher IFN-γ response to the RD-1 encoded CFP-10 and ESAT-6 antigens is associated with active disease (29-31), attributed to the secretion of these proteins by actively replicating bacilli. Our data did not show a higher response to ESAT-6 and CFP-10 in active TB compared to LTBI in this population. This difference might be due to the high TB incidence in the environment in which this study was conducted (29), where patients with LTBI may be continuously re-exposed and infected thereby driving a response as high as that seen in active disease. It is also interesting to note that whilst the transcriptomic data showed a fold decrease in ESAT-6 and CFP-10 during hypoxia, the absolute abundance of these transcripts remained high (Supplementary Figure 1). Expression of ESAT-6 and CFP-10 under a variety of conditions is in agreement with other in vitro expression data (6, 32) and adds to those suggesting these molecules may play a role in bacillary persistence as well as active infection (33).
This is the first evaluation of the ability of EHR genes to induce a human T cell response. Five immunodominant candidates (Rv1957, Rv2022c, Rv1954c, Rv1955 and Rv1471) induced a frequency of IFN-γ response >70% and similar to that of ESAT-10 and CFP-10 irrespective of clinical group. It is also of interest that, with the exception of Rv1471, these proteins do not have homologues outside the M. tuberculosis complex (data not shown). Therefore a response to these proteins is less likely to arise because of exposure or infection by environmental or non-tuberculous mycobacteria. Rv1955-Rv1956 encode a possible Toxin-antitoxin (TA) module (34, 35), one of at least 38 such loci in MTB (34, 36, 37). Studies have shown that Rv1955, Rv1956 and Rv1957 are co-regulated (38). Previous reports suggests that these loci provide a control mechanism that helps to cope with nutritional stress (37), such as hypoxia. Rv1957 is a SecB-like chaperone specifically controls this stress-responsive TA system relevant for M. tuberculosis adaptive response (39). Schuck and colleagues have also described another protein Rv3407, which also forms part of the TA module, to be preferentially recognised by T cells of those with latent TB infection (40). Our findings support the idea that certain TA proteins may act as antigens.
Since IFN-γ secretion is a imperfect correlate of protection (41), we included IL-2 ELISpot in our analysis as its secretion may better mark immunological memory (30, 41-43). While we observed a range of IFN-γ response to the antigens tested with in vitro screening, the IL-2 response was more focused, as observed by others (30). The magnitude of IL-2 response to RD-1 encoded antigens was lower compared to the IFN-γ response. Apart from 3 EHR antigens which induced an IL-2 response similar in magnitude and frequency to ESAT-6 and CFP-10, all others were of lower magnitude and similar to that of Acr-1. We hypothesize this may be influenced by the overall affinity of interaction between TcR, peptide and MHC class II molecule.
Overall, our findings support the hypothesis that it is possible to predict antigens using genomic data, provided combinations are taken into account. This approach may be applicable to other pathogens. We have identified novel immunodominant molecules that could potentially be further characterised, to better understand the mechanism and importance of hypoxia in vivo. However, our data do not provide support for the hypothesis that a differential pattern of immune response is associated with latency as antigens that are targets of the immune response in latent infection were most often targets in active disease and vice versa. This is consistent with the emerging view of TB as a spectrum of infection rather than arbitrary division into active and latent forms (44). General support for the importance of hypoxia in vivo does however come from the fact that so many of the EHR genes encode potent T cell antigens.
Supplementary Material
Acknowledgements
We wish to thank Dr Virginia De Azevedo, Dr Shahied Mathee and all staff at the Ubuntu Clinic for assistance in recruiting patients to the study.
Footnotes
This work was supported by a joint Bill and Melinda Gates Foundation/Wellcome Trust Grand Challenges in Global Health award (reference 37882). Additional support came from Wellcome Trust awards RJW (084670, 084323, 088316) and by the European Union (Sante/2006/105-061) and EDCTP (IP.07.32080.002). KAW, DBY and RJW also receive programme support from the Medical Research Council of the United Kingdom (U.1175.02.002.00014.01). HPG received a bursary from the Lutheran World Federation and the University of Cape Town. HMV is funded by the Department for Environmental, Food & Rural Affairs, UK. The funding agencies had no part in the decision to publish this work and opinions are those of the authors, not the funding bodies.
References
- 1.World Health Organisation, G . Global Tuberculosis control. World Health Organisation; Geneva: 2011. p. 258. [Google Scholar]
- 2.Maartens G, Wilkinson RJ. Tuberculosis. Lancet. 2007;370:2030–2043. doi: 10.1016/S0140-6736(07)61262-8. [DOI] [PubMed] [Google Scholar]
- 3.Berthet FX, Rasmussen PB, Rosenkrands I, Andersen P, Gicquel B. A Mycobacterium tuberculosis operon encoding ESAT-6 and a novel low-molecular-mass culture filtrate protein (CFP-10) Microbiology. 1998;144:3195–3203. doi: 10.1099/00221287-144-11-3195. [DOI] [PubMed] [Google Scholar]
- 4.Sorensen AL, Nagai S, Houen G, Andersen P, Andersen AB. Purification and characterization of a low-molecular-mass T-cell antigen secreted by Mycobacterium tuberculosis. Infect Immun. 1995;63:1710–1717. doi: 10.1128/iai.63.5.1710-1717.1995. [DOI] [PMC free article] [PubMed] [Google Scholar]
- 5.Rangaka MX, Wilkinson KA, Glynn JR, Ling D, Menzies D, Mwansa-Kambafwile J, Fielding K, Wilkinson RJ, Pai M. Predictive value of interferon-gamma release assays for incident active tuberculosis: a systematic review and meta-analysis. The Lancet infectious diseases. 2012;12:45–55. doi: 10.1016/S1473-3099(11)70210-9. [DOI] [PMC free article] [PubMed] [Google Scholar]
- 6.Sidders B, Pirson C, Hogarth PJ, Hewinson RG, Stoker NG, Vordermeier HM, Ewer K. Screening of highly expressed mycobacterial genes identifies Rv3615c as a useful differential diagnostic antigen for the Mycobacterium tuberculosis complex. Infect Immun. 2008;76:3932–3939. doi: 10.1128/IAI.00150-08. [DOI] [PMC free article] [PubMed] [Google Scholar]
- 7.Rustad TR, Harrell MI, Liao R, Sherman DR. The enduring hypoxic response of Mycobacterium tuberculosis. PLoS ONE. 2008;3:e1502. doi: 10.1371/journal.pone.0001502. [DOI] [PMC free article] [PubMed] [Google Scholar]
- 8.Barry CE, 3rd, Boshoff HI, Dartois V, Dick T, Ehrt S, Flynn J, Schnappinger D, Wilkinson RJ, Young D. The spectrum of latent tuberculosis: rethinking the biology and intervention strategies. Nat Rev Microbiol. 2009;7:845–855. doi: 10.1038/nrmicro2236. [DOI] [PMC free article] [PubMed] [Google Scholar]
- 9.Timm J, Post FA, Bekker LG, Walther GB, Wainwright HC, Manganelli R, Chan WT, Tsenova L, Gold B, Smith I, Kaplan G, McKinney JD. Differential expression of iron-, carbon-, and oxygen-responsive mycobacterial genes in the lungs of chronically infected mice and tuberculosis patients. Proc Natl Acad Sci U S A. 2003;100:14321–14326. doi: 10.1073/pnas.2436197100. [DOI] [PMC free article] [PubMed] [Google Scholar]
- 10.Shi L, Jung YJ, Tyagi S, Gennaro ML, North RJ. Expression of Th1-mediated immunity in mouse lungs induces a Mycobacterium tuberculosis transcription pattern characteristic of nonreplicating persistence. Proc Natl Acad Sci U S A. 2003;100:241–246. doi: 10.1073/pnas.0136863100. [DOI] [PMC free article] [PubMed] [Google Scholar]
- 11.Schnappinger D, Ehrt S, Voskuil MI, Liu Y, Mangan JA, Monahan IM, Dolganov G, Efron B, Butcher PD, Nathan C, Schoolnik GK. Transcriptional Adaptation of Mycobacterium tuberculosis within Macrophages: Insights into the Phagosomal Environment. J Exp Med. 2003;198:693–704. doi: 10.1084/jem.20030846. [DOI] [PMC free article] [PubMed] [Google Scholar]
- 12.Black GF, Thiel BA, Ota MO, Parida SK, Adegbola R, Boom WH, Dockrell HM, Franken KL, Friggen AH, Hill PC, Klein MR, Lalor MK, Mayanja H, Schoolnik G, Stanley K, Weldingh K, Kaufmann SH, Walzl G, Ottenhoff TH. Immunogenicity of novel DosR regulon-encoded candidate antigens of Mycobacterium tuberculosis in three high-burden populations in Africa. Clin Vaccine Immunol. 2009;16:1203–1212. doi: 10.1128/CVI.00111-09. [DOI] [PMC free article] [PubMed] [Google Scholar]
- 13.Roupie V, Romano M, Zhang L, Korf H, Lin MY, Franken KL, Ottenhoff TH, Klein MR, Huygen K. Immunogenicity of eight dormancy regulon-encoded proteins of Mycobacterium tuberculosis in DNA-vaccinated and tuberculosis-infected mice. Infect Immun. 2007;75:941–949. doi: 10.1128/IAI.01137-06. [DOI] [PMC free article] [PubMed] [Google Scholar]
- 14.Leyten EM, Lin MY, Franken KL, Friggen AH, Prins C, van Meijgaarden KE, Voskuil MI, Weldingh K, Andersen P, Schoolnik GK, Arend SM, Ottenhoff TH, Klein MR. Human T-cell responses to 25 novel antigens encoded by genes of the dormancy regulon of Mycobacterium tuberculosis. Microbes Infect. 2006;8:2052–2060. doi: 10.1016/j.micinf.2006.03.018. [DOI] [PubMed] [Google Scholar]
- 15.Demissie A, Leyten EM, Abebe M, Wassie L, Aseffa A, Abate G, Fletcher H, Owiafe P, Hill PC, Brookes R, Rook G, Zumla A, Arend SM, Klein M, Ottenhoff TH, Andersen P, Doherty TM. Recognition of Stage-Specific Mycobacterial Antigens Differentiates between Acute and Latent Infections with Mycobacterium tuberculosis. Clin Vaccine Immunol. 2006;13:179–186. doi: 10.1128/CVI.13.2.179-186.2006. [DOI] [PMC free article] [PubMed] [Google Scholar]
- 16.Singh H, Raghava GP. ProPred: prediction of HLA-DR binding sites. Bioinformatics. 2001;17:1236–1237. doi: 10.1093/bioinformatics/17.12.1236. [DOI] [PubMed] [Google Scholar]
- 17.Sassetti CM, Rubin EJ. Genetic requirements for mycobacterial survival during infection. Proc Natl Acad Sci U S A. 2003;100:12989–12994. doi: 10.1073/pnas.2134250100. [DOI] [PMC free article] [PubMed] [Google Scholar]
- 18.du Toit ED, MacGregor KJ, Taljaard DG, Oudshoorn M. HLA-A, B, C, DR and DQ polymorphisms in three South African population groups: South African Negroes, Cape Coloureds and South African Caucasoids. Tissue antigens. 1988;31:109–125. doi: 10.1111/j.1399-0039.1988.tb02072.x. [DOI] [PubMed] [Google Scholar]
- 19.Gideon HP, Wilkinson KA, Rustad TR, Oni T, Guio H, Kozak RA, Sherman DR, Meintjes G, Behr MA, Vordermeier HM, Young DB, Wilkinson RJ. Hypoxia induces an immunodominant target of tuberculosis specific T cells absent from common BCG vaccines. PLoS Pathog. 2010;6:e1001237. doi: 10.1371/journal.ppat.1001237. [DOI] [PMC free article] [PubMed] [Google Scholar]
- 20.Gowthaman U, Chodisetti SB, Parihar P, Agrewala JN. Evaluation of different generic in silico methods for predicting HLA class I binding peptide vaccine candidates using a reverse approach. Amino Acids. 2010;39:1333–1342. doi: 10.1007/s00726-010-0579-2. [DOI] [PubMed] [Google Scholar]
- 21.Lin HH, Zhang GL, Tongchusak S, Reinherz EL, Brusic V. Evaluation of MHC-II peptide binding prediction servers: applications for vaccine research. BMC Bioinformatics. 2008;9(Suppl 12):S22. doi: 10.1186/1471-2105-9-S12-S22. [DOI] [PMC free article] [PubMed] [Google Scholar]
- 22.Mustafa AS, Shaban FA. ProPred analysis and experimental evaluation of promiscuous T-cell epitopes of three major secreted antigens of Mycobacterium tuberculosis. Tuberculosis. 2006;86:115–124. doi: 10.1016/j.tube.2005.05.001. [DOI] [PubMed] [Google Scholar]
- 23.Vordermeier M, Whelan AO, Hewinson RG. Recognition of mycobacterial epitopes by T cells across mammalian species and use of a program that predicts human HLA-DR binding peptides to predict bovine epitopes. Infect Immun. 2003;71:1980–1987. doi: 10.1128/IAI.71.4.1980-1987.2003. [DOI] [PMC free article] [PubMed] [Google Scholar]
- 24.Lima-Junior JC, Banic DM, Tran TM, Meyer VS, De-Simone SG, Santos F, Porto LC, Marques MT, Moreno A, Barnwell JW, Galinski MR, Oliveira-Ferreira J. Promiscuous T-cell epitopes of Plasmodium merozoite surface protein 9 (PvMSP9) induces IFN-gamma and IL-4 responses in individuals naturally exposed to malaria in the Brazilian Amazon. Vaccine. 2010;28:3185–3191. doi: 10.1016/j.vaccine.2010.02.046. [DOI] [PMC free article] [PubMed] [Google Scholar]
- 25.Wilkinson RJ, Wilkinson KA, De Smet KAL, Haslov K, Pasvol G, Singh M, Svarcova I, Ivanyi J. Human T and B cell reactivity to the 16 kDa alpha crystallin protein of Mycobacterium tuberculosis. Scand J Immunol. 1998;48:403–409. doi: 10.1046/j.1365-3083.1998.00420.x. [DOI] [PubMed] [Google Scholar]
- 26.Wilkinson RJ, Vordermeier HM, Wilkinson KA, Sjölund A, Moreno C, Pasvol G, Ivanyi J. Peptide specific response to M. tuberculosis: clinical spectrum, compartmentalization, and effect of chemotherapy. J Infect Dis. 1998;178:760–768. doi: 10.1086/515336. [DOI] [PubMed] [Google Scholar]
- 27.Geluk A, Lin MY, van Meijgaarden KE, Leyten EM, Franken KL, Ottenhoff TH, Klein MR. T cell recognition of the HspX protein of Mycobacterium tuberculosis correlates with latent M. tuberculosis infection but not BCG vaccination. Infect Immun. 2007;75:2914–2921. doi: 10.1128/IAI.01990-06. [DOI] [PMC free article] [PubMed] [Google Scholar]
- 28.Wilkinson KA, Stewart GR, Newton SM, Vordermeier HM, Wain JR, Murphy HN, Horner K, Young DB, Wilkinson RJ. Infection biology of a novel alpha-crystallin of Mycobacterium tuberculosis: Acr2. J Immunol. 2005;174:4237–4243. doi: 10.4049/jimmunol.174.7.4237. [DOI] [PubMed] [Google Scholar]
- 29.Rangaka MX, Diwakar L, Seldon R, van Cutsem G, Meintjes GA, Morroni C, Mouton P, Shey MS, Maartens G, Wilkinson KA, Wilkinson RJ. Clinical, immunological, and epidemiological importance of antituberculosis T cell responses in HIV-infected Africans. Clin Infect Dis. 2007;44:1639–1646. doi: 10.1086/518234. [DOI] [PubMed] [Google Scholar]
- 30.Millington KA, Innes JA, Hackforth S, Hinks TS, Deeks JJ, Dosanjh DP, Guyot-Revol V, Gunatheesan R, Klenerman P, Lalvani A. Dynamic Relationship between IFN-{gamma} and IL-2 Profile of Mycobacterium tuberculosis-Specific T Cells and Antigen Load. J Immunol. 2007;178:5217–5226. doi: 10.4049/jimmunol.178.8.5217. [DOI] [PMC free article] [PubMed] [Google Scholar]
- 31.Vordermeier HM, Chambers MA, Cockle PJ, Whelan AO, Simmons J, Hewinson RG. Correlation of ESAT-6-specific gamma interferon production with pathology in cattle following Mycobacterium bovis BCG vaccination against experimental bovine tuberculosis. Infect Immun. 2002;70:3026–3032. doi: 10.1128/IAI.70.6.3026-3032.2002. [DOI] [PMC free article] [PubMed] [Google Scholar]
- 32.Boshoff HI, Myers TG, Copp BR, McNeil MR, Wilson MA, Barry CE., 3rd The transcriptional responses of Mycobacterium tuberculosis to inhibitors of metabolism: novel insights into drug mechanisms of action. J Biol Chem. 2004;279:40174–40184. doi: 10.1074/jbc.M406796200. [DOI] [PubMed] [Google Scholar]
- 33.Pym AS, Brodin P, Brosch R, Huerre M, Cole ST. Loss of RD1 contributed to the attenuation of the live tuberculosis vaccines Mycobacterium bovis BCG and Mycobacterium microti. Mol Microbiol. 2002;46:709–717. doi: 10.1046/j.1365-2958.2002.03237.x. [DOI] [PubMed] [Google Scholar]
- 34.Ramage HR, Connolly LE, Cox JS. Comprehensive functional analysis of Mycobacterium tuberculosis toxin-antitoxin systems: implications for pathogenesis, stress responses, and evolution. PLoS genetics. 2009;5:e1000767. doi: 10.1371/journal.pgen.1000767. [DOI] [PMC free article] [PubMed] [Google Scholar]
- 35.Gupta A. Killing activity and rescue function of genome-wide toxin-antitoxin loci of Mycobacterium tuberculosis. FEMS microbiology letters. 2009;290:45–53. doi: 10.1111/j.1574-6968.2008.01400.x. [DOI] [PubMed] [Google Scholar]
- 36.Pandey DP, Gerdes K. Toxin-antitoxin loci are highly abundant in free-living but lost from host-associated prokaryotes. Nucleic acids research. 2005;33:966–976. doi: 10.1093/nar/gki201. [DOI] [PMC free article] [PubMed] [Google Scholar]
- 37.Gerdes K, Christensen SK, Lobner-Olesen A. Prokaryotic toxin-antitoxin stress response loci. Nature reviews. Microbiology. 2005;3:371–382. doi: 10.1038/nrmicro1147. [DOI] [PubMed] [Google Scholar]
- 38.Smollett KL, Fivian-Hughes AS, Smith JE, Chang A, Rao T, Davis EO. Experimental determination of translational start sites resolves uncertainties in genomic open reading frame predictions - application to Mycobacterium tuberculosis. Microbiology. 2009;155:186–197. doi: 10.1099/mic.0.022889-0. [DOI] [PMC free article] [PubMed] [Google Scholar]
- 39.Bordes P, Cirinesi AM, Ummels R, Sala A, Sakr S, Bitter W, Genevaux P. SecB-like chaperone controls a toxin-antitoxin stress-responsive system in Mycobacterium tuberculosis. Proceedings of the National Academy of Sciences of the United States of America. 2011;108:8438–8443. doi: 10.1073/pnas.1101189108. [DOI] [PMC free article] [PubMed] [Google Scholar]
- 40.Schuck SD, Mueller H, Kunitz F, Neher A, Hoffmann H, Franken KL, Repsilber D, Ottenhoff TH, Kaufmann SH, Jacobsen M. Identification of T-cell antigens specific for latent mycobacterium tuberculosis infection. PLoS ONE. 2009;4:e5590. doi: 10.1371/journal.pone.0005590. [DOI] [PMC free article] [PubMed] [Google Scholar]
- 41.Hanekom WA, Dockrell HM, Ottenhoff TH, Doherty TM, Fletcher H, McShane H, Weichold FF, Hoft DF, Parida SK, Fruth UJ. Immunological Outcomes of New Tuberculosis Vaccine Trials: WHO Panel Recommendations. PLoS Med. 2008;5:e145. doi: 10.1371/journal.pmed.0050145. [DOI] [PMC free article] [PubMed] [Google Scholar]
- 42.Soares AP, Scriba TJ, Joseph S, Harbacheuski R, Murray RA, Gelderbloem SJ, Hawkridge A, Hussey GD, Maecker H, Kaplan G, Hanekom WA. Bacillus Calmette-Guerin vaccination of human newborns induces T cells with complex cytokine and phenotypic profiles. J Immunol. 2008;180:3569–3577. doi: 10.4049/jimmunol.180.5.3569. [DOI] [PMC free article] [PubMed] [Google Scholar]
- 43.Hawkridge T, Scriba TJ, Gelderbloem S, Smit E, Tameris M, Moyo S, Lang T, Veldsman A, Hatherill M, Merwe L, Fletcher HA, Mahomed H, Hill AV, Hanekom WA, Hussey GD, McShane H. Safety and immunogenicity of a new tuberculosis vaccine, MVA85A, in healthy adults in South Africa. J Infect Dis. 2008;198:544–552. doi: 10.1086/590185. [DOI] [PMC free article] [PubMed] [Google Scholar]
- 44.Young DB, Gideon HP, Wilkinson RJ. Eliminating latent tuberculosis. Trends Microbiol. 2009;17:183–188. doi: 10.1016/j.tim.2009.02.005. [DOI] [PubMed] [Google Scholar]
Associated Data
This section collects any data citations, data availability statements, or supplementary materials included in this article.