Figure 2.

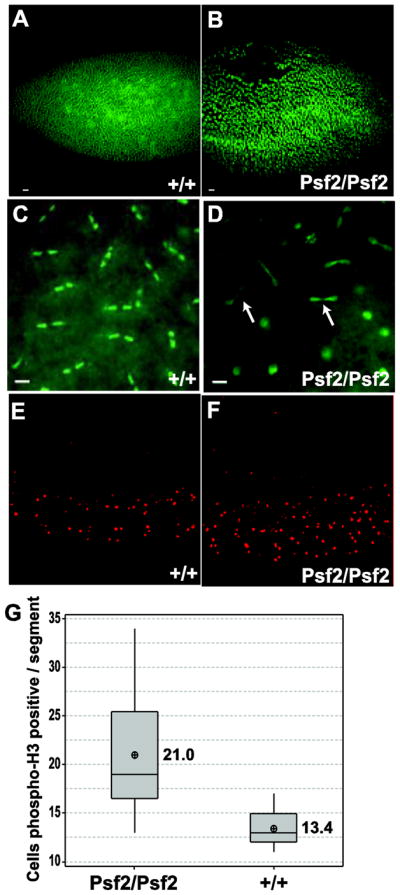
Embryonic phenotypes associated with Psf2 mutation. Early embryo defects in homozygous Psf2 individuals. (B, D) compared to wild-type (A,C) where Psf2/Psf2 embryos show nuclear fallout (B) and cell cycle asynchrony (D) and anaphase bridges (D arrows). (E, F) Representative micrographs of embryos stained for phospho H3, a marker for cells in mitosis. Psf2/Psf2 embryos show a significant (p=0.001) increase in mitotic cells per segment as compared to wild-type (G). Scale bar = 10μm
