

Abstract
Objective
Low-glycemic load diets lower post-prandial glucose and insulin responses; however, the effect of glycemic load on circulating incretin concentrations is unclear. We aimed assess effects of dietary glycemic load on fasting and post-prandial glucose, insulin and incretin (i.e., glucose-dependent insulinotropic polypeptide (GIP) and glucagon-like peptide-1 (GLP-1)) concentrations and to examine for effect modification by adiposity.
Materials and Methods
We conducted a single-center, randomized controlled crossover feeding trial in which a subset of participants had post-prandial testing. Participants were recruited from the local Seattle area. We enrolled 89 overweight-obese (BMI 28.0–39.9 kg/m2) and lean (BMI 18.5–25.0 kg/m2) healthy adults. Participants consumed two 28-day, weight-maintaining high- and low-glycemic load controlled diets in random order. Primary outcome measures were post-prandial circulating concentrations of glucose, insulin, GIP and GLP-1, following a test breakfast.
Results
Of the 80 participants completing both diet interventions, 16 had incretin testing and comprise the group for analyses. Following each 28-day high- and low-glycemic load diet, mean fasting concentrations of insulin, glucose, GIP and GLP-1 were not significantly different. Mean integrated post-prandial concentrations of glucose, insulin and GIP were higher (1504±476 mg/dL/min, p<0.01; 2012±644 µU/mL/min, p<0.01 and 15517±4062 pg/ml/min, p<0.01, respectively) and GLP-1 was lower (−81.6±38.5 pmol/L/min, p<0.03) following the high-glycemic load breakfast as compared to the low-glycemic load breakfast. Body fat did not significantly modify the effect of glycemic load on metabolic outcomes.
Conclusions
High-glycemic load diets in weight-maintained healthy individuals leads to higher post-prandial GIP and lower post-prandial GLP-1 concentrations. Future studies evaluating dietary glycemic load manipulation of incretin effects would be helpful for establishing diabetes nutrition guidelines.
Keywords: glucose-dependent insulinotropic polypeptide (GIP), glucagon-like peptide-1 (GLP-1), glucose, insulin, glycemic index
INTRODUCTION
Reduction in risk for obesity and type 2 diabetes is a major public health goal that calls for appropriate nutritional guidelines. Dietary glycemic index (GI) and glycemic load (GL) characterize post-prandial blood glucose responses expected from a quantified carbohydrate load or meal, respectively. Low-GL diets are associated with lower risk of type 2 diabetes [1–4], have been shown to promote lower insulinemia and glycemia in healthy individuals [5–8], and may promote weight loss [9]. Recently, pharmacological use of glucagon-like peptide-1 (GLP-1) agonists to treat diabetes has afforded patients with moderate weight loss and improved post-prandial glycemic control [10]. Dietary manipulation of the incretin effect is potentially therapeutic, and the effect of GL on incretin function is unclear.
The incretin gut hormones, GLP-1 and glucose-dependent insulinotropic polypeptide (GIP) are gut-derived insulinotropic hormones synthesized and released from intestinal L and K cells in response to nutrient ingestion. Several investigators have proposed that improvements in glycemia and insulinemia, attributable to low GL diets, are perhaps mediated by changes in the incretin axis [11, 12]. To our knowledge, no human study has evaluated immediate post-prandial incretin responses in the context of controlled, weight-maintaining diets varying by glycemic load. The objectives of this study were to assess the effect of high- and low-GL diets on both fasting and post-prandial concentrations of glucose, insulin and incretins and to examine for effect modification by adiposity.
METHODS
Study Population
The study presented here was part of a larger parent study called the Carbohydrates and Related Biomarkers (CARB) study, a single-center, crossover randomized controlled feeding trial comparing the effects of high- versus low- GL diets on biomarkers of cancer risk [13]. We recruited healthy adults from the local Seattle area and made exclusions for personal dietary restrictions, physician-diagnosed conditions or medications that influence metabolism, pregnancy or lactation (or consideration of), use of tobacco or excessive alcohol (equal or greater than 2 bottles of beer, 2 glasses of wine or 3 ounces of hard liquor/day) or fasting glucose greater than 100 mg/dL. Participants meeting these criteria were included if they had a BMI between 18.5 and 25.0 kg/m2 or between 28.0 and 39.9 kg/m2 in order to clearly dichotomize adiposity groups. We asked participants to discontinue use of nutritional supplements prior to the study and to continue usual physical activity. The Institutional Review Board and Clinic Trials Office of the Fred Hutchinson Cancer Research Center (FHCRC) approved the study protocol. All participants gave written, informed consent.
Research Design
We enrolled 89 participants in the parent study between June 2006 and July 2009 and block randomized participants by BMI and sex to order of experimental diets. Allocation sequences were computer-generated. Using a cross-over design, we assigned participants to consume both high- and low-GL diets, each for 28 consecutive days. Between dietary intervention periods, there was a 28-day wash-out period (habitual diet). A subset of participants (a convenience sample of 20 volunteers) consented to be in the ancillary post-prandial study. Post-prandial testing was conducted on the last day of each experimental dietary period. The study provided all food for both dietary periods. Study dietitians and staff prepared meals and beverages in the Human Nutrition Laboratory (HNL) of the FHCRC, where the study was undertaken. We instructed participants to consume only food and beverages provided by the HNL during dietary intervention periods with the exception of ad libitum tea and coffee (whitener and sweetener additives provided by study) permitted at stable, continuous levels. During the week, participants ate dinner at the HNL under supervision by study staff and brought to home all other meals. They returned unconsumed food to the HNL (amounts weighed and recorded), and kept a written log of all food consumed outside of the HNL.
Anthropometry
We measured baseline height, waist and hip circumferences and percentage body fat by whole-body dual-energy X-ray absorptiometry (DXA) scanning, using a GE Lunar DPX (GE Healthcare, Milwaukee, WI). Participants also completed baseline questionnaires for collection of data on sex, race/ethnicity, health history, habitual diet and physical activity. Study staff weighed participants three times per week during the 28-day intervention periods.
Study Diets
We used three-day dietary records and estimates of daily energy needs [Mifflin equation [14]] to predict each participant’s energy needs during feeding periods. We designed diets to represent realistic high- and low-GL diets similar in energy and macronutrient composition (15% energy from protein, 30% energy from fat and 55% energy from carbohydrate) but differing by GL (GL 250 and 125 for high-GL and low-GL diets, respectively). We aimed for the overall daily macronutrient distribution to be identical; the macronutrient of any two meals differed slightly. Further detail regarding both diets has been previously published [13]. Both diets differed in fiber content (fiber content 28 g/day and 55 g/day for high- and low-GL diets, respectively) because higher fiber content is generally found in lower GI foods. In order to maintain a participant’s weight at baseline during each 28-day intervention period, we made dietary energy adjustments in 200 kcal increments as necessary. We designed both test breakfast meals for the post-prandial study to be similar in overall macronutrient content and GL to the high- and low-GL 28-day diets. The high-GL test meal included high-GL buckwheat pancakes, butter, pancake-syrup, a fruit-flavored drink and milk. The low-GL test meal included low-GL and buckwheat groat pancakes, butter, agave syrup, strawberries, tomato juice and milk. We asked participants to consume test meals within 15 minutes.
Sample Collection and Analysis
We obtained blood from fasted participants (12-hour fast) at the end of each 28-day dietary period. Among the 20 participants of the post-prandial study, we obtained blood for incretin testing on 16 participants within 15 minutes of the start of the meal, at time points 15, 45, 60, 90, 120, 180 and 240 minutes after the meal. The first consecutive 4 of 20 post-prandial study participants did not have incretin testing because the post-prandial study was underway when investigators initiated the protocol for incretin testing. We collected and processed the blood according to a standard protocol; for specimens planned for the incretin analysis, we added inhibitor of dipeptidyl peptidase 4 to collection tubes for both GIP and GLP-1 according to the manufacturers’ recommendations. All samples were stored at −80°C until analysis. The assay for serum glucose was performed enzymatically at the Northwest Lipid Research Laboratories (University of Washington), using Roche reagents on a Roche Module P Chemistry autoanalyzer (Roche Diagnostics Inc., Indianapolis, IN). The inter-assay coefficient variation (CV) for high, medium and low glucose level samples were 1.2%, 1.7% and 1.4%, respectively. The assay for serum insulin was performed at the Diabetes Endocrinology Research Center Immunoassay Core Laboratory (University of Washington), and quantified by a two-site immuno-enzymometeric assay using a Tosoh 2000 auto-analyzer (Tosoh Biosciences Inc, South San Francisco, CA). The inter-assay CVs for low, medium and high insulin level controls were 2.8%, 2.5% and 2.0%, respectively. If insulin concentrations were below the detectable range of 2.0 µU/mL, the reported concentration was imputed as 1.0 µU/mL, an intermediate between 0 and 2.0 µU/mL. Total GIP [GIP (1–42) + GIP (3–42)] was measured at the Public Health Science Biomarker Lab (FHCRC) using the Human GIP (Total) Elisa kit (Millipore EZHGIP-54K) according to the manufacturer’s instructions. Samples were run in duplicate with a median duplicate CV of 1.2%. Two manufacturer quality control (QC) and pooled plasma samples were run together with each batch of study samples. The inter-batch coefficients of variation (CV) were 5.25%, 5.85% and 6.42% for low QC, high QC and the pooled plasma, respectively. Total GLP-1 was measured using a GLP-1 (7–36 and 9–36) enzyme-linked immunosorbent assay kit (Alpco 43-GPTHU-E01) according to the manufacturer’s instructions with the addition of a low concentration (0.6 pmol/L) standard. Samples were run in duplicate with a median duplicate CV of 6.1%. The two manufacturer QCs run together with each batch of study samples had inter batch CVs of 7.3% and 12.2% respectively. A pooled plasma sample was also run in each batch, however the GLP-1 level was very low at 0.52 pmol/L, lower than the lowest standard tested, with a inter batch CV of 21.9%. A very low GLP-1 level was not representative of study samples.
Statistical Analysis
We used paired t tests for diet-component comparative analyses. We used linear mixed models for primary outcome biomarker analyses. In the linear mixed model, diet treatment, diet sequence and diet period were fixed effects and participant was a random effect. We calculated least squared means and 95% confidence intervals for two-sided tests and considered p values less than 0.05 to have statistical significance. We adjusted all models for age, sex, baseline biomarker concentrations, diet sequence and feeding period. Data for baseline biomarkers was log-transformed and we report back-transformed geometric means. We calculated 240 min incremental area under the curve (iAUC) by trapezoidal method [15] for post-prandial data. Only values above baseline concentration counted toward the total iAUC. Homeostasis model assessment for insulin resistance (HOMA- IR) was calculated by taking the product of fasting serum insulin and serum glucose in mg/dL and dividing this by 405 [16]. As an estimate of glucose-adjusted insulin response, we calculated the quotient of post-prandial 240 min iAUC of insulin divided by that for glucose (iAUC insulin/ iAUC glucose) [17]. We performed a priori subgroup analyses within strata of body fat mass where DXA-measured body fat was classified as high for males with ≥25% body fat and females with ≥32% body fat [18]. We formally assessed for significance of an interaction between diet and body fat in the linear mixed models. We used bivariate linear regression models of log-transformed data for exploratory analyses of biomarker correlates. For the parent study, a sample size of 88 participants was chosen, a priori, to allow detection of >30% change in a biomarker concentration with 80% power. For the post-prandial study, we based our sample size calculation on data from the literature and an estimated moderate intra-class correlation (ρ=0.2); we selected a sample size of 20 participants (two groups of 10 participants randomized to one of two diet orders), which would allow us to detect, with 80% power, a 9% difference in glucose and 9.6% difference in insulin between low and higher glycemic load test meals. We analyzed the data using SAS (version 9.1.2 SAS Institute, Cary, NC).
RESULTS
The trial ended as planned upon completion. Of the 89 participants in the parent study, 20 were enrolled for postprandial testing and the last consecutive 16 post-prandial study participants had incretin concentrations measured. We restrict the data analysis here to these 16 participants, all of whom completed both diet intervention periods (Figure 1). The 16 participants ranged in age, ethnicity, and tended to be overweight-obese by gender-specific criteria, as shown in Table 1. Based on daily food planned and recorded consumed on the test diets, the high-GL diet had over twice the GL value as the low-GL diet. Mean daily energy and macronutrient content on the two diets were similar except for higher mean mean available carbohydrate content (difference of means 13 g) in the low-GL diet, as shown in Table 2. Fiber content was higher in the low-GL diet as was fructose content (mean 77 ± 15 g/d in the low-GL diet and 25 ± 4 g/d in the high GL diet). Consumption of protein (g), available carbohydrate (g) and fiber (g) was higher for the low-GL test breakfast meal. There was no detectable difference in insulin sensitivity (as estimated by HOMA-IR) or fasting concentrations of GIP and GLP-1 following the high- and low-GL feeding periods. Mean fasting concentrations of insulin, and glucose following the high- and low-GL feeding periods were not significantly different in 16 participants (Table 3). These findings were similar within body fat strata after adjustment for study design, age, gender and body fat percent.
Figure 1.
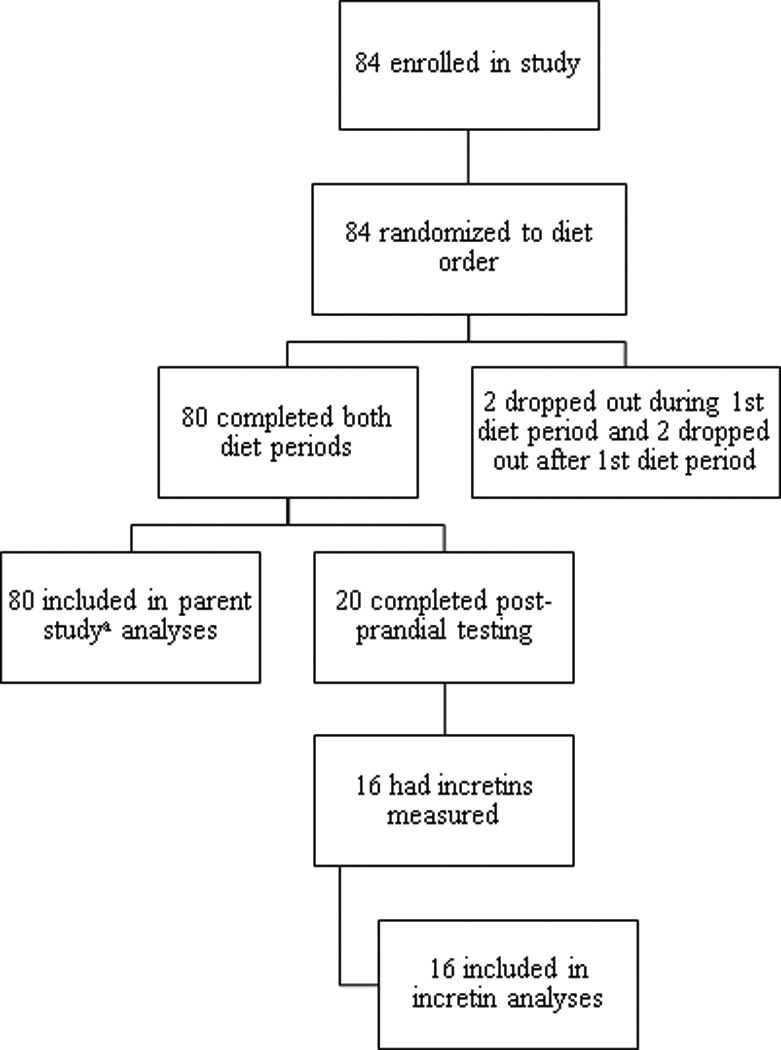
Flow diagram of the progress through phases of this cross-over randomized controlled feeding trial. a Neuhouser, et al. J Nutr 2012;142(2):369-74.
TABLE 1.
Characteristics of cross-over glycemic load diet study participants
| n = 16 | ||
|---|---|---|
| Age range (y) | 19 – 44 | |
| Male/Female (n) | 9/7 | |
| BMI (n) | ||
| 18.5 – 25 kg/m2 | 9 | |
| 28 – 40 kg/m2 | 7 | |
| DXA body fat percentage (n) | ||
| Female body fat < 32% or | 6 | |
| Male body fat < 25% | ||
| Female body fat ≥ 32% or | 10 | |
| Male body fat ≥ 25% | ||
| Ethnicity, self-identified (n) | ||
| Hispanic | 6 | |
| Caucasian | 7 | |
| African American | 2 | |
| Pacific Islander | 1 | |
DXA, dual-energy X-ray absorptiometry
TABLE 2.
Daily planned content of 28-day high- and low-glycemic load diets and consumption of high- and low-glycemic load test breakfasts for participants of the cross-over glycemic load diet study
| Mean daily planneda N = 16 |
Test breakfast consumption N = 16 |
|||
|---|---|---|---|---|
| High-glycemic load | Low-glycemic load | High-glycemic load | Low-glycemic load | |
| Energy (kcal)b | 2621 ± 346.3 | 2554 ± 331* | 549 ± 84 | 589 ± 62* |
| Energy (kcal)c | 2630 ± 326 | 2656 ± 345 | 554 ± 84 | 587 ± 61* |
| Protein (g) | 99 ± 13 | 97 ± 12 | 15 ± 2 | 20 ± 2* |
| Energy protein (%) | 15 ± 0 | 16 ± 0* | 11 ± 1 | 14 ± 1* |
| Fat (g) | 89 ± 12 | 88 ± 11 | 20 ± 5 | 18 ± 3 |
| Energy fat (%) | 31 ± 1 | 32 ± 0* | 32 ± 4 | 27 ± 3* |
| Available carbohydrate (g) | 340 ± 42 | 327 ± 41* | 79 ± 9 | 87 ± 11* |
| Total carbohydrate (g) | 370 ± 49 | 384 ± 50* | 80 ± 10 | 94 ± 11* |
| Energy available carbohydrate (%) | 54 ± 1* | 53 ± 0* | 57 ± 4 | 59 ± 3 |
| Dietary fiber (g) | 29 ± 4* | 55 ± 7* | 2 ± 1 | 7 ± 1* |
| Glycemic load | 267 ± 37* | 125 ± 16* | 63 ± 8 | 32 ± 4* |
Mean ± SD; N=16.
Mean percent consumed of average daily planned content of high- and low-glycemic load diets was between 97 ± 3 and 99% ± 2;
Based on data reported in Nutrition Data System for Research (version 2005, Nutrition Coordinating Center, University of Minnesota);
Based on calculation using 4 kcal/g protein, 9 kcal/g fat, 4 kcal/g available carbohydrate.
Star (*) indicates p values < 0.05 for paired t test of means, comparing high and low glycemic load.
TABLE 3.
Fasting and integrated post-prandial biomarker concentrations following 28-day high- or low-glycemic load diets
| High-glycemic load | Low-glycemic load | Difference of geometric means | P value | |||
|---|---|---|---|---|---|---|
| Fasting measuresa | ||||||
| Glucose (mg/dL) | 92.0 (89.7–94.4) | 91.5 (89.2–93.9) | 0.46 | 0.75 | ||
| Low Body Fat | 89.7 (82.6–97.4) | 88.8 (82.6–95.4) | 0.97 | 0.81 | ||
| High Body Fat | 93.0 (90.1–96.0) | 94.1 (91.0–97.2) | −1.11 | 0.40 | ||
| Insulin (µU/mL) | 7.9 (6.6–9.4) | 7.3 (6.1–8.7) | 0.61 | 0.48 | ||
| Low Body Fat | 5.8 (3.9–8.7) | 4.9 (3.2–7.8) | 0.83 | 0.56 | ||
| High Body Fat | 9.8 (7.9–12.1) | 8.9 (7.2–11.0) | 0.87 | 0.49 | ||
| HOMA-IR | 1.8 (1.5–2.2) | 1.7 (1.4–2.0) | 0.14 | 0.50 | ||
| Low Body Fat | 1.3 (0.8–2.2) | 1.1 (0.7–1.9) | 0.23 | 0.56 | ||
| High Body Fat | 2.2 (1.8–2.8) | 2.1 (1.6–2.6) | 0.17 | 0.57 | ||
| GLP-1 (pmol/L) | 0.7 (0.4–1.3) | 0.9 (0.5–1.6) | −0.15 | 0.50 | ||
| Low Body Fat | 1.5 (0.6–3.6) | 1.3 (0.5–3.3) | 0.12 | 0.87 | ||
| High Body Fat | 0.7 (0.3–1.5) | 1.0 (0.5–2.2) | −0.34 | 0.25 | ||
| GIP (pg/ml) | 43.4 (36.4–51.9) | 38.8 (32.5–46.3) | 4.67 | 0.22 | ||
| Low Body Fat | 41.4 (24.4–70.2) | 38.3 (22.6–64.9) | 3.10 | 0.66 | ||
| High Body Fat | 48.4 (37.7–62.1) | 42.1 (32.7–54.0) | 6.32 | 0.28 | ||
| Postprandial measuresb | High-glycemic load | Low-glycemic load | Difference of LS means | P value | ||
| Glucose iAUC (mg/dL/ 240 minute) | 2832 ± 500 | 1328 ± 212 | 1504 ± 476 | < 0.01 | ||
| Low Body Fat | 3485 ± 442 | 1776 ± 174 | 1709 ± 550 | < 0.01 | ||
| High Body Fat | 3287 ± 617 | 1723 ± 250 | 1564 ± 563 | < 0.01 | ||
| Insulin iAUC (µU/mL/240 min) | 7668 ± 649 | 5656 ± 403 | 2012 ± 644 | < 0.01 | ||
| Low Body Fat | 7891 ±325 | 5529 ± 757 | 2361 ± 882 | < 0.01 | ||
| High Body Fat | 8728 ± 808 | 6587 ± 295 | 2141 ± 785 | < 0.01 | ||
| Insulin iAUC/Glucose iAUC | 22.4 ± 8.8 | 13.2 ± 2.7 | 9.3 ± 10.2 | 0.37 | ||
| Low Body Fat | 31.1 ± 4.9 | 19.8 ± 4.9 | 11.3 ± 9.7 | 0.24 | ||
| High Body Fat | 16.8 ± 10.4 | 12.6 ± 3.7 | 4.2 ± 12.1 | 0.73 | ||
| GLP-1 iAUC (pmol/L/240 min) | 479 ± 56 | 561 ± 55 | −82 ± 39 | 0.03 | ||
| Low Body Fat | 584 ± 53 | 655 ± 24 | −72 ± 65 | 0.27 | ||
| High Body Fat | 484 ± 67 | 582 ± 59 | −99 ± 46 | 0.03 | ||
| GIP iAUC (pg/ml/240 min) | 61521 ± 3799 | 46004 ± 2786 | 15517 ± 4062 | < 0.01 | ||
| Low Body Fat | 60086 ± 6999 | 38753 ± 3778 | 21333 ± 5393 | < 0.01 | ||
| High Body Fat | 60054 ± 4708 | 48841 ± 4070 | 11212 ± 5052 | 0.03 | ||
Linear mixed model analyses adjusted for design effects, age, gender and body fat percent. Low body fat ≤25% for males or <32% for females; high body fat ≥25% for males or ≥32% for females. N = 16; N = 6 in low body fat subgroup, N = 10 in high body fat subgroup.
Geometric means (95% confidence intervals).
Least squares means ± SEM.
HOMA-IR, Homeostasis model of assessment - insulin resistance; iAUC, incremental area under the curve.
Mean concentrations of serum insulin, serum glucose, total plasma GLP-1 and GIP are shown in Figure 2. The high-GL breakfast led to a statistically significant higher mean post-prandial GIP iAUC (p<0.01; higher iAUC GIP was observed in 14 out of 16 participants) and this finding was similar in both body fat strata. In contrast, the high-GL breakfast led to a statically significant lower mean GLP-1 iAUC (p=0.03; lower iAUC GLP observed in 10 out of 16 participants), a result that did not reach statistical si gnificance in the lean subgroup. IAUCs of glucose and insulin were higher following the high-GL breakfast (both p<0.01). The ratio of the integrated insulin and glucose concentrations appeared higher after the high-GL meal, but this result did not reach statistical significance. Interaction terms for diet type and body fat category were non-significant in all fasting and post-prandial biomarker analyses.
Figure 2.
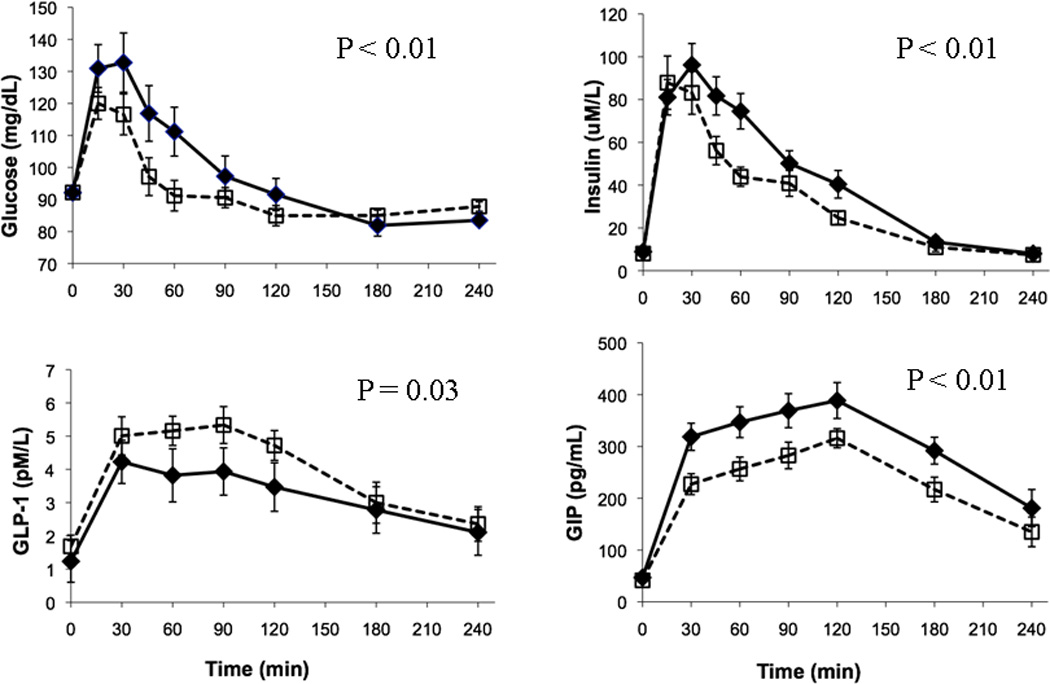
Mean (± SEM) concentrations of fasting and post-prandial plasma glucose, plasma insulin, plasma glucose-dependent insulinotropic polypeptide (GIP) and plasma glucagon-like peptide-1 (GLP-1) in 16 healthy lean and overweight-obese participants who were fasting (time 0) and then consumed a high- (solid line with closed diamonds) and low-(dotted with open squares) glycemic load meal. The p values are levels of statistical significance for differences in LS means of iAUCs following high- and low-glycemic load meals. IAUCs are significantly different for glucose, insulin, GLP-1 and GIP.
Because incretins function to augment meal-related insulin release, we evaluated for correlations between insulin, glucose and incretin responses in exploratory analyses. While there was a statistically significant correlation between insulin and glucose responses (r2 =0.25, p<0.01), there was no correlation observed between insulin or glucose-adjusted insulin response (iAUC insulin/iAUC glucose) and either incretin response for data from both meals. Findings for post-prandial insulin and glucose data from the parent study are similar to these in this smaller sample (manuscript under review).
DISCUSSION
Our results show that following 28 days of a high-GL diet, a high-GL test meal led to statistically significant higher post-prandial concentrations of glucose, insulin and GIP and lower post-prandial concentrations of GLP-1 as compared to the low-GL test meal. Few other studies have tested the effect of dietary GI (or GL) on incretin responses. In one study that performed acute post-prandial incretin testing, authors reported that GLP-1 concentrations did not differ significantly following high- or low-GI test breakfast and lunch meals in 8 healthy, sedentary women [19] though the graphical data suggests lower mean GLP-1 responses to high-GL meals during the first 90 minutes. In another study [20] comparing GLP-1 responses to low- and high-GI beverages in 6 overweight individuals, authors observed no differences in GLP-1 responses at 20 minutes. Their findings may differ from ours because they limited post-prandial testing to 20 minutes. Our data show differences in mean GLP-1 and GIP responses following high- and low-GL test meals at 30 minutes and beyond.
Impaired incretin secretion has been observed in those with type 2 diabetes [21]. While individuals previously diagnosed as diabetic were excluded from our study and fasting glucose testing allowed for exclusion of individuals with impaired fasting glucose, an oral glucose tolerance test would have allowed us to also identify those with impaired glucose tolerance. Study findings of the effect of oral glucose on GLP-1 responses have been mixed: In one study, individuals with impaired glucose tolerance were shown to have higher mean GLP-1 responses to both oral glucose tolerance test and mixed meal testing compared to those who were healthy or who had type 2 diabetes [21]; another study showed a lower mean GLP-1 response to an oral glucose tolerance test in those with impaired glucose tolerance [22]. It is possible that if individuals with impaired fasting glucose were included in our study, these individuals might have had higher than normal GLP-1 responses to the test meals, however this would not explain the difference observed in mean GLP-1 responses for low- and high-GL test meals since this study was conducted with a cross-over design. Although some studies point to an impaired incretin effect in diabetic patients [23], others do not [24]. Given our study in which no effect of adiposity was observed, one might expect to find similar dietary GL-related incretin responses diabetic and healthy individuals if gastric emptying rates were comparable between these groups [24].
We formulated low- and high-GL diets using real foods that are commonly consumed and could be recommended as part of nutrition counseling. As a result, although energy and macronutrient content were similar, dietary fiber differed substantially between the two diets and the two test meals. There are mixed findings regarding the effect of dietary fiber on GLP-1 and GIP responses in humans [25, 26]. One intervention study concluded that the variable effect of fiber on incretin release is influenced by form and structure of the dietary fiber [27]. In our study which tests effects of typical meals, it would be difficult to distinguish fiber-related versus GL-related gut hormone effects. In addition to naturally occurring higher fiber content, the low-GL diet had approximately 3 times higher fructose content as compared to the high-GL diet; fructose has a lower GI compared to glucose [28]. Fructose content of these diets was estimated from fructose values reported in nutritional databases which are subject to measurement error; many values must be imputed or are missing for common foods.
Following test meals, iAUCs of glucose and insulin were higher following the high-GL meal, as compared to the low-GL, as expected. Although it did not reach statistical significance, the high-GL meal led to higher insulin responses even after adjustment for higher post-prandial glucose exposure related to the high-GL meal. Higher insulin responses were not clearly explained by higher GIP responses; t he correlation between iAUC insulin/iAUC glucose and iAUC GIP was non-significant. This finding differs with that of another study [11] in which 22 obese individuals were exposed to 12 weeks of exercise and either high- or low-GI diets. While there was no difference in weight lost or insulin sensitization between treatments, authors found higher mean post-prandial iAUC insulin release (estimated by C-peptide deconvolution) in those receiving the high-GI diet, and observed insulin release was correlated with post-oral glucose iAUC GIP concentrations. In contrast, a lack of correlation observed between insulin and incretin responses in our study may be related to the weight and exercise maintenance aspects of our study, the smaller sample of obese participants and/or a different method for estimation of insulin response.
Detectable concentrations of incretins may not fully represent actual incretin function. Previous findings from other studies support a disconnection between incretin function and concentration [21, 29]. Unfortunately, measurement of meal-related insulinotropic effect of incretins, or “the incretin effect,” measured as the difference between an insulinemic response to a meal and the insulinemic response to an intravenous glucose infusion mimicking the meal response [30], was beyond the scope of this study.
The observed effect of a low-GL meal, as compared to a high-GL meal, on post-prandial concentrations of GIP and GLP-1 are similar to effects of alpha-glucosidase inhibitors on incretin release in healthy and obese individuals [31, 32]. Alpha-glucosidase inhibitors reduce post-prandial blood glucose and insulin excursions by slowing carbohydrate absorption and increasing carbohydrate delivery to the ileum [33] and are used therapeutically to treat diabetes. Alpha-glucosidase inhibitors augment GLP-1 and attenuate GIP post-prandial release in healthy and obese individuals, similar to effects of a low-GL meal. The mechanism for the alpha-glucosidase inhibitor effect on incretin concentrations m ay be mediated vagally [32] and/or through altered nutrient delivery to the small intestine [24]. A higher GLP-1 concentration in response to the low-GL test meal or alpha-glucosidase inhibitors may be a causal factor in lowered post-prandial glucose and insulin responses.
Strengths of our study are the crossover design with two 28-day controlled diet interventions differing substantially in GL. Our study is unique in that we performed post-prandial incretin testing in response to GL corresponding to background diets of similar GL, individualized to be realistic, isocaloric and weight-maintaining. The post-prandial insulin and glucose findings for this subset of participants are similar to those from the larger sample in the parent study, lending strength to our current findings (manscript under review). Our study has several limitations. An oral glucose tolerance test would have allowed us to also identify those with impaired glucose tolerance. The small sample size within smaller body fat subgroups limits our power to draw conclusions about the effects of adiposity. Macronutrient and other dissimilarities between test meals (in part inherent to low- and high-GL diets), may obscure effects attributable to GL on biomarker outcome measures, including incretin concentrations. Future studies using standardized mixed meals are needed to compare such data with those we obtained. Participants in this study met specific enrollment criteria and sampling was not population-based, therefore results may not be generalizable. Finally, because incretin concentrations may not directly reflect functional incretin effects of a particular meal type, measurement and comparison of actual “incretin effects” of GL would allow further inference.
In conclusion, our study shows that weight-maintaining diets differing in GL have minimal effect on insulin sensitivity or fasting incretin concentrations. Our data strongly suggests that a low-GL meal leads to lower post-prandial glycemic, insulinemic and GIP concentrations and higher post-prandial GLP-1 concentrations. Further research is needed to understand if the higher GLP-1 response r elated to the low-GL test meal could play a role in the mechanism by which a low-GL diet prevents diabetes and obesity and controls blood sugar [34]. The lower GLP-1 concentration in response to the high-GL diet may have clinical relevance for patients on this diet and using anti-diabetic medications that work by increasing GLP-1 concentrations. Future trials are needed to examine the interaction of dietary effects and these medication effects.
Our novel findings regarding effects of dietary GL on post-prandial incretin concentrations may offer the possibility for therapeutic dietary intervention. Interventional studies regarding manipulation of the incretin effect by GL would be helpful for establishing future diabetes nutrition guidelines.
ACKNOWLEDGEMENTS
We appreciate the work by staff in the Fred Hutchinson Cancer Research Center Human Nutrition Laboratory and Public Health Science Biomarker Lab. Light Agave Nectar was provided by Madhava Natural Sweeteners, Longmont, CO, USA and Solo® Bars were provided by Solo GI Nutrition, Kewlona, BC, Canada.
FUNDING
NIH grants U54 CA116847, R03 CA132158, T32HL007028
ABBREVIATIONS
- GL
low-glycemic load
- GIP
glucose-dependent insulinotropic polypeptide
- GLP-1
glucagon-like peptide-1
- BMI
body mass index
- GI
glycemic index
- (CARB) Study
Carbohydrates and Related Biomarkers
- FHCRC
Fred Hutchinson Cancer Research Center
- HNL
Human Nutrition Laboratory
- DXA
dual-energy X-ray absorptiometry
- CV
coefficient of variation
- QC
quality control
- iAUC
incremental area under the curve
- HOMA- IR
homeostasis model assessment for insulin resistance
Footnotes
Publisher's Disclaimer: This is a PDF file of an unedited manuscript that has been accepted for publication. As a service to our customers we are providing this early version of the manuscript. The manuscript will undergo copyediting, typesetting, and review of the resulting proof before it is published in its final citable form. Please note that during the production process errors may be discovered which could affect the content, and all legal disclaimers that apply to the journal pertain.
DISCLOSURE STATEMENT
The authors have no conflicts of interest.
AUTHOR CONTRIBUTIONS
JWL, LMV and MLN designed the research protocol; YS recruited participants and conducted the trial; SSR, JWL, MLN, CW and XS analyzed data; SSR, JWL and MLN wrote the manuscript and had primary responsibility for its final content. All authors contributed to preparation of the final manuscript.
REFERENCES
- 1.Villegas R, Liu S, Gao YT, et al. Prospective study of dietary carbohydrates, glycemic index, glycemic load, and incidence of type 2 diabetes mellitus in middle-aged Chinese women. Arch Intern Med. 2007;167(21):2310–2316. doi: 10.1001/archinte.167.21.2310. [DOI] [PubMed] [Google Scholar]
- 2.Salmeron J, Manson JE, Stampfer MJ, et al. Dietary fiber, glycemic load, and risk of non-insulin-dependent diabetes mellitus in women. JAMA. 1997;277(6):472–477. doi: 10.1001/jama.1997.03540300040031. [DOI] [PubMed] [Google Scholar]
- 3.Salmeron J, Ascherio A, Rimm EB, et al. Dietary fiber, glycemic load, and risk of NIDDM in men. Diabetes Care. 1997;20(4):545–550. doi: 10.2337/diacare.20.4.545. [DOI] [PubMed] [Google Scholar]
- 4.Krishnan S, Rosenberg L, Singer M, et al. Glycemic index, glycemic load, and cereal fiber intake and risk of type 2 diabetes in US black women. Arch Intern Med. 2007;167(21):2304–2309. doi: 10.1001/archinte.167.21.2304. [DOI] [PubMed] [Google Scholar]
- 5.Mozaffarian D, Kamineni A, Carnethon M, et al. Lifestyle risk factors and new-onset diabetes mellitus in older adults: the cardiovascular health study. Arch Intern Med. 2009;169(8):798–807. doi: 10.1001/archinternmed.2009.21. [DOI] [PMC free article] [PubMed] [Google Scholar]
- 6.Knowler WC, Barrett-Connor E, Fowler SE, et al. Reduction in the incidence of type 2 diabetes with lifestyle intervention or metformin. N Engl J Med. 2002;346(6):393–403. doi: 10.1056/NEJMoa012512. [DOI] [PMC free article] [PubMed] [Google Scholar]
- 7.Jenkins DJ, Kendall CW, Augustin LS, et al. Glycemic index: overview of implications in health and disease. Am J Clin Nutr. 2002;76(1):266S–273S. doi: 10.1093/ajcn/76/1.266S. [DOI] [PubMed] [Google Scholar]
- 8.Anderson JW, Randles KM, Kendall CW, et al. Carbohydrate and fiber recommendations for individuals with diabetes: a quantitative assessment and meta-analysis of the evidence. J Am Coll Nutr. 2004;23(1):5–17. doi: 10.1080/07315724.2004.10719338. [DOI] [PubMed] [Google Scholar]
- 9.Pereira MA, Swain J, Goldfine AB, et al. Effects of a low-glycemic load diet on resting energy expenditure and heart disease risk factors during weight loss. JAMA. 2004;292(20):2482–2490. doi: 10.1001/jama.292.20.2482. [DOI] [PubMed] [Google Scholar]
- 10.Shyangdan DS, Royle PL, Clar C, et al. Glucagon-like peptide analogues for type 2 diabetes mellitus: systematic review and meta-analysis. BMC Endocr Disord. 2010;10:20. doi: 10.1186/1472-6823-10-20. [DOI] [PMC free article] [PubMed] [Google Scholar]
- 11.Solomon TP, Haus JM, Kelly KR, et al. A low-glycemic index diet combined with exercise reduces insulin resistance, postprandial hyperinsulinemia, and glucose-dependent insulinotropic polypeptide responses in obese, prediabetic humans. Am J Clin Nutr. 2010;92(6):1359–1368. doi: 10.3945/ajcn.2010.29771. [DOI] [PMC free article] [PubMed] [Google Scholar]
- 12.Isken F, Weickert MO, Tschop MH, et al. Metabolic effects of diets differing in glycaemic index depend on age and endogenous glucose-dependent insulinotrophic polypeptide in mice. Diabetologia. 2009;52(10):2159–2168. doi: 10.1007/s00125-009-1466-9. [DOI] [PubMed] [Google Scholar]
- 13.Neuhouser ML, Schwarz Y, Wang C, et al. A low-glycemic load diet reduces serum C-reactive protein and modestly increases adiponectin in overweight and obese adults. J Nutr. 2012;142(2):369–374. doi: 10.3945/jn.111.149807. [DOI] [PMC free article] [PubMed] [Google Scholar]
- 14.Mifflin MD, St Jeor ST, Hill LA, et al. A new predictive equation for resting energy expenditure in healthy individuals. Am J Clin Nutr. 1990;51(2):241–247. doi: 10.1093/ajcn/51.2.241. [DOI] [PubMed] [Google Scholar]
- 15.Wolever TM, Jenkins DJ. The use of the glycemic index in predicting the blood glucose response to mixed meals. Am J Clin Nutr. 1986;43(1):167–172. doi: 10.1093/ajcn/43.1.167. [DOI] [PubMed] [Google Scholar]
- 16.Rudenski AS, Matthews DR, Levy JC, et al. Understanding "insulin resistance": both glucose resistance and insulin resistance are required to model human diabetes. Metabolism. 1991;40(9):908–917. doi: 10.1016/0026-0495(91)90065-5. [DOI] [PubMed] [Google Scholar]
- 17.Utzschneider KM, P rigeon RL, Faulenbach MV, et al. Oral disposition index predicts the development of future diabetes above and beyond fasting and 2-h glucose levels. Diabetes Care. 2009;32(2):335–341. doi: 10.2337/dc08-1478. [DOI] [PMC free article] [PubMed] [Google Scholar]
- 18.Flegal KM, Shepherd JA, Looker AC, et al. Comparisons of percentage body fat, body mass index, waist circumference, and waist-stature ratio in adults. Am J Clin Nutr. 2009;89(2):500–508. doi: 10.3945/ajcn.2008.26847. [DOI] [PMC free article] [PubMed] [Google Scholar]
- 19.Stevenson EJ, Astbury NM, Simpson EJ, et al. Fat oxidation during exercise and satiety during recovery are increased following a low-glycemic index breakfast in sedentary women. J Nutr. 2009;139(5):890–897. doi: 10.3945/jn.108.101956. [DOI] [PubMed] [Google Scholar]
- 20.Milton JE, Sananthanan CS, Patterson M, et al. Glucagon-like peptide-1 (7–36) amide response to low versus high glycaemic index preloads in overweight subjects with and without type II diabetes mellitus. Eur J Clin Nutr. 2007;61(12):1364–1372. doi: 10.1038/sj.ejcn.1602654. [DOI] [PubMed] [Google Scholar]
- 21.Vollmer K, Holst JJ, Baller B, et al. Predictors of incretin concentrations in subjects with normal, impaired, and diabetic glucose tolerance. Diabetes. 2008;57(3):678–687. doi: 10.2337/db07-1124. [DOI] [PubMed] [Google Scholar]
- 22.Rask E, Olsson T, Soderberg S, et al. Insulin secretion and incretin hormones after oral glucose in non-obese subjects with impaired glucose tolerance. Metabolism. 2004;53(5):624–631. doi: 10.1016/j.metabol.2003.11.011. [DOI] [PubMed] [Google Scholar]
- 23.Toft-Nielsen MB, Damholt MB, Madsbad S, et al. Determinants of the impaired secretion of glucagon-like peptide-1 in type 2 diabetic patients. J Clin Endocrinol Metab. 2001;86(8):3717–3723. doi: 10.1210/jcem.86.8.7750. [DOI] [PubMed] [Google Scholar]
- 24.Ma J, Pilichiewicz AN, Feinle-Bisset C, et al. Effects of variations in duodenal glucose load on glycaemic, insulin, and incretin responses in type 2 diabetes. Diabet Med. 2012;29(5):604–608. doi: 10.1111/j.1464-5491.2011.03496.x. [DOI] [PubMed] [Google Scholar]
- 25.Weickert MO, Mohlig M, Koebnick C, et al. Impact of cereal fibre on glucose-regulating factors. Diabetologia. 2005;48(11):2343–2353. doi: 10.1007/s00125-005-1941-x. [DOI] [PubMed] [Google Scholar]
- 26.Karhunen LJ, Juvonen KR, Huotari A, et al. Effect of protein fat, carbohydrate and fibre on gastrointestinal peptide release in humans. Regul Pept. 2008;149(1–3):70–78. doi: 10.1016/j.regpep.2007.10.008. [DOI] [PubMed] [Google Scholar]
- 27.Juntunen KS, Niskanen LK, Liukkonen KH, et al. Postprandial glucose, insulin, and incretin responses to grain products in healthy subjects. Am J Clin Nutr. 2002;75(2):254–262. doi: 10.1093/ajcn/75.2.254. [DOI] [PubMed] [Google Scholar]
- 28.Jenkins DJ, Wolever TM, Taylor RH, et al. Glycemic index of foods: a physiological basis for carbohydrate exchange. Am J Clin Nutr. 1981;34(3):362–366. doi: 10.1093/ajcn/34.3.362. [DOI] [PubMed] [Google Scholar]
- 29.Nauck MA, Vardarli I, Deacon CF, et al. Secretion of glucagon-like peptide-1 (GLP-1) in type 2 diabetes: what is up, what is down? Diabetologia. 2011;54(1):10–18. doi: 10.1007/s00125-010-1896-4. [DOI] [PubMed] [Google Scholar]
- 30.Nauck MA, Homberger E, Siegel EG, et al. Incretin effects of increasing glucose loads in man calculated from venous insulin and C-peptide responses. J Clin Endocrinol Metab. 1986;63(2):492–498. doi: 10.1210/jcem-63-2-492. [DOI] [PubMed] [Google Scholar]
- 31.Qualmann C, Nauck MA, Holst JJ, et al. Glucagon-like peptide 1 (7–36 amide) secretion in response to luminal sucrose from the upper and lower gut. A study using alpha-glucosidase inhibition (acarbose) Scand J Gastroenterol. 1995;30(9):892–896. doi: 10.3109/00365529509101597. [DOI] [PubMed] [Google Scholar]
- 32.Aoki K, Miyazaki T, Nagakura J, et al. Effects of pre-meal versus post-meal administration of miglitol on plasma glucagon-like peptide-1 and glucosedependent insulinotropic polypeptide levels in healthy men. Endocr J. 2010;57(8):673–677. doi: 10.1507/endocrj.k10e-064. [DOI] [PubMed] [Google Scholar]
- 33.Radziuk J, Kemmer F, Morishima T, et al. The effects of an alpha-glucoside hydrolase inhibitor on glycemia and the absorption of sucrose in man determined using a tracer method. Diabetes. 1984;33(3):207–213. doi: 10.2337/diab.33.3.207. [DOI] [PubMed] [Google Scholar]
- 34.Ludwig DS. The glycemic index: physiological m echanisms relating to obesity, diabetes, and cardiovascular disease. JAMA. 2002;287(18):2414–2423. doi: 10.1001/jama.287.18.2414. [DOI] [PubMed] [Google Scholar]