

Abstract
Deficits in social and communication behaviors are common features of a number of neurodevelopmental disorders. However, the molecular and cellular substrates of these higher order brain functions are not well understood. Here we report that specific alterations in social and communication behaviors in mice occur as a result of loss of the EPAC2 gene, which encodes a protein kinase A-independent cAMP target. Epac2-deficient mice exhibited robust deficits in social interactions and ultrasonic vocalizations, but displayed normal olfaction, working and reference memory, motor abilities, anxiety, and repetitive behaviors. Epac2-deficient mice displayed abnormal columnar organization in the anterior cingulate cortex, a region implicated in social behavior in humans, but not in somatosensory cortex. In vivo two-photon imaging revealed reduced dendritic spine motility and density on cortical neurons in Epac2-deficient mice, indicating deficits at the synaptic level. Together, these findings provide novel insight into the molecular and cellular substrates of social and communication behavior.
Introduction
The ubiquitous second messenger molecule cAMP is an important member of many signaling cascades in the CNS. cAMP signaling has been shown to be crucial for many neuronal processes and modulates a broad range of cognitive functions (Silva and Murphy, 1999). Conversely, abnormal cAMP signaling has been implicated in a range of neurodevelopmental and psychiatric disorders (Nestler et al., 2002; Kelley et al., 2008). cAMP signaling occurs via two main downstream pathways; one is protein kinase A (PKA) dependent and the other PKA independent. PKA-independent cAMP targets are comprised of Epac (exchange protein directly activated by cAMP) proteins and cyclic-nucleotide-gated channels. While much attention has focused on the role of the PKA-dependent pathway in vivo, relatively little is known about the roles of PKA-independent mechanisms in the brain.
The Epac proteins, Epac1 and Epac2 (also known as cAMP-GEFI and II, or RapGEF3, or 4), are guanine-nucleotide exchange factors (GEFs) for the small GTPase Rap. Epac2 is highly enriched postnatal cortex while Epac1 has much lower expression in cortex (Kawasaki et al., 1998). Epac2 is far more abundant than Epac1 in cortical neurons (Woolfrey et al., 2009) and is the major Epac protein beyond early developmental stages (Ulucan et al., 2007); thus it might play a more prominent role in regulating cortical function. Epac2 bidirectionally regulates dendritic spine shrinkage and motility in vitro (Woolfrey et al., 2009), and rare missense mutations found in individuals with autism (Bacchelli et al., 2003) affected Epac2 Rap-GEF activity, synaptic protein distribution, and spine morphology (Woolfrey et al., 2009). In addition, Epac2 is required for D1/D5 dopamine receptor-induced dendritic spine morphogenesis and glutamate receptor trafficking. The postsynaptic adhesion protein neuroligin-3 (NL3) forms a complex with Epac2, but not Epac1, and enhances its Rap-GEF activity (Woolfrey et al., 2009). Interestingly, both dopamine and NL3 signaling have been implicated in disorders involving disrupted social and communication behaviors (Jamain et al., 2003; Hettinger et al., 2008). Previous studies using the Epac-specific cAMP analog 8-(4-chloro-phenylthio)-2′-O-methyladenosine-3′,5′-cyclic monophosphate (8-CPT) have found that Epac activation can modulate synaptic plasticity (Gelinas et al., 2008) as well as memory retrieval in mice (Kelly et al., 2009). Recent work has also shown that EPAC1/EPAC2 double-null mice on a 129sv background exhibit deficits in spatial reference memory and social interactions (Yang et al., 2012b). However, the specific role of Epac2 in complex behaviors remains unclear.
Because Epac2 is the major Epac form expressed in the cortex and modulates cortical neuron structure and function in vitro, we hypothesized that its loss may affect cortical phenotypes and complex behaviors. Using an Epac2-null mouse generated on a C57BL/6 background (Shibasaki et al., 2007), we found unexpected roles for Epac2 in specifically regulating social interactions, ultrasonic vocalizations (USVs), and cortical columnar organization in a brain region relevant for social behavior, in addition to regulating dendritic spine motility in vivo. Our data not only provide novel insight into PKA-independent cAMP and neuroligin signaling in the cortex, but they also identify molecular and cellular substrates of social and communication behavior.
Materials and Methods
Reagents
8-CPT was purchased from Tocris Bioscience (R&D Systems). The following antibodies were purchased: rabbit anti-HA polyclonal (Enzo Life Sciences), rabbit anti-Epac2 polyclonal and mouse anti-Epac2 monoclonal (Cell Signaling Technology), rabbit anti-phospho-BRaf (p-BRaf) polyclonal (Abcam), mouse anti-Epac1 monoclonal (Cell Signaling Technology), rabbit anti-Rap polyclonal antibody (Millipore), mouse anti-β-actin monoclonal (Sigma), rabbit anti-neuroligin-3 polyclonal (Santa Cruz Biotechnology), rabbit anti-neuroligin-1 polyclonal (Santa Cruz Biotechnology), mouse anti-GluA2 monoclonal (Millipore), rabbit anti-VGAT polyclonal (Millipore), mouse anti-VGluT1 monoclonal (Millipore), rabbit anti-kalirin polyclonal (Millipore), and mouse anti-PSD-95 monoclonal clone K28/43 (University of California Davis/National Institutes of Health Neuromab Facility). The HA-Epac2-WT construct was a kind gift from Lawrence Quilliam (Indiana University).
Neuronal cultures and quantitative immunofluorescence
Dissociated cultures of primary cortical neurons were prepared from P0–P1 mouse pups from either EPAC2+/+ × EPAC2+/+ or EPAC2−/− × EPAC2−/− crosses, in a manner similar to embryonic rat cortical cultures described previously (Woolfrey et al., 2009). On 21–23 d in vitro (DIV), neurons were transiently transfected for 4 h with plasmid (1–3 μg DNA) using Lipofectamine 2000 (Invitrogen). Endogenous Epac2 was activated by incubating neurons for 1 h at 37°C with 50 μm 8-CPT (Tocris Bioscience) in artificial CSF and then fixed immediately, immunostained, and imaged by confocal microscopy as described previously (Woolfrey et al., 2009; Srivastava et al., 2011). Cultures that were directly compared were stained simultaneously and imaged with the same acquisition parameters. Experiments were performed blind to condition.
Cortical tissue preparation, Rap activation assay, and Western blotting
Activation of endogenous Rap1 in mouse cortical tissue was measured using the GST-Ral-GDS affinity resin (Millipore) as previously described (Woolfrey et al., 2009). Cortical tissue from 8-week-old male mice was dissected after they were killed, and homogenized using 10 strokes of a Teflon-coated homogenizer, followed by sonication, in either Rap1 activation lysis buffer, magnesium lysis buffer, or radioimmunoprecipitation assay buffer. Lysates were analyzed using SDS-PAGE and Western blotting. Intensities of bands were quantified by densitometry using ImageJ (http://imagej.nih.gov/ij/).
Behavioral tasks
Mutant mice lacking the EPAC2 gene (EPAC2-null mice) were generated by Professor Susumu Seino (Shibasaki et al., 2007). For each behavioral test, 5–14 animals (male) per genotype were assessed. Mice were 8–10 weeks of age at the start of testing.
Morris water maze.
The Morris water maze procedures were described previously (Cahill et al., 2009). Briefly, the maze consisted of a pool 1.2 m in diameter filled with opaque water (maintained at 21°C) that was surrounded by spatial cues. Before testing, all animals underwent training with a visible platform (2 d of training, four trials per day). A trial-independent Morris water maze task was used to assess spatial reference memory. Animals were trained with a fixed platform location over a 5 d period with six trials per day, and path length to platform was measured with a video tracking system. Two hours after the final trial on the last testing day, a probe trial was conducted in which the platform was removed, and the percentage of time animals seek the proper pool quadrant was determined. To test learning flexibility, reversal learning was measured. Following the fifth day of training, the platform was moved to a different quadrant, and six trials per day for 2 d were conducted with the platform in the new location. Impaired reversal learning is indicated by consistently higher path errors over reversal learning days. Path length error over days and over trials was analyzed using a 3 (genotype) × 5 (day) or 3 (genotype) × 6 (trial) mixed model ANOVA. Reversal learning was analyzed using a 3 (genotype) × 2 (day) mixed model ANOVA. Path length to visible platform, percentage time floating, average swim speed, and probe trial data were analyzed using one-way ANOVA with Tukey's post hoc tests.
Social approach.
A social approach apparatus was used to quantify the tendency of an experimental mouse to engage in social interaction with a novel mouse. The behavioral testing apparatus was a glass rectangular box (76.2 cm long × 30.5 cm wide × 30.5 cm tall). A mesh cylinder (11.4 cm diameter) was placed at each end of the chamber. The mesh cylinder allowed for air exchange and for animal auditory, visual, and olfactory interaction, but prevented fighting. For each animal, the assay consisted of a 5 min habituation phase, in which two empty mesh cylinders were present, a 5 min rest phase in a neutral cage, and a 5 min testing phase in which a stimulus mouse was placed in one of the mesh cylinders (Fig. 1C). The end of the arena containing the enclosed stimulus mouse was designated the social side, and was alternated for each test mouse. All stimulus mice were 8-week-old wild-type mice, and a different stimulus mouse was used for each test mouse. Animal position was logged via automated video tracking (LimeLight software; Actimetrics). During analysis, the arena was divided into three zones: social, nonsocial, and intermediate. Time spent on each side during each phase of the test and time spent in close proximity (within 5 cm) of the stimulus mouse during the test phase was recorded for each mouse.
Figure 1.
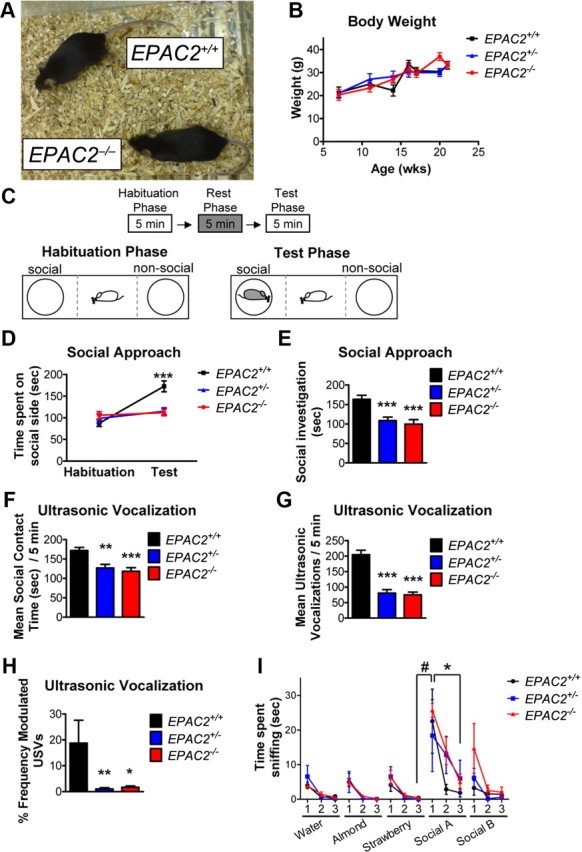
Social approach behavior and USVs are disrupted in Epac2-deficient mice. A, EPAC2+/+ and EPAC2−/− mice are similar in gross morphology. B, Body weight is unchanged across genotypes. C, Schematic of social approach assay. A 5 min habituation phase in the social approach apparatus, without the stimulus mouse present, was followed by a 5 min rest phase in the home cage, and then followed by the test phase, in which the stimulus mouse was placed under the cage on the previously designated “social” side of the apparatus. Dashed lines indicate delineation of social, neutral (center), and nonsocial regions during post-testing analysis. Time spent in each region (social, nonsocial, and neutral) was recorded. D, Quantification of time spent on social side of social approach apparatus during habituation and test phases. EPAC2+/+ mice spent more time on the social side during the test phase of social approach than during the habituation phase, while time spent on social side during habituation phase and test phases did not differ in EPAC2+/− and EPAC2−/− mice. A 3 (genotype) × 2 (phase) mixed model ANOVA with Bonferroni post tests was used. E, Quantification of time spent in close proximity to stimulus mouse during social phase of social approach task. EPAC2+/− and EPAC2−/− mice spent less time socially investigating the stimulus mouse during the test phase than EPAC2+/+ mice. One-way ANOVA with Tukey's post hoc. F, Quantification of social contact time during USV measurement between males of all three genotypes with a wild-type female for 5 min in a neutral home cage. One-way ANOVA with Tukey's post hoc. G, Quantification of number of USVs during 5 min of exposure to wild-type female mouse. One-way ANOVA with Tukey's post hoc. H, Quantification of percentage of frequency-modulated USVs during 5 min of exposure to wild-type female mouse. Kruskal–Wallis test with Dunn's multiple-comparison test. I, Quantification of time spent sniffing nonsocial odors (water, almond, and strawberry) and social odors (swabs of used cages of unfamiliar mice) during three consecutive presentations of each odor. While odor had a significant effect (p < 0.0001), genotype has no significant effect on time spent sniffing (p > 0.05). Mixed model (genotype × trial) ANOVA with Bonferroni post tests. All three genotypes exhibited significantly increased sniff time during social A1 compared with strawberry 3 (i.e., dishabituation; #), while EPAC2+/+ and EPAC2−/− mice exhibited reduced sniff time upon the third exposure of social A compared with the first (i.e., habituation; *). #p < 0.05; *p < 0.05; **p < 0.01; ***p < 0.001. n = 6–14 animals/genotype.
USVs.
Using an established protocol (Wang et al., 2008), EPAC2+/+, EPAC2+/−, and EPAC2−/− males were paired with wild-type females in a neutral home cage for 5 min. Both video and audio recordings of the sessions were made. From the video, mean interaction time was quantified. Testing took place in autoclaved rectangular polyethylene cages measuring 29 × 18 × 12.5 cm with standard bedding, covered by a metal wire lid. Males and females were then introduced into this “neutral” cage and allowed to freely interact for 5 min. USVs were recorded from the high-frequency output of a Pettersson D980 bat detector and condenser microphone (Pettersson Elektronik AB) by a Fostex FR2 field recorder. Sonograms were produced using SAS Lab Pro (Avisoft Bioacoustics). Discrete USVs were identified and counted by an experienced blinded experimenter. Frequency-modulated USVs were defined as having a bandwidth >5 kHz. Behavior was recorded using a video camera (Sony), and total length of contact was quantified by an experienced observed blind to condition. Social contact during the USV paradigm was defined as paw, nose, or body contact with the female mouse. Nine to 12 animals per genotype were analyzed.
Olfactory habituation/dishabituation.
The ability of Epac2-deficient mice to smell and distinguish between different odors was tested using an olfactory habituation/dishabituation test (Yang et al., 2012a). Each test mouse was placed in a clean standard housing cage with bedding, and was allowed to acclimate for 45 min. A clean, dry cotton-tipped applicator was inserted through a hole in the lid during the acclimation period. After acclimation, odors were presented on cotton-tipped applicators inserted through the cage lid in three consecutive 2 min trials each, with 1 min inter-trial intervals. The odor presentation order used was 3 × water, 3 × almond, 3 × strawberry, 3 × unfamiliar social cage A, and 3 × unfamiliar social cage B. Almond and strawberry extracts (Frontier Natural Products Co-op) were diluted 1:100 in distilled water. Unfamiliar social cage odors were generated by swiping the bottom of dirty cages containing mice that have never been exposed to the test mice. Time spent sniffing the cotton-tipped applicator, indicated by the mouse's head being oriented toward the applicator and the nose within 2 cm, was quantified for each trial of each odor.
Digigait.
Locomotion was analyzed using digital gait analysis system (Digigait; Mouse Specifics). Animals are placed on a transparent treadmill and filmed with a high-speed camera during locomotion. Software then isolated the animals' paws from the video images and allowed quantification of stride frequency and length at belt speeds of 24 and 34 cm/s. Four animals per genotype were tested.
Open field maze.
Mice were placed in the center of an open field (56 × 56 cm), and ambulation activity was collected by the LimeLight software (Actimetrics) for 5 min. The software provides the total distance traveled as well as the percentage of time/distance within different parts of the open field by dividing the open field into a 5 × 5 grid of squares and defining outer, middle, and inner regions. The mean percentage of time spent in each region for each genotype, normalized to the area of the zone, was calculated.
Zero maze.
The zero maze (Cook et al., 2002) consisted of a round track (56 cm diameter) divided into four sections of equal area by two sets of walls along the track, separated by 180 degrees around the track. Mice were placed on the track in the center of the open area and were examined for a preference for the closed or open arms during a 5 min session using LimeLight software (Actimetrics). Mean time spent in the closed quadrants was compared among genotypes.
Y-maze.
Y-maze spontaneous alternations task was performed in a similar manner as described previously (Cahill et al., 2009). Briefly, mice were placed in the Y-maze and allowed to enter any of the three arms for 5 min while being recorded by a video tracking system and LimeLight software. The order of arm entries was recorded and analyzed for spontaneous alternation. An alternation was scored for each set of three consecutive choices where no repeated entries occur. The number of successive three-arm alternations was divided by the maximum number of arm entries within 5 min to yield the percentage of spontaneous alternations. Chance level of alternation is 50%. This task requires working memory, as animals must maintain and update a mental log of recent arm entries.
Nissl staining
Behaviorally naive mice were anesthetized with a ketamine/xylazine mixture and perfused transcardially with PBS followed by 4% paraformaldehyde (PFA) in PBS. Brains were removed, postfixed overnight in 4% PFA/PBS, and cryoprotected in 30% sucrose/PBS. Brains were then cryosectioned at 50 μm and mounted on slides. Slides were passed through a graded series of ethanol solutions before being stained with a solution containing 0.625% cresyl violet acetate and 0.375% acetic acid. Slides were then dehydrated and mounted with Permount (Fisher Scientific).
Cortical column analysis
Cortical minicolumns were quantified using semiautomatic image analysis (Buxhoeveden et al., 2000). The anterior cingulate cortex (ACC) of 2 Nissl-stained sections (corresponding to bregma 1.70 and 1.94 mm), on either side of the midline, and the somatosensory cortex (corresponding to bregma −1.28 and −1.64 mm) were imaged with a 10× objective (NA 0.17, lateral resolution 0.633 μm/pixel). Z-stacks of layers 1–3 of each section were obtained using a Zeiss MRm CCD camera on a Zeiss LSM5 Pascal confocal microscope, and collapsed using the “Best Focus” stack arithmetic function in MetaMorph (Molecular Devices). Analysis was performed remotely using ImageJ, with the experimenter blind to conditions. Images of layer 2/3 from both brain regions were first thresholded to separate neurons from background. Because of possible variations in staining, images were thresholded automatically on a per-image basis. Images were then made into binary images; subsequently a Watershed algorithm was used to define cell borders. The density of cells and the mean soma size within layer 2/3 of each image was quantified for each genotype. Both hemispheres from two sections for both the ACC and the somatosensory cortex were analyzed from five to six mice per genotype.
Minicolumn regions of interest (ROIs) were defined as having a width of 60 μm, twice the size of minicolumns previous reported (Di Rosa et al., 2008). The density of cells within column regions was automatically counted: only cells with an area of 100–350 μm2, and those that did not touch the edges of the defined column, were included in quantification. Up to 10 ROIs per section, placed at regular, nonoverlapping intervals across the image of layer 2/3, were used, and the mean number of cells per column and cell spacing (defined as the total area of somas divided by the total area of the defined column) were calculated for each column. To calculate total path length ratio (TPLR), the total path length was first determined by measuring the sum of Euclidean distances between consecutive cells within a column. The total path length was then divided by the linear depth of the column, such that TPLR of a hypothetical column where all cells lie along a central line would be equal to 1.0, while TPLR of real columns is >1.0 (Buxhoeveden et al., 2000).
A number of assumptions were made in our calculations. First, our method requires a vertical orientation of minicolumns. Due to the curvilinear nature of the cortex, it is likely that minicolumns are not linear within our sections, and may even move between z-planes. Therefore, it is possible that our calculations are an underestimate of cell density within minicolumns. Second, to restrict measurements to only include pyramidal neurons, only somas with an area of 100–350 μm2 were analyzed. This allowed for the filtering of nonpyramidal cells (glia and interneurons), and the removal of multiple cells too close together for the Watershed algorithm to distinguish as separate cells. Finally, as minicolumns are defined as a dense core of cell bodies, it is assumed that a decrease in the average number of cells within these columns represents a disorganization of columns. Using this approach, it is not possible to measure a number of other columnar parameters, such as the width of columns and the neuropil space. However, it is possible to measure cell spacing (defined as the total area of somas divided by the total area of the defined column).
In utero electroporation
C57BL6 female mice were checked for vaginal plugs (E0) and electroporation was performed at E14.5, as previously described (Srivastava et al., 2012). Briefly, after sedation, both uterine horns were removed and placed on sterile, warm, and PBS-wetted pads. DNA solution (either Epac2-shRNA or pGSuper as an empty vector control) was loaded into beveled glass micropipettes and injected into the lateral ventricle through the uterus wall using a nanojector (Drummond Nanoject II). FastBlue (0.05%) was added to visualize DNA. DNA was electroporated into the neural precursor populations that reside on the ventricular zone by directed electroporation by placing the (+) end of the electrode toward the developing neocortex. Unipolar electric pulse of 40 V was generated (BTX ECM830), and a total of five 50 ms pulses at an interval of 100 ms were applied to the cerebral wall. After electroporation, embryos were placed back into the abdominal cavity. At P0–P1, pups were killed and their brains were removed and fixed overnight in 4% PFA/4% sucrose in PBS. Fixed brains were embedded in agar and coronal sections at a thickness of 50 μm were made and placed under coverslips. Electroporated sections were imaged using a 10× objective (NA = 0.17) and a Zeiss LSM5 Pascal confocal microscope. The efficiency of the Epac2-shRNA has been previously reported in vitro and in vivo (Woolfrey et al., 2009; Srivastava et al., 2012).
Surgical preparation for in vivo imaging
EPAC2+/+,+/−,−/− mice (C57BL/6) expressing green fluorescent protein (GFP) under the control of the thy1 promoter in a subset of cortical layer 5 neurons were used [Tg(Thy1-GFPM)2Jrs/J transgenic line] (The Jackson Laboratory). Animals were 4 weeks old (P28) at time of imaging. Mice were anesthetized using 1.5% isoflurane, and a body temperature of 37°C maintained throughout the experiment. The skull was exposed, and M2 association cortex (frontal association cortex) was identified according to stereotaxic coordinates (+2.8 mm bregma, +1 mm midline). A skull plate was then fastened to the skull using dental acrylic, and was then attached to a metal base that connected directly to the microscope stage for imaging. The skull over the frontal cortex was thinned by using a high-speed dental drill (Osada) and then removed with forceps to create a small (2 × 2 mm) craniotomy. The skull was periodically bathed in saline to keep brain from dehydrating during the procedure. Neurons could be imaged up to 5 h postsurgery. The craniotomy was filled with 1.5% agar and sealed with a No. 0 coverslip to ensure stability during imaging. During imaging, anesthesia was maintained by a continuous supply of 1.5% isoflurane.
Two-photon imaging
A custom-built two-photon laser scanning microscope and image acquisition software was used for in vivo imaging (Jack Waters, Northwestern University). The microscope is based on an optical rail, and consisted of a coherent laser (Ti:sapphire laser) at a wavelength of 950 nm. Fluorescence z-stack images were collected by photomultiplier tubes positioned in the epi-fluorescence beam path. The craniotomy over the frontal cortex was initially detected under low magnification (4× air lens; Zeiss), and areas with superficial dendrites were identified using a 40× water-immersion lens (NA 0.8; Zeiss) by two-photon microscopy. The 40× lens with a digital zoom of X4 was used to collect images of dendritic spines. Only dendritic spines on dendrites 15–40 μm from the pia surface were imaged to minimize optical aberrations in the z-plane. Z-stacks (25–50 planes), at a pixel resolution of 400 × 400, were taken at 1 μm intervals every 5 min for 30 min. Two to five neurons per animal and three to four animals per genotype were imaged.
Analysis of dendritic spine motility in vivo
Images were imported to ImageJ (http://rsbweb.nih.gov/ij/), aligned using the StackReg plug-in, and each z-stack was collapsed as a 2D maximum projection image. Each time point was arranged as a stack of 2D images (each image equals a single time point), and spines were then analyzed at each time point; movements of spines in the z dimension were not analyzed. Spine motility was defined as the average change in length per unit time (micrometers per minute). Dendritic spine length (base to tip) was measured for each spine at each time point in ImageJ, and the absolute difference between each time point was calculated and averaged for each dendrite analyzed giving a motility index (micrometers per minute). Only spines that were clearly visible were analyzed. No obvious rotational drift was seen.
Statistical analysis
For quantitative immunofluorescence, quantitative Western blotting, spine morphology, and cortical column analysis, differences among condition means were identified by Student's unpaired t tests or one-way ANOVAs performed in GraphPad Prism and SPSS. Tukey's or Bonferroni post hoc analysis was used for multiple comparisons. For the social approach task, olfactory behavior, Morris water maze, and open field measurements, mixed model ANOVAs were performed as indicated. For all other behavioral tasks, one-way ANOVA with Tukey's post hoc tests were used, unless otherwise stated. Data are represented as means and SEM. Values of p < 0.05 were considered significant.
Results
Specific deficits in social and communication behaviors in Epac2-deficient mice
A general characterization of the EPAC2−/− mouse line used herein has been performed previously (Shibasaki et al., 2007); hence here we investigated only neurological phenotypes. EPAC2−/− mice were similar to wild-type (EPAC2+/+) in appearance and did not display qualitatively abnormal gross morphology (Fig. 1A). We established EPAC2+/− × EPAC2+/− crosses to generate littermates of EPAC2+/+, EPAC2+/−, and EPAC2−/− genotypes. These crosses were viable, bred normally, and exhibited normal Mendelian ratios at weaning. Because Epac2 has been implicated in insulin secretion (Shibasaki et al., 2007), we examined body weight in Epac2-deficient mice. The trajectories of body weight of Epac2-deficient mice (EPAC2+/− and EPAC2−/−) at 7–21 weeks of age were not significantly different compared with EPAC2+/+ littermates [n = 4–9 mice; mixed model (genotype × age) ANOVA; genotype: F(2,20) = 0.285, p = 0.755; age: F(6,20) = 16.947, p < 0.0001; interaction: F(12,20) = 1.484, p = 0.2100; Figure 1B]. Epac2 expression is low during early postnatal development and high after 3–4 weeks postnatal (Ulucan et al., 2007); thus, we performed all behavioral experiments in 8-week-old littermate mice.
Because Epac2 is a downstream target of dopamine receptors and NL3, both of which have been implicated in social behaviors and communication (Burgdorf et al., 2007; Wang et al., 2008; Muller et al., 2009; Radyushkin et al., 2009), we hypothesized that Epac2 might also be involved in these behaviors. To determine whether Epac2-deficient mice displayed impaired sociability, we measured the tendency of a subject mouse to approach another unfamiliar mouse and engage in social investigation in a modified social approach paradigm (Cahill et al., 2009; Silverman et al., 2010) (Fig. 1C). Following 5 min of habituation of the “test” mouse to the social approach arena, a “stimulus” wild-type (age-matched) mouse was placed within a wire chamber on one side of the social approach arena, and the amount of time the test mouse spent investigating the stimulus mouse was recorded during this social phase. As expected, wild-type mice spent more time within the social side during the social phase compared with the habituation phase. On the contrary, Epac2-deficient mice did not spend more time within the social side during the social period compared with the habituation period [social investigation, habit vs social (sec): EPAC2+/+, 87.1 ± 7.6 vs 172.3 ± 12.6; EPAC2+/−, 98.8 ± 10.6 vs 114.9 ± 9.0; EPAC2−/−, 105.9 ± 8.5 vs 111.8 ± 7.2; mixed model (genotype × test phase) ANOVA: genotype: F(2,78) = 3.868, p = 0.025; test phase: F(1,78) = 22.26, p < 0.0001; interaction: F(2,78) = 10.78, p < 0.0001; Figure 1D]. No preference was seen in the amount of time spent in the nonsocial side between the habituation and social periods for any of the genotypes. Measurement of the amount of time each animal spent in close interaction during the social phase revealed that wild-type mice spent more time investigating the stimulus mouse compared with Epac2-deficient mice (social investigation during social phase (sec): EPAC2+/+, 163.3 ± 10.4; EPAC2+/−, 108.7 ± 9.0; EPAC2−/−, 99.8 ± 11.5; one-way ANOVA with Tukey's post test; F(2,39) = 11.01, p = 0.0002; Figure 1E). These data suggest that Epac2-deficient mice display impaired sociability relative to wild-type mice.
Adult male mice emit USVs (50–80 Hz) as a means for communication during social interactions and in courtship (Burgdorf et al., 2007; Fischer and Hammerschmidt, 2011). Because the dopaminergic system and NL3 have been previously implicated in the regulation of USVs (Burgdorf et al., 2007; Wang et al., 2008; Radyushkin et al., 2009; Fischer and Hammerschmidt, 2011), we tested whether Epac2-deficient mice displayed altered USVs. We paired wild-type or Epac2-deficent mice, aged 8–12 weeks old, with age-matched wild-type females in a neutral home cage for 5 min, and recorded USVs emitted by the male and social interactions between the male and female (Holy and Guo, 2005; Burgdorf et al., 2007). In agreement with our social approach data, Epac2-deficient male mice exhibited reduced social interactions with females relative to wild-type during the 5 min USV recording session (mean social contact time (sec)/5 min: EPAC2+/+, 172.2 ± 7.9; EPAC2+/−, 126.9 ± 9.2; EPAC2−/−, 118.64 ± 9.1; one-way ANOVA with Tukey's post test; F(2,29) = 11.58; p < 0.01, 0.001; Figure 1F). Furthermore, Epac2-deficient mice emitted significantly fewer calls over a 5 min session (mean USVs/5 min: EPAC2+/+ 204.6 ± 14.1; EPAC2+/− 80.7 ± 11.2; EPAC2−/− 75 ± 8.8; one-way ANOVA with Tukey's post test; F(2,29) = 39.33; p < 0.0001; Fig. 1G). In this paradigm, male mice typically produce bouts of frequency-modulated USVs (Holy and Guo, 2005; Wang et al., 2008); therefore, we also assessed the complexity of emitted calls. As expected, wild-type mice emitted complex, frequency-modulated calls. Conversely, calls emitted by Epac2-deficient mice were greatly simplified (percentage frequency-modulated USVs: EPAC2+/+, 18.8 ± 8.8; EPAC2+/−, 1.1 ± 0.4; EPAC2−/−, 1.7 ± 0.5; Kruskal–Wallis test with Dunn's multiple-comparison test; Kruskal–Wallis statistic = 12.52; p = 0.0019; Fig. 1H), suggesting that not only were Epac2-deficient mice emitting fewer calls, but that the structure and complexity of these calls were abnormal compared with wild-type mice.
Impairments in sociability could arise due to disabilities in detecting social olfactory cues. As Epac2 is expressed in the olfactory bulb, we tested Epac2-deficient mice in an olfactory habituation/dishabituation task (Yang et al., 2012a). All genotypes exhibited similar abilities to detect and differentiate nonsocial and social odors (Fig. 1I). Two-way repeated-measures ANOVA reveals a significant main effect of odor on sniff time, but no effect of genotype on sniff time [mixed model (genotype × odor) ANOVA; odor: F(14,224) = 13.9, p < 0.0001; genotype: F(2,224) = 1.007, p = 0.3896; interaction: F(28,224) = 0.8157, p = 0.7337]. All three genotypes exhibited dishabituation to the first exposure of social A compared with the third exposure of strawberry, and EPAC2+/+ and EPAC2−/− mice exhibited significant habituation to social A by the third exposure (p < 0.05; Bonferroni post test after mixed model ANOVA; Fig. 1I). These data suggest that loss of Epac2 does not disrupt the detection of novel social odor cues and habituation to repeated exposures to the same social odor.
Collectively, these data demonstrate that loss of Epac2 results in abnormal social interaction, assessed by social approach and male-female interactions, and that Epac2-deficient mice emit fewer and less complex USVs when paired with age-matched female mice, similar to the effects observed in NL3 knock-out mice (Radyushkin et al., 2009). Furthermore, impaired olfactory detection of novel social cues is not likely to contribute to altered social behaviors in Epac2-deficient mice.
Normal performance in spatial memory and anxiety tasks in Epac2-deficient mice
Because both cAMP and Rap signaling have been implicated in spatial learning and working memory (Morozov et al., 2003), and because Epac2 modulates spine morphology and synaptic function (Woolfrey et al., 2009), we hypothesized that cognitive functions, including spatial working and reference memory, might be altered in Epac2-deficient mice. To test whether loss of Epac2 affected spatial reference learning and memory, we used the Morris water maze (Cahill et al., 2009). During initial training, there were no differences across genotypes in path error to the visible platform, percentage time floating, or swim speed during the visible platform trials. Utilizing a trial-independent Morris water maze task (Cahill et al., 2009), we measured the ability of animals to find a hidden platform, represented as path error to locate the platform over 5 d of training with six trials per day. We found that while day had a significant effect on path error, there was no effect of genotype on path error across testing days [mixed model (genotype × day) ANOVA; day: F(4,48) = 9.455; p < 0.0001; genotype: F(2,48) = 1.282, p = 0.3130; Figure 2A]. During a probe trial (platform removed from water maze) on the final day of testing, Epac2-deficient mice spent a similar amount of time in the target quadrant as wild-type mice (one-way ANOVA with Tukey's post test; F(2,10) = 1.047, p = 0.3864; Fig. 2B). To assess behavioral flexibility, we performed a reversal learning task using the Morris water maze: following the fifth day of training we moved the platform to a new quadrant, and calculated the path error to locate the newly positioned platform over 2 additional days of training (six trials per day). While day had a significant effect on time spent in target quadrant, there was no effect of genotype [mixed model (genotype × day) ANOVA; day: F(1,12) = 6.867; p = 0.0224; genotype: F(2,12) = 1.558; p = 0.2504; Figure 2C]. These data indicated that reversal learning had occurred, and that all genotypes were able to learn a new target location to a similar degree.
Figure 2.

Loss of Epac2 does not alter anxiety, spatial reference memory, or spatial working memory. A, Quantification of path error across days of training of EPAC2+/+ EPAC2+/− and EPAC2−/− mice (8 weeks postnatal) in the Morris water maze spatial reference memory test (fixed platform). Data are means of six trials for each day. A 3 (genotype) × 5 (day) mixed model ANOVA revealed a main effect of day on path error, but no difference across genotype was observed. B, Water maze probe trail as a test of spatial reference memory at the end of day 5 shows the percentage of time animals search the target quadrant. No difference across genotypes in percentage of time searching in the target quadrant was observed (one-way ANOVA, p > 0.05). Dashed line indicates chance performance (25%). C, Quantification of path error of Morris water maze reversal learning task. After the sixth trial on the fifth day, the platform is moved to a different location from previous five trials, and two additional trials are conducted. Mixed model ANOVA revealed a significant effect of day on path error (p < 0.05), but no effect of genotype (p > 0.05). D, Quantification of percentage of three-arm alternation events during 5 min of Y-maze spontaneous alternation task. Line indicates chance performance (50%). One-way ANOVA (p > 0.05). E, Quantification of the number of possible alternations during 5 min of Y-maze spontaneous alternation task, as a measure of locomotor activity. One-way ANOVA (p > 0.05). F–G, Quantification of time spent in enclosed quadrants (F) and distance traveled (G) during 5 min in a zero maze task. One-way ANOVA, *p > 0.05. n = 5 animals/genotype.
We next assessed working memory using an arm recognition task in the Y-maze. Assessment of spontaneous alternation behavior revealed no difference across genotype (one-way ANOVA with Tukey's post test; F(2,25) = 0.3219, p = 0.7277; Fig. 2D), and all animals entered a similar number of arms during the course of testing (one-way ANOVA with Tukey's post test; F(2,25) = 2.623, p = 0.0924; Fig. 2E). Finally, to assess anxiety levels in Epac2-deficient mice, we tested all genotypes in an elevated zero maze. Epac2-deficient mice spent a similar amount of time within the closed quadrants as wild-type mice (one-way ANOVA with Tukey's post test; F(2,12) = 1.595, p = 0.2430; Fig. 2F), and did not differ in the total distance traveled (one-way ANOVA with Tukey's post test; F(2,12) = 0.3105, p = 0.7388; Fig. 2G).Together, these data demonstrated that Epac2-deficient mice had normal spatial reference learning and memory, had intact spatial working memory, and displayed normal levels of anxiety-related behaviors, suggesting that altered cognition or elevated anxiety is not likely to contribute to the observed alterations in social approach and USVs.
Unaltered locomotor activity and repetitive behaviors in Epac2-deficient mice
Because Epac2 is highly expressed in the motor cortex, cerebellum, and striatum, we assessed motor function in Epac2-deficient mice. We tested wild-type and Epac2-deficient mice in an open field test, a combined test for general locomotor activity, exploratory behavior, and anxiety. Epac2-deficient mice did not differ significantly from wild-type mice in distance traveled in a 5 min open field task (one-way ANOVA with Tukey's post test; F(2,12) = 0.5271, p = 0.6034; Fig. 3A). Epac2-deficient mice also displayed similar levels of thigmotaxis over a period of 5 min in the open field, with no differences across genotypes in the time spent within the outer, middle, or inner regions of the open field [mixed model (zone × genotype) ANOVA; zone: F(2,36) = 40.22, p < 0.0001; genotype: F(2,36) = 0.5666, p = 0.5724; Figure 3B], suggesting that Epac2-deficient mice had intact exploratory behavior. Analysis of gait using an automated treadmill test (Digigait; Mouse Specifics) revealed that Epac2-deficient mice displayed normal stride frequency and stride length [mixed model (genotype × paw) ANOVA; genotype: p > 0.05; Fig. 3C,D]. Because previous studies have reported disruptions in cAMP and Rap1 signaling in patients with obsessive-compulsive disorder (Tardito et al., 2001), we hypothesized that Epac2-deficient mice might display repetitive behaviors. We measured the number of grooming, wall leaning, and sitting events within a 5 min period in an open field (Silverman et al., 2010). However, we did not detect a difference across genotypes in these parameters (one-way ANOVA; grooming: F(2,11) = 0.1011, p = 0.9046; wall leanings: F(2,11) = 0.3770, p = 0.6944; sittings: F(2,11) = 1.136, p = 0.3561; Figure 3E–G). Collectively, these data suggest that Epac2-deficient mice have normal gait, locomotor, and exploratory activity, and do not display repetitive behaviors, highlighting the specificity of their deficits in social and communication behaviors.
Figure 3.

Unaltered locomotor activity and repetitive behaviors in Epac2-deficient mice. A, Quantification of distance traveled during 5 min in an open field. B, Quantification of time spent in outer, middle, and inner zones of open field during 5 min, as a measure of anxious behavior. Mixed model (zone × genotype) ANOVA revealed a significant effect of zone (p < 0.0001), but no effect of genotype (p > 0.05) on time spent in each zone. C, Quantification of stride frequency at belt speeds of 24 and 34 cm/s revealed no effect of genotype. D, Quantification of stride length at belt speeds of 24 and 34 cm/s revealed no effect of genotype. E–G, Grooming (E), wall leaning (F), and sitting (G) events during 5 min of open field task were not different across genotypes. Error bars indicate SEM. n = 5 animals/genotype. One-way ANOVA.
Region-specific alterations in cortical organization in Epac2-deficient mice
Specific cortical regions, such as the frontal cortex in general and the ACC in particular, are thought to play an important role in social behavior and in the control of vocalization in mammals (Rushworth et al., 2007; Jürgens, 2009; Fischer and Hammerschmidt, 2011). It has been hypothesized that neurons organized into columns form the functional working unit within this area (Casanova et al., 2009; Rakic, 2009). We thus reasoned that the specific impairments in social and communication behaviors seen in Epac2-deficient mice may be associated with disruptions of cellular organization of the ACC. To examine the cytoarchitecture of Epac2-deficient mice, we performed Nissl (cresyl violet) staining of coronal brain slices taken from age-matched EPAC2+/+, EPAC2+/−, or EPAC2−/− littermates, and analyzed columnar organization in the ACC in these mice, as well as in the somatosensory cortex as an internal control (Fig. 4A). We first examined gross anatomical structures in brains of these mice. Overall brain weight was similar across genotypes (one-way ANOVA with Tukey's post test; F(2,18) = 1.753, p = 0.2016; Fig. 4B), and no differences in the thickness of the ACC, somatosensory cortex, or hippocampus were observed between EPAC2+/+ and EPAC2−/− mice (Student's t tests; p > 0.05; Fig. 4C,D). Based on previously established methodology (Buxhoeveden et al., 2000), we first assessed the number of cells within a defined column in layer 2/3; a layer where columnar organization is readily evident (Casanova et al., 2009; Oblak et al., 2011). Our working hypothesis was that disruption of columnar organization would be represented by an altered number of cells within these defined columns (see Materials and Methods for an expanded explanation of methodology). There were no differences in overall cell number or soma size within layer 2/3 of the ACC or somatosensory cortex in EPAC2+/+, EPAC2+/−, or EPAC2−/− mice (one-way ANOVA; ACC: cells/mm2, F(2,37) = 1.223, p = 0.3060; avg. soma size: F(2,37) = 1.189, p = 0.3158; somatosensory: cells/mm2, F(2,34) = 0.9111, p = 0.4117; avg. soma size: F(2,34) = 2.924, p = 0.0673; Figure 4E–G). Subsequent examination of the number of cells within a defined column in layer 2/3 (see Materials and Methods for an expanded explanation of analysis and assumptions made) revealed that EPAC2+/− and EPAC2−/− mice exhibited fewer cells within columns compared with EPAC2+/+ mice in the ACC (one-way ANOVA with Tukey's post test; F(2,37) = 17.47, p < 0.0001; Fig. 5A,B). In addition, EPAC2+/− and EPAC2−/− mice had significantly increased cell spacing within cell columns compared with EPAC2+/+ mice within the ACC (one-way ANOVA with Tukey's post test; F(2,37) = 14.33, p < 0.0001; Fig. 5C). Surprisingly, this result was specific to the ACC, as we found no difference in cell numbers per column or spacing within columns in the somatosensory cortex (one-way ANOVA; cells per column: F(2,31) = 0.3906, p = 0.6799; cell spacing: F(2,32) = 0.2594, p = 0.7731; Figure 5D–F).Together, these data suggest that cell column organization is disrupted in the ACC, but not the somatosensory cortex, of Epac2-deficient mice.
Figure 4.
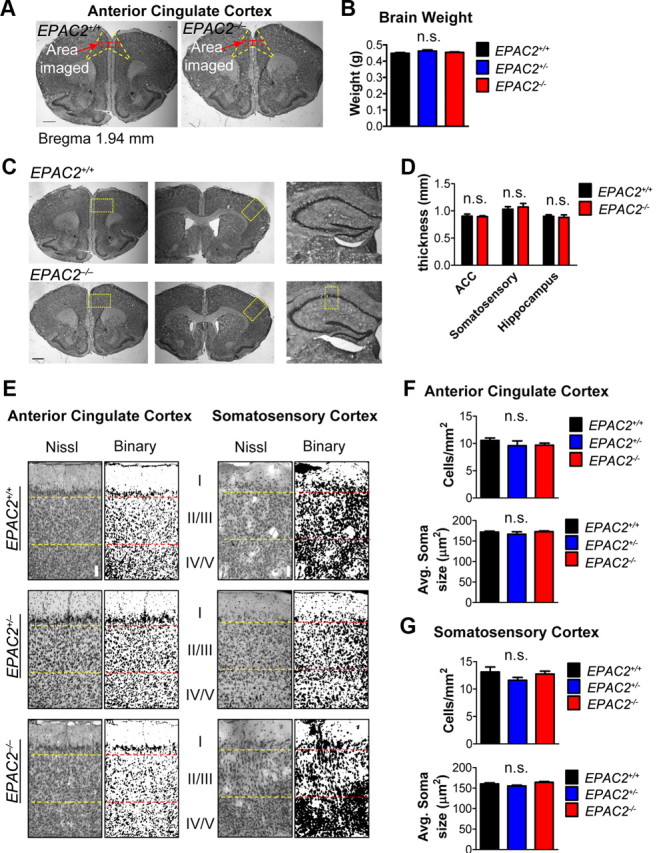
Gross cortical organization is not disrupted in Epac2-deficient mice. A, Nissl-stained coronal sections from EPAC2+/+, EPAC2+/−, and EPAC2−/− mice. Yellow lines delineate ACC, and red boxes indicate regions imaged for cortical column measurements. B, Brain weight at 8 weeks postnatal is not different across genotypes. One-way ANOVA. n = 11 animals/genotype. C, Shows 4× images of Nissl-stained coronal sections from EPAC2+/+ and EPAC2−/− mice. Yellow boxes indicate regions used for cortical thickness measurements in D. Hippocampal regions in EPAC2+/+ and EPAC2−/− mice have similar gross morphologies. D, Cortical thicknesses of frontal, somatosensory, and hippocampal regions in EPAC2+/+ and EPAC2−/− coronal sections are not changed between genotypes. Student's t tests. E, Nissl staining and binarized images of ACC (left) and somatosensory cortex (right) from EPAC2+/+, EPAC2+/−, and EPAC2−/− mice. F, Cell density and average soma size do not differ across genotypes. One-way ANOVA. G, Quantification of cell density and average soma size in the somatosensory cortex. One-way ANOVA. n = 5–6 animals/genotype, two sections per animal. Scale bars: A, C, 1 mm; E, 100 μm.
Figure 5.
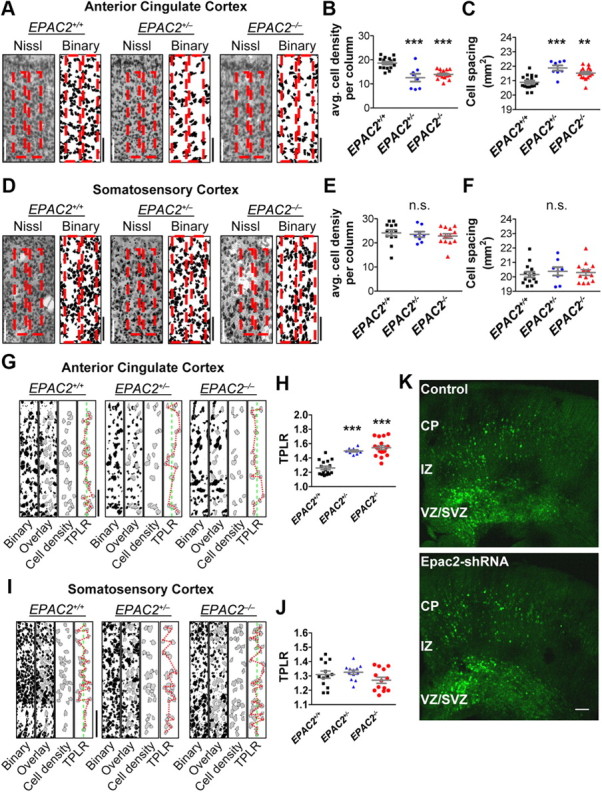
Cortical columnar organization in the ACC is disrupted in Epac2-deficient mice. A, Layer 2/3 of Nissl staining (left) and binarized (right) images of ACC in EPAC2+/+, EPAC2+/−, and EPAC2−/− mice. Red boxes indicate representative cortical columns from Figure 4E. B, Average cell density per column in the ACC is reduced in EPAC2−/− compared with EPAC2+/+. One-way ANOVA with Tukey's post hoc test. C, Cell spacing in the ACC is increased in EPAC2+/− and EPAC2−/− compared with EPAC2+/+. One-way ANOVA with Tukey's post hoc test. D, Nissl staining (left) and binarized images (right) of layers 1–3 of somatosensory cortex from EPAC2+/+, EPAC2+/−, and EPAC2−/− mice. Red boxes indicate representative cortical columns from Figure 4E. E, Average cell density per column in somatosensory cortex is not different across genotypes. One-way ANOVA with Tukey's post hoc test. F, Cell spacing in somatosensory cortex is not different across genotypes. One-way ANOVA with Tukey's post hoc test. G, Cortical column analysis in the ACC from EPAC2+/+, EPAC2+/−, and EPAC2−/− mice. Binarized images were filtered by area for pyramidal cell bodies and excluded cell bodies that were touching the cortical column edge. The TPLR was calculated for cells within each column. H, Quantification of TPLR in the ACC revealed an increase in TPLR in EPAC2−/− cortical columns. One-way ANOVA with Tukey's post hoc tests. I, Binarized images of cortical columns in the somatosensory cortex from EPAC2+/+, EPAC2+/−, and EPAC2−/− mice. J, Quantification of TPLR in somatosensory cortex revealed no difference across genotypes. One-way ANOVA with Tukey's post hoc test. ***p < 0.001; 7–10 columns per section, two sections per animal, 5–6 animals per genotype. K, In utero electroporation of control vector or Epac2-shRNA, along with pCAG-eGFP, into EPAC2+/+ cortex reveals no change in neuronal migration upon Epac2 knockdown. Animals were electroporated at E14.5 and fixed and sectioned at P0–P1. Scale bars: A,D,G,I, 100 μm; K, 500 μm.
To expand on these findings, we next measured the TPLR between cells within a column, a measurement of linearity of cell columns (Buxhoeveden et al., 2000). The path between cells is divided by the linear depth of a column, and the assumption is that an organized column would have a TPLR close to 1 (the TPLR of a hypothetical column where all the cells lie on a central line), whereas a disorganized column would have a TPLR larger than 1 (Buxhoeveden et al., 2000). This analysis revealed that EPAC2+/− and EPAC2−/− mice had a larger TPLR in cell columns from layer 2/3 of the ACC compared with wild-type littermates (TPLR: EPAC2+/+, 1.2 ± 0.02, EPAC2+/−, 1.5 ± 0.02, EPAC2−/−, 1.6 ± 0.2; one-way ANOVA with Tukey's post test; F(2,39) = 36.21, p < 0.0001; Fig. 5G,H). We did not detect any differences in the TPLR of layer 2/3 cell columns in the somatosensory cortex across genotypes (TPLR: EPAC2+/+, 1.3 ± 0.02, EPAC2+/−, 1.3 ± 0.2, EPAC2−/−, 1.3 ± 0.2; one-way ANOVA with Tukey's post test; F(2,35) = 1.823, p = 0.1766; Fig. 5I,J).
Abnormal organization of cortical columns may be caused by defects in neuronal migration (Torii et al., 2009). To investigate whether loss of Epac2 could affect neuronal migration, we compared the migration pattern of Epac2-deficient neurons with neurons expressing normal Epac2 levels in the frontal association cortex. We electroporated in utero a plasmid encoding a previously described Epac2-specific shRNA (Epac2-shRNA) (Woolfrey et al., 2009), which coexpresses GFP, into the developing cortex of E14.5 embryos and examined localization of GFP-expressing neurons at P0. We have previously shown that this shRNA construct effectively knocks down Epac2 expression both in vitro and in vivo (Woolfrey et al., 2009; Srivastava et al., 2012). We did not detect any obvious abnormal localization of fluorescent neurons within the ventricular/subventricular zones, intermediate zone, or cortical plate in Epac2-shRNA positive brains compared with control brains (Fig. 5K), suggesting that migration deficiencies are not likely to account for the observed disorganized columnar organization.
Collectively, these data demonstrate that Epac2-deficient mice exhibit alterations in columnar organization in the ACC, a cortical area implicated in social interactions, but not in the somatosensory cortex.
General characterization of cellular phenotypes in Epac2-deficient mice
To explore possible changes in Epac2-dependent signaling at the cellular level, we examined Epac2, Epac1, and Rap1 expression in cortex of 8-week-old wild-type and Epac2-deficient mice. As expected, Epac2 protein was not detectable in EPAC2−/− mice, while EPAC2+/− mice had 50% of wild-type levels of Epac2 (one-way ANOVA with Tukey's post test; F(2,6) = 358.2, p < 0.0001; Fig. 6A,B). We did not observe differences in Epac1 or Rap1 expression between genotypes, indicating the absence of compensatory mechanisms through upregulation of either protein (one-way ANOVA; p > 0.05; Fig. 6A,B). Examination of major synaptic proteins and Epac2-interacting proteins (Woolfrey et al., 2009) in wild-type and EPAC2−/− mice did not detect overall changes in the levels of any of these proteins (Student's t tests, p > 0.05; Fig. 6B).
Figure 6.

Loss of Epac2 does not alter cortical Epac1 or Rap1 levels, but impairs 8-CPT-induced activation of BRaf in dendrites. A, Epac2 protein levels are decreased in cortical lysates from EPAC2+/− mice and absent in lysates from EPAC2−/− mice. Epac1 and Rap1 protein levels are unchanged. B, Relative intensity of Epac2, Epac1, and Rap1 protein levels in A. n = 3 animals/genotype. One-way ANOVA with Tukey's post test (p < 0.0001). C, Quantification of synaptic protein levels normalized to β-actin in cortical lysates from mice with the indicated genotypes. Genotype has no effect on levels of any proteins examined. Student's t tests; n = 5 animals/genotype. D, Rap activation assay from cortical tissue reveals no change in active Rap levels with genotype. E, Quantification of active Rap levels in C. One-way ANOVA; n = 3–6 animals/genotype. F–G, Treatment of cultured cortical neurons from EPAC2+/+ mice (P0 + DIV 24) with 8-CPT (1 h, 50 μm) increased p-BRaf immunofluorescence intensity in dendrites. Epac2-WT overexpression in EPAC2+/+ neurons induced an enhancement of p-BRaf fluorescence in response to 8-CPT treatment. One-way ANOVA with Tukey's post test; n = 4–6 cells/condition from two independent cultures. H–I, 8-CPT treatment of EPAC2−/− neurons did not increase p-BRaf fluorescence. Overexpression of Epac2-WT in EPAC2−/− neurons (P0 + DIV 24) increased p-BRaf intensity, and 8-CPT treatment induced an additional increase in p-BRaf fluorescence in Epac2-WT-expressing EPAC2−/− neurons. One-way ANOVA with Tukey's post test; n = 5–10 cells/condition from two independent cultures. # indicates comparison between Epac2-WT and Epac2-WT + 8-CPT. #,**p < 0.01; ***p < 0.001. Error bars indicate SEM. Scale bars: F, H, 5 μm.
As Epac2 is a GEF for the small GTPase Rap, we assessed the impact of Epac2 loss on levels of total and active Rap1 in homogenates of frontal cortex of wild-type and Epac2-deficient mice (Fig. 6D,E). Surprisingly, we did not observe any differences in overall total Rap1 or Rap1-GTP levels between genotypes (one-way ANOVA; F(2,9) = 0.2212, p = 0.8058; Fig. 6D,E). To test in situ whether Epac1 could be activated to compensate for Epac2 loss in Epac2-deficient neurons, we treated mature cultured cortical neurons from either EPAC2+/+ or EPAC2−/− mice with 8-CPT (50 μm, 1 h), and measured the levels of p-BRaf immunofluorescence, an in situ readout for Rap and Ras activation (Woolfrey et al., 2009) (Fig. 6F–I). As expected, p-BRaf levels were significantly increased in response to 8-CPT treatment in EPAC2+/+ neurons (one-way ANOVA with Tukey's post test; F(3,15) = 42.26, p < 0.0001; Fig. 6F,G). Furthermore, overexpression of Epac2 was sufficient to increase basal levels of p-BRaf, which could be further activated by 8-CPT (Fig. 6F,G). In contrast, EPAC2−/− neurons were not responsive to 8-CPT treatment (one-way ANOVA with Tukey's post test; F(3,21) = 30.00, p < 0.0001; Fig. 6H,I), suggesting that Epac1 function was not upregulated in Epac2-deficient mice. However, ectopic expression of Epac2 in EPAC2−/− cultures increased basal levels of p-BRaf and rescued the lack of p-BRaf in response to 8-CPT treatment (Fig. 6H,I). These data indicate that Epac1 activity is not compensating for Epac2 loss in Epac2-deficient neurons in response to 8-CPT, suggesting that the behavioral, morphological, and molecular phenotypes observed in EPAC2−/− mice are due to the loss of Epac2 and not Epac1 upregulation.
Abnormal dendritic spine dynamics in vivo in Epac2-deficient mice
Abnormalities in excitatory synapse morphology have been reported in several transgenic mouse lines that also display social and communication deficits (Hines et al., 2008; Cahill et al., 2009; Bangash et al., 2011). Furthermore, dendritic spine numbers and morphology are thought to be important determinants of connectivity within and between cortical columns (Chklovskii, 2004). Because in cultured neurons Epac2 regulated dendritic spine morphology and motility (Woolfrey et al., 2009), we hypothesized that Epac2 deficiency might alter spine morphology and motility in vivo. We thus used intravital two-photon microscopy to examine the role of Epac2 in controlling dendritic spine dynamics in vivo. We crossed EPAC2−/− mice with a thy1-GFP-M strain of mice, which sparsely express GFP in cortical pyramidal neurons (Feng et al., 2000), for at least seven generations to produce EPAC2+/−,GFP mice. EPAC2+/−,GFP × EPAC2+/−,GFP were established to generate EPAC2+/+,GFP, EPAC2+/−,GFP and EPAC2−/−,GFP littermate mice.
We first assessed dendritic spine morphology in mice by imaging apical tufts, perpendicular to the pia and lying between 15 and 40 μm from the pia surface, of GFP-positive neurons in the frontal cortex of EPAC2+/+,GFP, EPAC2+/−,GFP, and EPAC2−/−,GFP (Fig. 7A). Quantitative analysis of images revealed that EPAC2−/−,GFP mice had significantly reduced dendritic spine density compared with wild-type littermates (one-way ANOVA with Tukey's post test; F(2,33) = 3.818, p = 0.0322; Fig. 7A,B). Interestingly, when we examined linear density according to spine classification (stubby, mushroom, thin, and filopodia), we found that both EPAC2+/−,GFP and EPAC2−/−,GFP mice had significantly fewer filopodia, and that EPAC2−/−,GFP] mice had significantly fewer thin spines [mixed model (genotype × spine class) ANOVA with Bonferroni post test; genotype: F(2,132) = 7.229, p = 0.001; spine class: F(3,132) = 70.44, p < 0.0001; interaction: F(6,132) = 3.436, p = 0.0035; Figure 7C]. There were no changes in spine length, either by examining the total number of spines or according to spine class [one-way ANOVA; F(2,33) = 0.1178, p = 0.8892; mixed model (genotype × spine class) ANOVA; genotype: F(2,699) = 2.844, p = 0.0589; Figure 7D, E].
Figure 7.
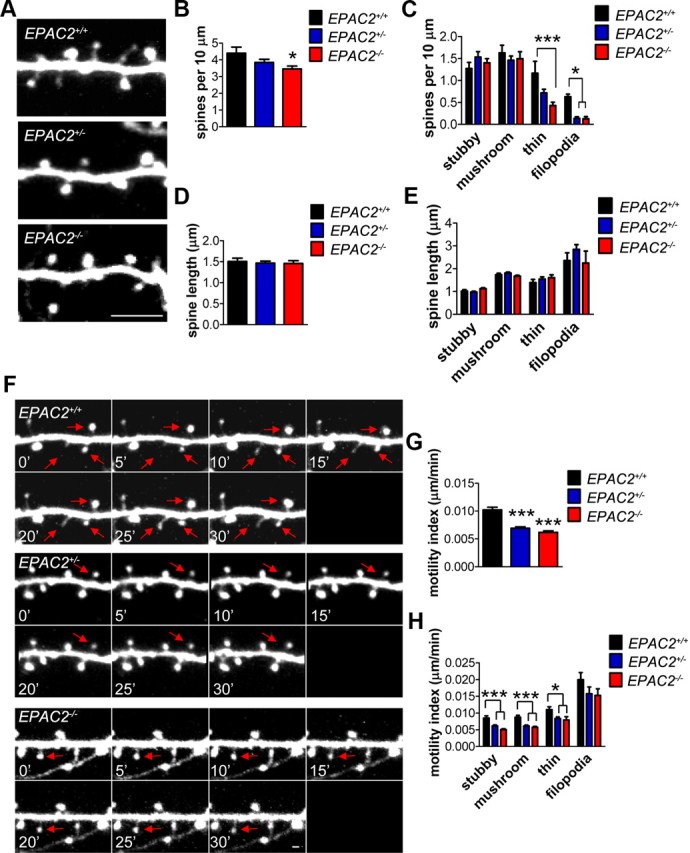
Altered linear density and abnormal dendritic spine dynamics in vivo in Epac2-deficient mice. A, Representative 2PLSM images of dendritic spines on apical tuft from EPAC2+/+, +/−, −/− × thy1-GFP mice. Mice underwent a craniotomy, which was filled with 1.5% agar and sealed with a coverslip, followed by multiphoton in vivo imaging. B, Quantification of average spine linear density in A. One-way ANOVA with Tukey's post hoc test. C, Quantification of average linear density of spines classified by morphology (stubby, mushroom, thin, and filopodia); 3 (genotype) × 4 (spine class) mixed model ANOVA with Bonferroni post test. D, Quantification of average spine length in A. One-way ANOVA with Tukey's post hoc test. E, Quantification of average length of spines classified by morphology (stubby, mushroom, thin, and filopodia). F, Representative time-lapse images of dendritic spines from each genotype during 30 min imaging session. Red arrows indicate spines that exhibit motility. G, EPAC2+/−,GFP and EPAC2−/−,GFP mice exhibit decreased dendritic spine motility indices. One-way ANOVA with Tukey's post hoc test. H, Quantification of motility index of dendritic spines classified by morphology (stubby, mushroom, thin, and filopodia); 3 (genotype) × 4 (spine class) mixed model ANOVA with Bonferroni post test. *p < 0.05, ***p < 0.001; 2–5 neurons per animal, 3–4 animals per genotype. Scale bars: A, 5 μm; F, 1 μm.
The morphology of spines often correlates with their dynamic properties. Thinner spines and filopodia are highly dynamic and display high levels of motility, while stubby or larger mushroom-shaped spines are more stable and thus less motile (Holtmaat et al., 2006). As Epac2 has been shown to control motility of spines in vitro (Woolfrey et al., 2009), and due to the specific loss of thin and filopodia spines, we assessed the motility of dendritic spines in vivo in all genotypes. All types of motility, including retraction, elongation, and formation, were evident in wild-type animals. We calculated a motility index by determining the average absolute change in length per unit time: a high index represents a high level of motility, whereas a low index would indicate reduced motility. Time-lapse imaging of dendritic spines revealed that EPAC2+/−,GFP and EPAC2−/−,GFP mice had significantly reduced motility compared with EPAC2+/+,GFP mice (one-way ANOVA with Tukey's post test; F(2,708) = 33.05, p < 0.0001; Fig. 7F,G). When we examined motility according to spine class, we observed a reduction in the motility of stubby, mushroom, and thin spine types in EPAC2+/−,GFP and EPAC2−/−,GFP mice (two-way ANOVA with Bonferroni post test; genotype: F(2,693) = 25.92, p < 0.0001; spine class: F(3,693) = 126.7, p < 0.0001; Figure 7H).Together, these data indicate that loss of Epac2 reduces spine numbers and impairs spine motility in the frontal cortex.
Discussion
Here we report that mice lacking one or both copies of the EPAC2 gene, encoding a PKA-independent cAMP target, exhibited specific impairments in social and communication behavior. In contrast, these mice did not show motor abnormalities, olfactory disruption, repetitive behaviors, working or reference memory deficits, or altered anxiety levels. Epac2-deficient mice also displayed specific alterations in cortical columnar organization in the ACC, a cortical region associated with social and communication behavior, but not in the somatosensory cortex. In addition, we observed reduced dendritic spine numbers and motility in cortical neurons in Epac2-deficient mice. These findings point toward a role for Epac2 signaling in regulating social behaviors and cortical organization and connectivity, providing novel insight into the molecular and cellular substrates of social and communication behavior (Fig. 8).
Figure 8.

Social communication deficits and abnormal cortical structure and synapses in Epac2-deficient mice. In mice lacking Epac2 (EPAC2−/−), the link between cAMP signaling and activation of the downstream target of Epac2, called Rap, is disrupted. Examination of a number of behavioral abilities of these mice revealed a specific deficit in social and communication behaviors, while learning and memory behaviors were intact. Furthermore, these mice exhibited disorganized cortical columns in a region of the brain that is thought to underlie social behaviors. Finally, dendritic spines in mice lacking Epac2 were fewer in number and less motile than in normal mice, suggesting a structural disruption at the site of connections between neurons.
The specificity of social behavioral deficits in Epac2-deficient mice, with intact spatial reference and working memory, was unexpected. Manipulations of a number of genes, including NLGN3 and SHANK3, have been linked to social and communication phenotypes in mice (Radyushkin et al., 2009; Peça et al., 2011; Wang et al., 2011). These mouse lines also exhibit deficits in spatial and working memory, making it difficult to dissect the relationship between these phenotypes and the underlying genotypes. In contrast, in an enhanced polyubiquitinated Shank3 mouse model, mutant mice performed equally well as wild-type mice in cognitive tasks, but displayed deficits in social behaviors (Bangash et al., 2011), similar to Epac2-deficient mice. As Epac2-deficient mice exhibit specific impairments in sociability, but not in cognitive or motor behaviors, our data might provide insight into the molecular and cellular bases of social and communication behavior, distinct from other cognitive behaviors. Importantly, Epac2-deficient mice displayed normal responses to both social and nonsocial odor cues. This finding suggests that abnormal sociability in Epac2-deficient mice does not occur at the level of olfaction, but may be due to perturbations in higher level processing. Furthermore, our finding that both heterozygous and homozygous knock-out genotypes displayed the same degree of deficits in sociability suggests that near-wild-type levels of Epac2 signaling might be required to mediate normal social processing and behavioral output.
Epac2-deficient mice displayed region-specific alterations in the columnar organization of the cortex. Dysfunction and structural alterations of specific cortical regions have been linked to deficits in social and communication behaviors, in humans, nonhuman primates, and rodents (Casanova et al., 2009; Jürgens, 2009). A number of studies have demonstrated that the frontal cortex, specifically the ACC, plays an important role both in social behavior and control of vocalization in mammals (Rushworth et al., 2007; Jürgens, 2009; Fischer and Hammerschmidt, 2011). It is hypothesized that neurons organized into columns, sometimes called minicolumns, form the functional working unit within this area (Casanova et al., 2009; Rakic, 2009). Indeed, several human postmortem studies of subjects with autism spectrum disorder, disorders comorbid with autism, or schizophrenia, have reported abnormalities in the columnar organization of the ACC (Benes et al., 2001; Casanova et al., 2003). Minicolumnar alterations have also been reported in dyslexia (Casanova et al., 2002), suggesting a potential role in language circuits. Our cytoarchitectural data reveal an unexpected role for Epac2 in the organization of cortical columns specifically in the ACC, and suggest that disruption of cortical organization in this region might be related to social and communication behavioral deficits. The lack of any alteration in laminar organization supports our finding that neuronal migration was not altered in Epac2-deficient mice. The concordance of these data emphasizes the specificity of the alteration at the level of columnar organization in Epac2-deficient mice.
The molecular underpinnings of spine motility and stability in vivo are not well understood. As differences in spine dynamics have been observed between in vitro and in vivo conditions, in vivo analysis is likely to provide a much more physiological indication of spine plasticity. We observed that Epac2-deficient mice had fewer spines and significantly reduced motility compared with wild-type mice. This is consistent with our previous findings in vitro, where Epac2 bidirectionally regulates spine shrinkage and increased spine motility (Woolfrey et al., 2009). It is posited that spine morphology correlates with spine dynamic properties; thinner and filopodia-like spines are more dynamic than stubby or mushroom-shaped spines (Holtmaat et al., 2006). Epac2-deficient mice displayed reduced motility in all spine types. This suggests that Epac2 plays a role in determining the overall level of motility in all spine types, and that motility of more “mature” spine morphologies was still readily observed at 4 weeks postnatal in our preparation. In addition, loss of Epac2 in vivo caused spine loss, indicating a role for Epac2 in maintaining normal synapse density in vivo. Together these data indicate that Epac2-deficient mice display fewer dendritic spines and reduced overall spine motility in the frontal cortex, which may contribute to connectivity or behavioral deficits seen in these mice. Furthermore, our data provide a molecular mechanism for spine motility in vivo, and further establish the link between PKA-independent cAMP and Rap signaling with spine dynamics.
A recently published study provided strong evidence supporting a role for Epac in hippocampal function. Loss of both EPAC1 and EPAC2 genes, in EPAC-null mice, resulted in deficits in presynaptic release and long-term potentiation in the hippocampus, social interaction and juvenile play, and spatial reference memory (Yang et al., 2012b). Interestingly, Yang et al. (2012b) did not observe any impairment in social interaction in EPAC2-null mice, contrasting from the results in the current study. Importantly, differences between the background strain used, and methodology used to test sociability may underlie the differences between the current study and Yang et al. (2012b). Robust differences in sociability between C57BL/6 (background strain used in the current study) and 129sv (background stain used by Yang et al., 2012b) mice have been reported. Specifically, C57BL/6 displayed significant levels of sociability, whereas 129sv mice did not (Moy et al., 2007). Low sociability in 129sv mice may be due, in part, to high anxiety-like behaviors and low exploratory locomotion (Moy et al., 2007). Thus, low sociability in the 129sv background strain may occlude all but the most drastic genetic effects on sociability, such as loss of both EPAC genes. Furthermore, as Epac1 is expressed highly in the olfactory bulb (Kawasaki et al., 1998), it is not clear whether loss of this gene has an impact on olfaction, and thus on sociability, in EPAC-null mice. Another distinction between the two studies is the differences seen in dendritic spine structure. No differences in spine density were seen in Golgi-Cox stained CA1 hippocampal neurons in EPAC-null mice (Yang et al., 2012b). On the other hand, in the current study, intravital imaging of dendritic spines of cortical neurons in the frontal association cortex demonstrated a reduction in spine density and reduced motility in Epac2-deficient mice, consistent with previous in vitro studies (Woolfrey et al., 2009). It is likely that a combination of methodology used to image dendritic spines and brain region examined are the basis for the differences in spine morphology between the two studies.
Here we focus on cortical organization, cortical spine motility, and cortically based behaviors. Additionally, we analyze spatial working memory, a behavior that relies on the frontal cortex as well as the hippocampus in mice (Goldman-Rakic, 1995), and measurement of social contact and USVs in the context of naive male–female interactions, providing additional behavioral data that underscore the specificity and severity of social deficits in Epac2-deficient mice. Furthermore, we find that while gross morphology of brain regions, including the hippocampus, was unaltered, detailed analysis revealed disruptions in columnar organization in EPAC2+/− and EPAC2−/− mice in a particular cortical region relevant for social behaviors. Specifically, we find that organization and spacing of cells within cortical columns is altered in the absence of Epac2. Together with the evidence for altered dendritic spine motility in vivo, these data emphasize a role for Epac2 in regulating cortical structure and function.
The EPAC2 gene has been implicated in a number of psychiatric disorders. It is located at 2q31–q32, a region identified by several genome-wide linkage studies as an important autism susceptibility locus (Buxbaum et al., 2001; Shao et al., 2002). Recent studies also identified several copy number variants (CNVs) in this region in patients with autism, as well as enrichments of CNVs disrupting genes involved in GTPase/Ras signaling in autistic patients (Marshall et al., 2008; Pinto et al., 2010). Several rare mutations in the EPAC2 gene have been identified in subjects with autism (Bacchelli et al., 2003), and interestingly, several of the mutations altered protein function and spine morphology (Woolfrey et al., 2009). Because abnormal social and communication behavior is characteristic for a number of neurodevelopmental and neuropsychiatric disorders, understanding Epac2 function in vivo may provide insight into the pathogenesis of these diseases.
Footnotes
This work was supported by the National Alliance for Autism Research, the National Alliance for Research on Schizophrenia and Depression (NARSAD), the Alzheimer's Association, Brain Research Foundation, and National Institutes of Health (NIH) Grants 2R01MH071316 and 1R01MH097216 (P.P.); a pre-doctoral American Heart Association (AHA) fellowship (K.M.W.); a post-doctoral AHA fellowship, a NARSAD Young Investigators award, and a Royal Society International Exchange Grant (D.P.S.); NIH Grant F31MH085362 (K.A.J.); NIH Grant 1R01MH094835 (J.B.); The Ralph and Marian Falk Medical Research Trust Chicago, IL (J.R.M.); NIH Grants 1R01MH-086784 and 1R01HD-065279 (M.F.C.); NIH Grant 5R21MH085117-02 and a Brain Research Foundation Grant BRF SG 2010-13 (J.W.); and a National Institute of Neurological Disorders and Stroke Grant to the Northwestern University Multi-Photon Core (P30NS054850). EPAC2-null mice were generated by Professor Susumu Seino (Kobe University Graduate School of Medicine). This work was supported by the Northwestern University Behavioral Phenotyping Core, and we thank John Linardakis for assistance with behavioral testing. We thank Katharine R. Smith and Natalie C. Tronson for critical reading of this manuscript.
The authors declare no competing financial interests.
References
- Bacchelli E, Blasi F, Biondolillo M, Lamb JA, Bonora E, Barnby G, Parr J, Beyer KS, Klauck SM, Poustka A, Bailey AJ, Monaco AP, Maestrini E. Screening of nine candidate genes for autism on chromosome 2q reveals rare nonsynonymous variants in the cAMP-GEFII gene. Mol Psychiatry. 2003;8:916–924. doi: 10.1038/sj.mp.4001340. [DOI] [PubMed] [Google Scholar]
- Bangash MA, Park JM, Melnikova T, Wang D, Jeon SK, Lee D, Syeda S, Kim J, Kouser M, Schwartz J, Cui Y, Zhao X, Speed HE, Kee SE, Tu JC, Hu JH, Petralia RS, Linden DJ, Powell CM, Savonenko A, et al. Enhanced polyubiquitination of Shank3 and NMDA receptor in a mouse model of autism. Cell. 2011;145:758–772. doi: 10.1016/j.cell.2011.03.052. [DOI] [PMC free article] [PubMed] [Google Scholar] [Retracted]
- Benes FM, Vincent SL, Todtenkopf M. The density of pyramidal and nonpyramidal neurons in anterior cingulate cortex of schizophrenic and bipolar subjects. Biol Psychiatry. 2001;50:395–406. doi: 10.1016/s0006-3223(01)01084-8. [DOI] [PubMed] [Google Scholar]
- Burgdorf J, Wood PL, Kroes RA, Moskal JR, Panksepp J. Neurobiology of 50-kHz ultrasonic vocalizations in rats: electrode mapping, lesion, and pharmacology studies. Behav Brain Res. 2007;182:274–283. doi: 10.1016/j.bbr.2007.03.010. [DOI] [PubMed] [Google Scholar]
- Buxbaum JD, Silverman JM, Smith CJ, Kilifarski M, Reichert J, Hollander E, Lawlor BA, Fitzgerald M, Greenberg DA, Davis KL. Evidence for a susceptibility gene for autism on chromosome 2 and for genetic heterogeneity. Am J Hum Genet. 2001;68:1514–1520. doi: 10.1086/320588. [DOI] [PMC free article] [PubMed] [Google Scholar]
- Buxhoeveden DP, Switala AE, Roy E, Casanova MF. Quantitative analysis of cell columns in the cerebral cortex. J Neurosci Methods. 2000;97:7–17. doi: 10.1016/s0165-0270(99)00192-2. [DOI] [PubMed] [Google Scholar]
- Cahill ME, Xie Z, Day M, Photowala H, Barbolina MV, Miller CA, Weiss C, Radulovic J, Sweatt JD, Disterhoft JF, Surmeier DJ, Penzes P. Kalirin regulates cortical spine morphogenesis and disease-related behavioral phenotypes. Proc Natl Acad Sci U S A. 2009;106:13058–13063. doi: 10.1073/pnas.0904636106. [DOI] [PMC free article] [PubMed] [Google Scholar]
- Casanova MF, Buxhoeveden DP, Cohen M, Switala AE, Roy EL. Minicolumnar pathology in dyslexia. Ann Neurol. 2002;52:108–110. doi: 10.1002/ana.10226. [DOI] [PubMed] [Google Scholar]
- Casanova MF, Buxhoeveden D, Gomez J. Disruption in the inhibitory architecture of the cell minicolumn: implications for autism. Neuroscientist. 2003;9:496–507. doi: 10.1177/1073858403253552. [DOI] [PubMed] [Google Scholar]
- Casanova MF, Trippe J, 2nd, Tillquist C, Switala AE. Morphometric variability of minicolumns in the striate cortex of Homo sapiens, Macaca mulatta, and Pan troglodytes. J Anat. 2009;214:226–234. doi: 10.1111/j.1469-7580.2008.01027.x. [DOI] [PMC free article] [PubMed] [Google Scholar]
- Chklovskii DB. Synaptic connectivity and neuronal morphology: two sides of the same coin. Neuron. 2004;43:609–617. doi: 10.1016/j.neuron.2004.08.012. [DOI] [PubMed] [Google Scholar]
- Cook MN, Crounse M, Flaherty L. Anxiety in the elevated zero-maze is augmented in mice after repeated daily exposure. Behav Genet. 2002;32:113–118. doi: 10.1023/a:1015249706579. [DOI] [PubMed] [Google Scholar]
- Di Rosa E, Crow TJ, Chance SA. Axon bundle spacing in the anterior cingulate cortex of the human brain. J Clin Neurosci. 2008;15:1389–1392. doi: 10.1016/j.jocn.2008.01.018. [DOI] [PubMed] [Google Scholar]
- Feng G, Mellor RH, Bernstein M, Keller-Peck C, Nguyen QT, Wallace M, Nerbonne JM, Lichtman JW, Sanes JR. Imaging neuronal subsets in transgenic mice expressing multiple spectral variants of GFP. Neuron. 2000;28:41–51. doi: 10.1016/s0896-6273(00)00084-2. [DOI] [PubMed] [Google Scholar]
- Fischer J, Hammerschmidt K. Ultrasonic vocalizations in mouse models for speech and socio-cognitive disorders: insights into the evolution of vocal communication. Genes Brain Behav. 2011;10:17–27. doi: 10.1111/j.1601-183X.2010.00610.x. [DOI] [PMC free article] [PubMed] [Google Scholar]
- Gelinas JN, Banko JL, Peters MM, Klann E, Weeber EJ, Nguyen PV. Activation of exchange protein activated by cyclic-AMP enhances long-lasting synaptic potentiation in the hippocampus. Learn Mem. 2008;15:403–411. doi: 10.1101/lm.830008. [DOI] [PMC free article] [PubMed] [Google Scholar]
- Goldman-Rakic PS. Cellular basis of working memory. Neuron. 1995;14:477–485. doi: 10.1016/0896-6273(95)90304-6. [DOI] [PubMed] [Google Scholar]
- Hettinger JA, Liu X, Schwartz CE, Michaelis RC, Holden JJ. A DRD1 haplotype is associated with risk for autism spectrum disorders in male-only affected sib-pair families. Am J Med Genet B Neuropsychiatr Genet. 2008;147B:628–636. doi: 10.1002/ajmg.b.30655. [DOI] [PubMed] [Google Scholar]
- Hines RM, Wu L, Hines DJ, Steenland H, Mansour S, Dahlhaus R, Singaraja RR, Cao X, Sammler E, Hormuzdi SG, Zhuo M, El-Husseini A. Synaptic imbalance, stereotypies, and impaired social interactions in mice with altered neuroligin 2 expression. J Neurosci. 2008;28:6055–6067. doi: 10.1523/JNEUROSCI.0032-08.2008. [DOI] [PMC free article] [PubMed] [Google Scholar]
- Holtmaat A, Wilbrecht L, Knott GW, Welker E, Svoboda K. Experience-dependent and cell-type-specific spine growth in the neocortex. Nature. 2006;441:979–983. doi: 10.1038/nature04783. [DOI] [PubMed] [Google Scholar]
- Holy TE, Guo Z. Ultrasonic songs of male mice. PLoS Biol. 2005;3:e386. doi: 10.1371/journal.pbio.0030386. [DOI] [PMC free article] [PubMed] [Google Scholar]
- Jamain S, Quach H, Betancur C, Råstam M, Colineaux C, Gillberg IC, Soderstrom H, Giros B, Leboyer M, Gillberg C, Bourgeron T. Mutations of the X-linked genes encoding neuroligins NLGN3 and NLGN4 are associated with autism. Nat Genet. 2003;34:27–29. doi: 10.1038/ng1136. [DOI] [PMC free article] [PubMed] [Google Scholar]
- Jürgens U. The neural control of vocalization in mammals: a review. J Voice. 2009;23:1–10. doi: 10.1016/j.jvoice.2007.07.005. [DOI] [PubMed] [Google Scholar]
- Kawasaki H, Springett GM, Mochizuki N, Toki S, Nakaya M, Matsuda M, Housman DE, Graybiel AM. A family of cAMP-binding proteins that directly activate Rap1. Science. 1998;282:2275–2279. doi: 10.1126/science.282.5397.2275. [DOI] [PubMed] [Google Scholar]
- Kelley DJ, Bhattacharyya A, Lahvis GP, Yin JC, Malter J, Davidson RJ. The cyclic AMP phenotype of fragile X and autism. Neurosci Biobehav Rev. 2008;32:1533–1543. doi: 10.1016/j.neubiorev.2008.06.005. [DOI] [PMC free article] [PubMed] [Google Scholar]
- Kelly MP, Stein JM, Vecsey CG, Favilla C, Yang X, Bizily SF, Esposito MF, Wand G, Kanes SJ, Abel T. Developmental etiology for neuroanatomical and cognitive deficits in mice overexpressing Galphas, a G-protein subunit genetically linked to schizophrenia. Mol Psychiatry. 2009;14:398–415. 347. doi: 10.1038/mp.2008.124. [DOI] [PMC free article] [PubMed] [Google Scholar]
- Marshall CR, Noor A, Vincent JB, Lionel AC, Feuk L, Skaug J, Shago M, Moessner R, Pinto D, Ren Y, Thiruvahindrapduram B, Fiebig A, Schreiber S, Friedman J, Ketelaars CE, Vos YJ, Ficicioglu C, Kirkpatrick S, Nicolson R, Sloman L, et al. Structural variation of chromosomes in autism spectrum disorder. Am J Hum Genet. 2008;82:477–488. doi: 10.1016/j.ajhg.2007.12.009. [DOI] [PMC free article] [PubMed] [Google Scholar]
- Morozov A, Muzzio IA, Bourtchouladze R, Van-Strien N, Lapidus K, Yin D, Winder DG, Adams JP, Sweatt JD, Kandel ER. Rap1 couples cAMP signaling to a distinct pool of p42/44MAPK regulating excitability, synaptic plasticity, learning, and memory. Neuron. 2003;39:309–325. doi: 10.1016/s0896-6273(03)00404-5. [DOI] [PubMed] [Google Scholar]
- Moy SS, Nadler JJ, Young NB, Perez A, Holloway LP, Barbaro RP, Barbaro JR, Wilson LM, Threadgill DW, Lauder JM, Magnuson TR, Crawley JN. Mouse behavioral tasks relevant to autism: phenotypes of 10 inbred strains. Behav Brain Res. 2007;176:4–20. doi: 10.1016/j.bbr.2006.07.030. [DOI] [PMC free article] [PubMed] [Google Scholar]
- Muller JM, Moore H, Myers MM, Shair HN. Dopamine's role in social modulation of infant isolation-induced vocalization: II. Maternally modulated infant separation responses are regulated by D1- and D2-family dopamine receptors. Dev Psychobiol. 2009;51:158–172. doi: 10.1002/dev.20355. [DOI] [PMC free article] [PubMed] [Google Scholar]
- Nestler EJ, Barrot M, DiLeone RJ, Eisch AJ, Gold SJ, Monteggia LM. Neurobiology of depression. Neuron. 2002;34:13–25. doi: 10.1016/s0896-6273(02)00653-0. [DOI] [PubMed] [Google Scholar]
- Oblak AL, Rosene DL, Kemper TL, Bauman ML, Blatt GJ. Altered posterior cingulate cortical cyctoarchitecture, but normal density of neurons and interneurons in the posterior cingulate cortex and fusiform gyrus in autism. Autism Res. 2011;4:200–211. doi: 10.1002/aur.188. [DOI] [PMC free article] [PubMed] [Google Scholar]
- Peça J, Feliciano C, Ting JT, Wang W, Wells MF, Venkatraman TN, Lascola CD, Fu Z, Feng G. Shank3 mutant mice display autistic-like behaviours and striatal dysfunction. Nature. 2011;472:437–442. doi: 10.1038/nature09965. [DOI] [PMC free article] [PubMed] [Google Scholar]
- Marshall CR, Noor A, Vincent JB, Lionel AC, Feuk L, Skaug J, Shago M, Moessner R, Pinto D, Ren Y, Thiruvahindrapduram B, Fiebig A, Schreiber S, Friedman J, Ketelaars CE, Vos YJ, Ficicioglu C, Kirkpatrick S, Nicolson R, Sloman L, et al. [Google Scholar]
- Radyushkin K, Hammerschmidt K, Boretius S, Varoqueaux F, El-Kordi A, Ronnenberg A, Winter D, Frahm J, Fischer J, Brose N, Ehrenreich H. Neuroligin-3-deficient mice: model of a monogenic heritable form of autism with an olfactory deficit. Genes Brain Behav. 2009;8:416–425. doi: 10.1111/j.1601-183X.2009.00487.x. [DOI] [PubMed] [Google Scholar]
- Rakic P. Evolution of the neocortex: a perspective from developmental biology. Nat Rev Neurosci. 2009;10:724–735. doi: 10.1038/nrn2719. [DOI] [PMC free article] [PubMed] [Google Scholar]
- Rushworth MF, Behrens TE, Rudebeck PH, Walton ME. Contrasting roles for cingulate and orbitofrontal cortex in decisions and social behaviour. Trends Cogn Sci. 2007;11:168–176. doi: 10.1016/j.tics.2007.01.004. [DOI] [PubMed] [Google Scholar]
- Shao Y, Raiford KL, Wolpert CM, Cope HA, Ravan SA, Ashley-Koch AA, Abramson RK, Wright HH, DeLong RG, Gilbert JR, Cuccaro ML, Pericak-Vance MA. Phenotypic homogeneity provides increased support for linkage on chromosome 2 in autistic disorder. Am J Hum Genet. 2002;70:1058–1061. doi: 10.1086/339765. [DOI] [PMC free article] [PubMed] [Google Scholar]
- Shibasaki T, Takahashi H, Miki T, Sunaga Y, Matsumura K, Yamanaka M, Zhang C, Tamamoto A, Satoh T, Miyazaki J, Seino S. Essential role of Epac2/Rap1 signaling in regulation of insulin granule dynamics by cAMP. Proc Natl Acad Sci U S A. 2007;104:19333–19338. doi: 10.1073/pnas.0707054104. [DOI] [PMC free article] [PubMed] [Google Scholar]
- Silva AJ, Murphy GG. cAMP and memory: a seminal lesson from Drosophila and Aplysia. Brain Res Bull. 1999;50:441–442. doi: 10.1016/s0361-9230(99)00124-0. [DOI] [PubMed] [Google Scholar]
- Silverman JL, Yang M, Lord C, Crawley JN. Behavioural phenotyping assays for mouse models of autism. Nat Rev Neurosci. 2010;11:490–502. doi: 10.1038/nrn2851. [DOI] [PMC free article] [PubMed] [Google Scholar]
- Srivastava DP, Woolfrey KM, Penzes P. Analysis of dendritic spine morphology in cultured CNS neurons. J Vis Exp. 2011;53:e2794. doi: 10.3791/2794. [DOI] [PMC free article] [PubMed] [Google Scholar]
- Srivastava DP, Woolfrey KM, Jones KA, Anderson CT, Smith KR, Russell TA, Lee H, Yasvoina MV, Wokosin DL, Ozdinler PH, Shepherd GM, Penzes P. An autism-associated variant of Epac2 reveals a role for Ras/Epac2 signaling in controlling basal dendrite maintenance in mice. PLoS Biol. 2012;10:e1001350. doi: 10.1371/journal.pbio.1001350. [DOI] [PMC free article] [PubMed] [Google Scholar]
- Tardito D, Maina G, Tura GB, Bogetto F, Pioli R, Ravizza L, Racagni G, Perez J. The cAMP-dependent protein kinase substrate Rap1 in platelets from patients with obsessive compulsive disorder or schizophrenia. Eur Neuropsychopharmacol. 2001;11:221–225. doi: 10.1016/s0924-977x(01)00088-8. [DOI] [PubMed] [Google Scholar]
- Torii M, Hashimoto-Torii K, Levitt P, Rakic P. Integration of neuronal clones in the radial cortical columns by EphA and ephrin-A signalling. Nature. 2009;461:524–528. doi: 10.1038/nature08362. [DOI] [PMC free article] [PubMed] [Google Scholar]
- Ulucan C, Wang X, Baljinnyam E, Bai Y, Okumura S, Sato M, Minamisawa S, Hirotani S, Ishikawa Y. Developmental changes in gene expression of Epac and its upregulation in myocardial hypertrophy. Am J Physiol Heart Circ Physiol. 2007;293:H1662–H1672. doi: 10.1152/ajpheart.00159.2007. [DOI] [PubMed] [Google Scholar]
- Wang H, Liang S, Burgdorf J, Wess J, Yeomans J. Ultrasonic vocalizations induced by sex and amphetamine in M2, M4, M5 muscarinic and D2 dopamine receptor knockout mice. PLoS One. 2008;3:e1893. doi: 10.1371/journal.pone.0001893. [DOI] [PMC free article] [PubMed] [Google Scholar]
- Wang X, McCoy PA, Rodriguiz RM, Pan Y, Je HS, Roberts AC, Kim CJ, Berrios J, Colvin JS, Bousquet-Moore D, Lorenzo I, Wu G, Weinberg RJ, Ehlers MD, Philpot BD, Beaudet AL, Wetsel WC, Jiang YH. Synaptic dysfunction and abnormal behaviors in mice lacking major isoforms of Shank3. Hum Mol Genet. 2011;20:3093–3108. doi: 10.1093/hmg/ddr212. [DOI] [PMC free article] [PubMed] [Google Scholar]
- Woolfrey KM, Srivastava DP, Photowala H, Yamashita M, Barbolina MV, Cahill ME, Xie Z, Jones KA, Quilliam LA, Prakriya M, Penzes P. Epac2 induces synapse remodeling and depression and its disease-associated forms alter spines. Nat Neurosci. 2009;12:1275–1284. doi: 10.1038/nn.2386. [DOI] [PMC free article] [PubMed] [Google Scholar]
- Yang M, Abrams DN, Zhang JY, Weber MD, Katz AM, Clarke AM, Silverman JL, Crawley JN. Low sociability in BTBR T+tf/J mice is independent of partner strain. Physiol Behav. 2012a doi: 10.1016/jphysbeh.2011.12.025. [DOI] [PMC free article] [PubMed] [Google Scholar]
- Yang Y, Shu X, Liu D, Shang Y, Wu Y, Pei L, Xu X, Tian Q, Zhang J, Qian K, Wang YX, Petralia RS, Tu W, Zhu LQ, Wang JZ, Lu Y. EPAC null mutation impairs learning and social interactions via aberrant regulation of miR-124 and Zif268 translation. Neuron. 2012b;73:774–788. doi: 10.1016/j.neuron.2012.02.003. [DOI] [PMC free article] [PubMed] [Google Scholar]